HAL Id: hal-01606858
https://hal.archives-ouvertes.fr/hal-01606858
Submitted on 18 Jul 2018
HAL is a multi-disciplinary open access
archive for the deposit and dissemination of
sci-entific research documents, whether they are
pub-lished or not. The documents may come from
teaching and research institutions in France or
abroad, or from public or private research centers.
L’archive ouverte pluridisciplinaire HAL, est
destinée au dépôt et à la diffusion de documents
scientifiques de niveau recherche, publiés ou non,
émanant des établissements d’enseignement et de
recherche français ou étrangers, des laboratoires
publics ou privés.
Dynamics of aggregate size and shape properties under
sequenced flocculation in a turbulent Taylor-Couette
reactor
Léa Guerin, Carole Coufort-Saudejaud, Alain Liné, Christine Frances
To cite this version:
Léa Guerin, Carole Coufort-Saudejaud, Alain Liné, Christine Frances. Dynamics of aggregate size
and shape properties under sequenced flocculation in a turbulent Taylor-Couette reactor. Journal
of Colloid and Interface Science, Elsevier, 2017, 491, pp.167-178. �10.1016/j.jcis.2016.12.042�.
�hal-01606858�
OATAO is an open access repository that collects the work of Toulouse
researchers and makes it freely available over the web where possible
Any correspondence concerning this service should be sent
to the repository administrator:
tech-oatao@listes-diff.inp-toulouse.fr
This is an author’s version published in: http://oatao.univ-toulouse.fr/20384
To cite this version: Guerin, Lea
and Coufort, Carole
and
Liné, Alain and Frances, Christine
Dynamics of aggregate size
and shape properties under sequenced flocculation in a turbulent
Taylor-Couette reactor. (2017) Journal of Colloid and Interface
Science, 491. 167-178. ISSN 0021-9797
Official URL:
http://doi.org/10.1016/j.jcis.2016.12.042
Open Archive Toulouse Archive Ouverte
Dynamics of aggregate size and shape properties under sequenced
flocculation in a turbulent Taylor-Couette reactor
Léa Guérin
a, Carole Coufort-Saudejaud
a, Alain Liné
b, Christine Frances
a,⇑aLaboratoire de Génie Chimique, Université de Toulouse, CNRS, INPT, UPS, Toulouse, France bLISBP, Université de Toulouse, CNRS, INRA, INSA, Toulouse, France
g r a p h i c a l
a b s t r a c t
Keywords: Flocculation Hydrodynamics Morphology Turbulent Taylor-Couette Breakup Aggregation Shape Regrowth Circularitya b s t r a c t
This paper concerns experimental investigation of the sequenced flocculation of latex particles in a Taylor-Couette reactor. The aim of this work was to investigate the evolution of both the size and the shape of aggregates under sequenced hydrodynamics. A number of studies have focused on the evolution of the aggregate size or size distribution during steps of growth-breakage-regrowth, but aggregates gen-erally experience steps of breakage-regrowth on repeated occasions in real operating conditions (pas-sages near the impeller or during the transfer processes, for example). The experiments conducted in this work consisted thus of an alternation of six steps with alternately low and high shear rates under turbulent conditions. The particle size distributions were monitored throughout the sequencing, and the circularity and convexity (shape parameters) distributions were measured, enabling a more precise description of the entire floc population, rather than a fractal dimension. While the aggregate size distri-bution was clearly controlled by hydrodynamics, the shape distridistri-butions continuously evolved during the sequencing. The main new finding of our work notes the independence between the aggregate shape and hydrodynamics. Indeed, after multiples steps of breakage-regrowth, regardless of the aggregate size distribution and hydrodynamics, the aggregate shape seemed to reach a unique steady-state morphological distribution. !2016 Elsevier Inc. All rights reserved.
1. Introduction
Coagulation-flocculation is one of the most common processes used for the removal of fine particles in water. One of its well-known applications is water treatment, in which it facilitates ⇑ Corresponding author.
E-mail addresses:lea.guerin@ensiacet.fr(L. Guérin),carole.saudejaud@ensiacet.fr
(C. Coufort-Saudejaud),alain.line@insa-toulouse.fr(A. Liné),christine.frances@ensiacet.fr
reduction of both the water turbidity and the amount of organic matter. The final properties of particulate systems result from aggregation processes during which primary particles stick together to form clusters and agglomerates or flocs whose size can finally reach several millimetres.
Consecutively to the aggregation of particles, various sizes and shapes of flocs can be observed in a suspension. In the case of water treatment, the flocculation step is commonly followed by a settling or filtration step whose efficiency can be greatly altered by the size, shape and aggregate density[1,2]. Producing aggre-gates with desired properties is thus crucial. Indeed, previous stud-ies have shown that, depending on the aggregate shape, the settling velocity could be increased[3]or the resistance of the fil-tration cake could be impacted[4,5]. The coupled investigation of not only the size distributions of the aggregates but also their mor-phological characteristics is thus fundamental. The aggregate char-acterization can be made by either in situ or ex situ measurements. In situ measurements are generally performed by coupling a laser light sheet for illumination with a camera[6–10]whereas ex situ methods are based on confocal laser scanning microscopy[1,11– 13]or sample analyses coupling a microscope and a CCD camera [7,14–17].
Most works concerning aggregate size and morphology focus on monitoring the size distributions (with time or at steady-state) and the fractal dimension (Df). Settling, light scattering and image
anal-ysis are three common methods for determining the fractal dimen-sion. The settling method gives a mass fractal dimension, a function of the aggregate volume [18,19]. The light scattering method consists of plotting the light intensity (I) scattered by the aggregate suspension as a function of scattering vector. Under cer-tain conditions, the fractal dimension of the aggregates may then be deduced from the slope of the resulting curve (I = f(Q)) [11,19–23]. Finally, image processing enables connection of the area of the aggregate ðAÞ with its perimeter ðPÞ or its length ðlÞ (A / P2=Dpf or A / lDfÞ[19,23]. However, they all fail to represent
the wide diversity within a population of aggregates. Indeed, the fractal dimension is not an individual characteristic but a global one[10,24–27]. This deficiency can be overcome by analyzing both the size and morphology distributions.
It is commonly observed that, depending on the hydrodynam-ics, the aggregate size can be greatly affected[28–31]. An increase in the applied shear rate generally leads to an aggregate diameter decrease associated with a tightened distribution and an increased fractal dimension. In stirred tanks or during the transfer processes, for example, aggregates are submitted to various shear rates due to the heterogeneity of hydrodynamics. Those shear rate fluctuations have led some authors to analyse the impact of steps of breakage and regrowth on the aggregate size and morphology[26,32]. These works often show that, in simple cycled shear flocculation cases (a step of growth immediately followed by a step of breakage and a step of regrowth), the diameter of the aggregates after a step of regrowth is generally lower than the diameter before the breakage step. Moreover, it has been shown that the fractal dimension value is higher after the regrowth step than after the first flocculation step, which is representative of more compact aggregates. Cycled shear flocculation thus seems irreversible [24,28]. However, although several authors have investigated the case of floc break-age and regrowth, few have studied solid-liquid suspension beha-viour after more than one step of breakage to find out if the irreversibility phenomenon continues [6,33,34]. Those studies have generally provided data concerning the aggregate sizes but nothing about their morphology. More recently, some works have reported on morphological image analysis with the aim of better understanding the effect of hydrodynamics on floc properties [9,35–37].
In this context, the present work provides new results obtained during hydrodynamic sequencing experiments in a Taylor-Couette reactor under turbulent conditions. The objective of this article is to investigate the impact of several steps of breakage and regrowth under varying hydrodynamic conditions on both the size and the shape of latex aggregates. An in situ monitoring of the aggregate sizes has been conducted using a particle size analyser, providing access to the volume size distributions of aggregates with time. After each shear rate change, a sample of the suspension was anal-ysed with a microscope coupled with image analysis software, pro-viding several shape parameter values for each aggregate.
2. Experimental setup 2.1. Materials and devices
Spherical polystyrene latex particles from Polysciences Inc. with a diameter of 0.2
l
m and a high level of surface sulphate groups were used for the experiments. All of the experiments have been conducted with a volume fraction of latex primary particles of 3.5 $ 10%5. NaCl was chosen as a coagulant. A salt solution wasprepared with a concentration of 82 g of NaCl per litre. This con-centration is higher than the critical coagulation concon-centration, and its value was chosen to have the same density between the particles and the solution (
q
= 1055 kg m%3), thus avoidingdiffer-ential sedimentation phenomena during the experiments. Two litres of the salt solution were prepared several hours before the experiments using demineralized water, placed in a beaker and submitted to vigorous stirring to remove air bubbles, which could bias the results afterwards. All the experiments were carried out at room temperature, which ranged from 20 to 25 "C.
After the stirring, the solution was poured into the Taylor-Couette reactor. This apparatus is composed of two concentric cylinders: an inner cylinder with a radius (Ri) of 10 cm and an outer
cylinder with a radius (Ro) of 11.5 cm and a height (H) of 20 cm.
The outer cylinder is fixed, while the inner one can rotate at vari-ous angular velocities ðXÞ, which can be controlled via a monitor. The reactor used during the experiments has been previously described in the literature[9].
The total volume of the reactor is approximately 2 L, and the solution fully fills the gap between the cylinders. The reactor is also equipped with tangential outlets, allowing the suspension to be sampled without damaging the aggregates. There are also two apertures on the top of the reactor to perform a direct sampling of the suspension using a syringe whose tip has been cut to widen it, thus yielding a sufficient diameter (approximately 3 mm) to
avoid breaking the latex aggregates formed during the
experiments.
A Taylor-Couette reactor was chosen in this study because the hydrodynamics and flow regimes inside such a reactor are well characterized and it is possible to create a controlled shear flow [38]. The flow regime in such a reactor is characterized by the Tay-lor and Reynolds numbers, the expressions of which are respec-tively given in Eqs.(1) and (2).
Ta ¼Ri
X
2 ðRo% RiÞ3m
2 ð1Þ Re ¼RiX
ðRm
o% RiÞ¼ TaRi ðRo% RiÞ ! "12 ð2Þ In whichXis the angular velocity [rad s%1] andm
is thekine-matic viscosity [m2s%1]. The experiments have been carried out
111 rpm, corresponding to Taylor Numbers between 1.2 ' 106and
4.6 ' 107. According to Kataoka[38], the regime was always a
tur-bulent vortex flow.
The shear rate G can be derived from the dimensionless torque T [–] provided by Wendt[39]. T ¼ 1:45 f3=2 ð1%fÞ7=4Re 1:5 for 4 102< Re < 104 0:23 f3=2 ð1%fÞ7=4Re 1:7 for 104 < Re < 105 8 < : ð3Þ where f [–] is the radius ratio f ¼ Ri=Ro.
The torque C [N m] is related to T via the following relation:
C ¼
qm
T2H ð4Þwhere
q
is the suspension density [kg m%3]. The global power P [W]dissipated in the reactor is derived from the torque C:
P ¼ C
X
ð5Þwhich allowed estimation of the mean dissipation rate of the turbu-lent kinetic energy h
e
i [m2s%3] by Eq.(6):h
e
i ¼q
PV ð6Þin which V is the volume of the suspension in the reactor [m3]. The
mean shear rate hGi [s%1] was obtained through Eq.(7):
hGi ’ ffiffiffiffiffiffi h
e
im
r ð7Þ Finally the relation between the shear rate and the dimension-less torque is hGi ’ ffiffiffiffiffiffiffiffiffiffiffiffiffiX
THm
V r ð8ÞThe mean Kolmogorov microscale h
g
i [l
m] were obtainedthroughout Eq.(7): h
g
i ’m
hGi ! "12
ð9Þ Moreover, the main mechanism allowing the collision of pri-mary particles or flocs can be deduced from the value of the Peclet number. Indeed, the Peclet, as defined by Eq.(10), expresses the relative importance of the Brownian motion versus the convection time[11], where the term6plr30
KT represents the time corresponding
to the Brownian motion and 1
hGiis the convection time.
Pe ¼6
pl
r30KT hGi ð10Þ
where r0 is the aggregate radius [m], K the Boltzmann constant
[J K%1] and T the temperature [K].
Using the latex beads and applying the physico-chemical and hydrodynamical conditions as defined previously, the Peclet num-ber obtains values higher than 1 for aggregates having a diameter above 0.4
l
m. Thus, at the beginning of aggregation, the Brownian motion is preponderant, but quickly after, the aggregation process is controlled by the flow velocity gradients. The orthokinetic aggre-gation was thus the dominant mechanism.During the experiments, the reactor was connected to a particle size analyser (Mastersizer 2000, Malvern Instruments) and a peri-staltic pump, which enabled the suspension to circulate from the reactor to the particle size analyser and then back to the reactor. Prior to each experiment, particular care was taken to ensure that the shear rate in the plastic hoses between the different devices was equivalent to that inside the reactor. At each change of the rotation speed of the inner cylinder, the flow rate of the pump
was also modified, thus permitting the system to have the same average shear rate everywhere in the experimental device for each of the 6 steps of the hydrodynamic sequencing presented inFig. 1. The changes in hydrodynamic conditions caused by the measure-ment and recycling loop were minimized.
Both in situ and ex situ measurements were carried out. In situ measurements were conducted with the help of the Mastersiz-er2000 based on the laser diffraction principle. During the experi-ments, measurements of the aggregate sizes were performed every 20 s for approximately 13 min at the beginning of each step and for approximately 2 min at the end at a given shear rate. Additionally, ex situ measurements were conducted using an automated particle characterization system, the Morphologi G3 (Malvern Instru-ments), composed of a microscope coupled to image analysis soft-ware. Thus, the morphological characteristics were measured at the end of each shear rate step. To that purpose, at the end of each step, a sample of the suspension was carefully collected thanks to an opening on the lid inside the reactor. Then, the sample was poured between two glass plates separated by a gasket, which reduces the risk of deforming the aggregates and thus of biasing the results during the image analysis. Then, the sample was auto-matically scanned, and digital images were created. Approximately 7.5 $ 104 aggregates were measured for each sample. For each
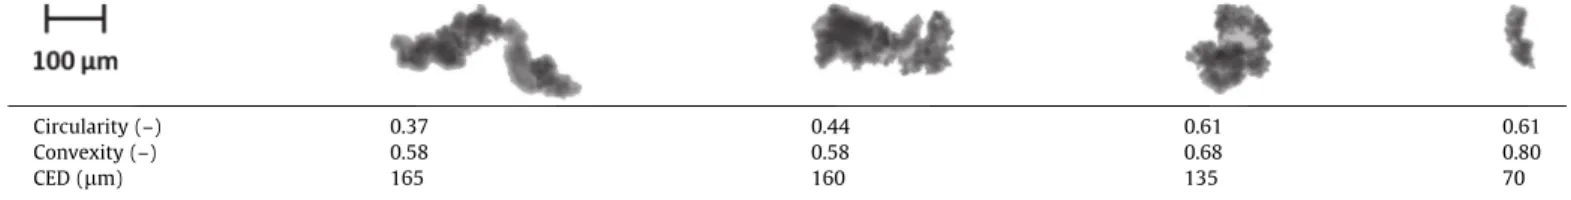
aggregate, the following was measured: the perimeter, area, lengths, widths and maximal distances. Knowing these parame-ters, it was possible to calculate morphological parameparame-ters, such as the circle equivalent diameter (CED), the circularity, the convex-ity, the solidconvex-ity, and the elongation. In this study, the circularity was chosen as a characteristic parameter of the aggregate shape. It is calculated by dividing the perimeter of a circle having the same area as the aggregate projected image by the image’s actual perimeter. Supplementary results concerning the convexity are reported in the online version of the paper. The convexity is the ratio of the image’s convex hull to the image’s actual perimeter. As an example, respective values of the circularity and the convex-ity for four different aggregates having different sizes are given in Table 1. It can be observed that particles having identical circular-ity may have different convexcircular-ity and vice versa. It also emphasizes the increase in the circularity values when the considered aggre-gate is more rounded and the increase in the convexity values when its surface is less rough.
A comparison of the surface size distributions of the aggregates obtained using the two devices is given inAppendix A.
2.2. Experimental protocol of the sequenced flocculation
All the experiments were conducted in the Taylor-Couette reac-tor presented above. After the addition of the salt solution and prior to that of the polystyrene latex particles, the angular velocity of the inner cylinder was set. Hydrodynamic sequencing, which consists of an alternation of low and high shear rate steps, was then performed. All the experiments that have been carried out started with a step of 30 min where the inner cylinder was slowly rotating, followed by an alternation of 5 steps with fast and slow rotation speeds of one hour each. The hydrodynamic sequencing scheme is illustrated inFig. 1.
The low shear rate steps were conducted under 3 different shear rate values depending on the experiments. These values were 18, 30 and 46 rpm, providing mean shear rate values (referred to as LSRs) of 34, 65 and 112 s%1, respectively. For all
the experiments, the same angular velocity was set for the high shear rate steps. Its value was 111 rpm, corresponding to a shear rate (referred to as an HSR) of 350 s%1. As during the Low Shear
Rate (LSR) steps, aggregation mostly occurs in the reactor; steps 1, 3 and 5 will be denoted hereafter in this article by Aggregation 1, 2 and 3 (i.e., A1, A2 and A3), respectively. On the contrary, during
High Shear Rate steps (HSR), mostly breakage phenomena occur, and the corresponding steps will be named Breakage 1, 2 and 3 (i.e., B1, B2 and B3).
3. Results and discussion
3.1. Evolution of aggregate properties throughout the sequenced flocculation at a fixed low shear rate
3.1.1. Particle size distribution evolutions across time
Typical volume size distributions obtained during experiments conducted with a low shear rate value (LSR) of 34 s%1using the
particle size analyser are presented here. The abscissae labelled ‘‘size” represents the equivalent spherical diameter.
Fig. 2presents the volume size distribution evolutions during each step with alternately low (Fig. 2a, c, e) and high shear rates (Fig. 2b, d, f). For each step, different distributions are given at var-ious times of the experiment. At the end of each step, a steady state seems to be reached.
During the first step (A1) (Fig. 2a), the aggregate size is increas-ing. The first distribution on the left was obtained a few seconds after the beginning of the experiments and highlights the presence of mainly primary particles with diameters of 0.2
l
m. Aggregates are then progressively formed and grow until they reach a station-ary size. The mode of the distributions is close to the value of themean Kolmogorov microscale (170
l
m) represented by a blackvertical line in the graphs. Because there are zones with higher dis-sipations, these zones may control the floc size; thus, it is logical to obtain floc sizes lower than the mean Kolmogorov scale. Likewise, the presence of zones with low dissipations makes it possible to create aggregates larger than the mean Kolmogorov scale[33].
During step 2 (B1) (Fig. 2b), a shear rate of 350 s%1is applied.
The aggregate size is decreasing since mostly breakage is occurring in the reactor due to the high value of the shear rate.
Thereafter, the same process is repeated for the following steps. During the low shear rate steps (A2, A3), an increase in the aggre-gate size is observed when a decrease occurs at high shear rate val-ues (B2, B3). Two populations are identified: a population of large aggregates for whom the mode depends on the step and the heterogeneous hydrodynamics in the reactor and particularly on
the presence of zones with higher stresses and a population of small aggregates with a diameter of a few micrometres. However this population of small aggregates is almost insignificant in most cases.
Furthermore, it has been observed that the spread of the distri-butions remains similar throughout the experiments.
Under a low shear rate (values of 65 s%1or 112 s%1), the same
type of results, not reported here, were observed, except that the amplitude of the size variations was lower for the highest shear rates.
3.1.2. Size distribution comparison at different stationary steps Fig. 3(a) compares the size distributions at steady-state obtained after each step (A1, A2, A3) performed under a low shear rate of 34 s%1, which mainly promotes aggregation. It is observed
that the aggregate size decrease is significant from the first step (A1) to the second one (A2) and is then much less significant between the last two (A2 and A3), the distributions being rather similar here. The same type of result was obtained for the experi-ments conducted under different low shear rates (LSR = 65 s%1and
LSR = 112 s%1) (seeFigs. 8 and 9 in the supplementary materials)
characterized by a decrease in aggregate sizes after several cycles conducted at low shear rate.
Similar results were obtained by several authors concerning the aggregation of particles performed either in standard mixing tanks [6,7,10,27,33,40,41]or in Taylor-Couette reactors[9,33,40].
Fig. 3b presents the floc size distributions obtained at steady-state after each step (B1, B2, B3) performed under a high shear rate (HSR = 350 s%1) (see also Figs. 10 and 11 in the supplementary
materials). Almost the same volume size distribution is observed after each step, which induces a breakage process regardless of the floc size distribution previously obtained when applying a low shear rate. Such High Shear Rate steps, promoting the break-up of flocs, lead to similar aggregate size distributions.
3.1.3. Shape parameter comparison at different stationary steps The results presented in this section have been obtained by image analysis for an experiment performed according to the
hydrodynamic sequencing scheme illustrated in Fig. 1 with
LSR = 34 s%1 and HSR = 350 s%1. Samples of the suspension were
Fig. 1.Hydrodynamic sequencing scheme.
Table 1
Circularity, convexity and CED values of four given aggregates.
Circularity (–) 0.37 0.44 0.61 0.61
Convexity (–) 0.58 0.58 0.68 0.80
taken from the Taylor-Couette reactor at the end of each step when applying a low or high shear rate. The circularity was considered to compare the shape properties of aggregates between the different steps carried out at low and high shear rate values. The circularity
surface distributions are plotted inFig. 4and are discussed latter in this paper. In a first step, to facilitate comparison with other liter-ature, for large enough aggregates (Circle Equivalent Diame-ter > 10
l
m and Area > 100 pixels), the perimeter fractalFig. 2.Transient evolution of particle volume size distribution.
dimension (DpfÞ have been computed according to the following
relation A / P2=Dpf. The results are plotted inFig. 12 of the
supple-mentary materials. The order of magnitude of Dpfis consistent with
the values of the literature for latex or mineral aggregates [10,15,24,42–44]. For almost all steps, it can be noticed that Dpf
is all the more high that the LSR is low that is consistent with the data of the literature. Focusing on the experiment with the lowest LSR (34 s%1), the breakage steps (B1, B2, B3) lead to a
decrease of the Dpf indicating that the flocs tend to become more
rounded, compact and less convoluted as found by[10,24,44]. Con-cerning the experiments performed with the highest LSR (65 s%1
and 112 s%1), the D
pfonly slightly changes along the different steps
of the hydrodynamic sequencing. As a consequence, it is not possi-ble to derive any straight conclusion about the evolution of the shape or of the surface roughness of the aggregates with such data. Spicer et al.[42]or Serra and Casamitjana[45]or more recently Kikuchi et al.[43]reported analogous results.
The circularity distributions obtained at LSR = 34 s%1(Steps 1, 3
and 5 onFig. 4a) reveal an increase in the circularity from one step to the other. The aggregates are more and more rounded and pre-sent less concavities as the number of cycle increases. On the con-trary, the distributions obtained at HSR = 350 s%1(Steps 2, 4 and 6
inFig. 4a) provide evidence of a continuous decrease in the circu-larity. Finally, a swing of the circularity distributions around a final steady-state distribution can be observed as the shear rate is chan-ged from a low level (LSR = 34 s%1, 65 s%1or 112 s%1) to a high one
(HSR = 350 s%1). This swing is accompanied by a slowing down
effect, which seems to lead to a stable distribution. It is also worth noting that the shape distribution at the end of the sequencing is almost independent of the LSR. The aggregate morphology thus appears to be mainly dependent on the step of the hydrodynamic sequencing. Nonetheless, after several steps at alternately low and high shear rates, the distributions reach a steady state in terms of morphology. This morphological steady state is reached even
A1 (step 1) B1 (step 2) A2 (step 3) B2 (step 4) A3 (step 5) B3 (step 6)
faster when the low shear rate value is high and closer to the high shear rate value (Fig. 4b and c). In other words, the number of steps necessary to reach the steady-state shape distribution is smaller for the highest of the low shear rate values. This shape distribution is independent of the applied shear rate.
3.2. Influence of the shear rate on the aggregate properties (size and shape)
3.2.1. Influence on the aggregate size distribution
In the graphs presented inFig. 5, which were obtained by laser diffraction, steady-state volume size distributions are given for three different experiments conducted with shear rate values of 34 s%1, 65 s%1 and 112 s%1, respectively, for the LSR steps and a
shear rate of 350 s%1for each HSR step in all cases. There are thus
6 graphs corresponding to each step of the hydrodynamic sequenc-ing scheme illustrated inFig. 1.
Concerning the steps A1, A2 and A3 (Fig. 5a, c, e), corresponding to the steps with low shear rate values, where there is mostly aggregation occurring in the Taylor-Couette reactor, a significant decrease in aggregate sizes with a shear rate increase is noticed.
It is also noteworthy that, whatever the shear rate, approximately the same amount of aggregates between 1 and 10
l
m is remaining (particularly for A2 and A3). The dependence of the size of the aggregates on G is consistent with those of previous works [6,33,47–50]. When the shear rate increases, the agglomeration frequency increases since its expression is a function of the shear rate[46]. Following the previous statement, the size of aggregates should thus increases with the shear rate. However this is obvi-ously not the case as can be seen inFig. 5(a, c, e). Two major rea-sons can explain this finding. The first reason is due to the collision efficiency. The latter is commonly a function of the shear rate, size, and surface properties of the colliding particles. Since, the dependency on the shear rate can be experimentally investi-gated[51,52], the collision efficiency is often written under the fol-lowing form:a
¼ Keff' G%c ð11ÞIndeed, numerous experimental as theoretical studies[53–55] reported a rather weak dependence of Keff on G that can thus be
considered constant. The value of the exponent c is typically in the range 0.11–0.23[56,57,44]. In our case, increasing the shear
rate leads thus to a decrease of the collision efficiency. The second reason can be explained by an increase of the breakage frequency that is proportional to the shear rate:
B ¼ K1' GK2 ð12Þ
where K2 is strictly positive [50,44,58]. As a consequence, as G
increases, two aggregates have thus a higher probability to collide but their collision will be less efficient and they thus will be more likely to break. Thus, the decrease of the aggregate size observed inFig. 5(a, c, e) as the shear rate increases is due to the conjunction of smaller collision efficiency and higher hydrodynamic stresses.
Concerning the steps B1, B2 and B3 (Fig. 5b, d, f), corresponding to the steps with the highest shear rate value (HSR = 350 s%1), there
is no significant difference between the volume size distributions obtained at steady-state for each experiment conducted with dif-ferent LSR values during the aggregation steps A1, A2 and A3. It can thus be concluded that the volume size distributions are not affected by the shear rate value imposed during the previous step but only by those of the concerned step. In other words, the vol-ume size distribution of aggregates obtained after a break-up step does not depend on the size distribution prior to the breakage or during the previous low shear rate step.
3.2.2. Influence on the aggregate shape distribution
Fig. 6presents a comparison of the surface distributions of the circularity obtained after different steps for three experiments con-ducted with LSR = 34, 65 and 112 s%1and similar HSR (350 s%1).
Some differences between the distributions can be observed. How-ever, the results that were obtained after each of the 6 steps for the three LSR values reveal fewer disparities than what was observed when comparing the morphological parameter surface distribu-tions after any step regardless of the LSR value (Fig. 4). The aggre-gate morphology seems thus to be less sensitive to the hydrodynamics than to the suspension history. The number of HSR steps permits the control of both the size and shape of the
aggregates, and this control happens even faster when the LSR value is high. Contrary to the size, there is no direct link between the hydrodynamics and the morphology distributions. Further-more, the differences between the distributions become less and less significant from one step to the next.
In the previous part, it has been shown that the same volume size distributions were obtained at HSR, independently of the pre-vious LSR value, and that the aggregate sizes were directly corre-lated to the shear rate as presented inFig. 6. The morphological comparisons permit adding that, despite the fact that the aggre-gates formed at a given shear rate have the same sizes, they do not necessarily have the same morphological properties, depend-ing on the step in which they were analysed. Similar results could be observed whatever the step of the hydrodynamic sequencing experiments (A1, A2, A3 or B1, B2, B3).
3.2.3. Bi-dimensional representations of the circularity
A complementary analysis is now proposed in the following considering the bi-dimensional representations of the circularity after each step of the hydrodynamic sequencing. Until now, aggre-gate sizes and morphology have been analysed separately. A com-plementary analysis is proposed, coupling size and morphology results. The circularity is given by the ratio of 2p(
p
'area) on the aggregate perimeter. On one hand, the numerator of the circularity can be expressed using the Circle Equivalent Diameter (CED) of a particle of a given area and is thus proportional top
'CED. The expression 2p(p
'area) is thus related to a size. On the other hand, the perimeter, which expresses the presence of concavities at the surface of the aggregates, can be observed as characteristic of the aggregate shape. The experimental data obtained via image analy-sis (Morphologi G3) can thus be plotted using a bi-dimensional representation, as shown inFig. 7. On the x-axis, the information regarding the aggregate size is reported (2p(p
'area)), whereas onthe y-axis, the information regarding the aggregate shape is pre-sented (Perimeter). By this representation, the first bisecting line
represents iso values of one for the circularity, and other iso values of circularity are represented by straight lines (dotted lines in Fig. 7). As the circularity does not exceed 1, only half of the graph surface is needed. The results obtained when applying an LSR value of 34 s%1are presented in the upper part of the graph, whereas the
results obtained at LSR = 65 s%1are plotted in the lower triangular
part of the bi-dimensional graphs to allow a direct comparison of the results obtained for the two experiments (see alsoFig. 13 in the supplementary materialsfor other experimental conditions). Two identical populations will thus be symmetric with respect to the first bisecting line.
Whatever the step, the circularity is thus correlated to the perimeter, which is the denominator of the circularity equation
circularity ¼2,PerimeterðAÞpffiffiffiffiffiffiffiffiffiffiffiffiffiffiffip,AreaðAÞ
! "
. However, for a given aggregate size, some disparities in the circularity are revealed, even though they are in a limited range. For example, for a value of 200 (
l
m) on the abscissa, the circularity values approximately range between 0.5 and 0.7. Inversely, several values of the circularities can be obtained for one given perimeter value chosen on the ordinate. In other words, the size and shape properties are independent vari-ables. This leads to the conclusion that only a bidimensional repre-sentation or population balance modelling can express the complexity of the morphological properties of aggregates and the effect of hydrodynamics on their evolution during a flocculation process.4. Conclusions
Sequenced hydrodynamic experiments under turbulent condi-tions have been conducted in a Taylor-Couette reactor. These experiments consisted of a sequence of six successive Low Shear Rate (LSR) and High Shear Rate (HSR) steps. In situ measurements using a laser diffraction device enabled monitoring of the volume size distributions throughout the experiments. Ex situ measure-ments using a microscope coupled with image analysis software permitted measurement of the shape characteristics of a sample of the suspension after each LSR or HSR step.
The results have shown that hydrodynamics has a direct impact on the aggregate sizes and emphasized the decrease of the floc Cir-cle Equivalent Diameter value with a shear rate increase [6,26,28,33]. The HSR steps, promoting the break-up of flocs, lead to a calibration of the aggregate size distribution in connection with the heterogeneity of the hydrodynamics inside the reactor. The results also highlighted the decrease in size observed after the first regrowth step when applying a low shear rate, which is in accordance with previous results from the literature[10,34].
Particular attention was then paid to the morphological proper-ties of the flocs obtained under different shear rates and during the sequencing hydrodynamic scheme. This revealed new results con-cerning the link between an aggregate’s shape, history and shear rate. Contrary to the size, which was directly correlated to the shear rate, the floc morphology, characterized by the circularity or the convexity, is less sensitive to hydrodynamics. It has been shown that the surface distributions of the considered morpholog-ical parameters were continuously evolving throughout the exper-iments but tended to reach a steady-state morphological distribution after several steps. This new finding was probably observed in this study because three successive hydrodynamic cycles were imposed compared to the one or two cycles usually applied in the available literature[26,32]. The steady-state shape distribution appears to be independent of the applied shear rate, but the number of steps necessary to reach it is smaller for the highest LSR values. This was confirmed by a bi-dimensional
representation of the size and shape characteristics, which high-lighted the independence of the circularity from the shear rate and its connection to the aggregate perimeter.
The impact of other types of coagulants and geometries (stan-dard mixing tank) on the size and shape characteristics of the aggregate population is now under investigation. This experimen-tal database will be further used to develop a bidimensional popu-lation balance model able to reproduce the full morphological characteristics of aggregates to obtain better control of particulate processes. The 2D representation that was developed in this study could be extended in future works to other parameters of interest since it helps in visualizing the degree of dependence between two characteristic parameters or between one parameter and an exter-nal variable.
Acknowledgments
The authors would like to thank French minister of research for financial support and Fédération de recherche Fermat for the tech-nic and scientific support.
Appendix A. Comparison of the CED by laser diffraction and image analysis
The Mastersizer2000 allows for the analysis of aggregates whose sizes range from 0.02
l
m to 2000l
m, while the 10 times magnification of the MorphologiG3 yields results for aggregatesbetween 3.5 and 210
l
m. The Mastersizer2000 estimates a 3Dspherical equivalent diameter whereas the MorphologiG3 per-forms a 2D analysis of floc images that gives access to surface dis-tributions of Circle Equivalent Diameter. Moreover the class sizes used in both methods are not the same making impossible their direct comparison. Hence, we decided to transform the Mastersiz-er2000 volume distributions into surface distributions and use the same class sizes as those used by the MorphologiG3. The computa-tion steps involve many assumpcomputa-tions, such as the fact that the measured aggregates are spherical which is obviously not the case. It must be kept in mind that the comparison of both distributions is rather qualitative than quantitative. It has been observed that, in most cases, the size distributions obtained with the two devices were rather similar. However in some cases the differences were enhanced since many small aggregates were filtered by the image analysis (MorphologiG3). In the figure, an example of typical sur-face size distributions obtained with those two techniques is given. Graphs a and b show that the results obtained by laser diffraction and laser analysis are rather close to each other, although those two techniques do not measure the same properties. Indeed, the laser sizer estimates a 3D spherical equivalent diameter of parti-cles having the same diffraction properties of the aggregates, whereas the image analyser performs a 2D analysis of the floc images. Graph c, on the contrary, provides evidence of different patterns depending on the technique that has been used. It reveals the existence of small aggregates when considering the distribu-tion given by laser diffracdistribu-tion. Those small aggregates are not vis-ible in the distribution given by image analysis, even if the image analyser can theoretically measure a wide range of aggregate sizes, since the focus can only be on a restricted part of the aggregate population. When distinct populations of flocs coexist, a more complex image treatment that combines results obtained with dif-ferent thresholds should be performed to obtain a full size distribu-tion. However, in the next sections, the shape analysis is focused on large aggregates, which are potentially more sensitive than
small aggregates to break-up phenomena induced by
Comparison of surface size distributions obtained at the end of various steps by the Mastersizer2000 and the MorphologiG3. Appendix B. Supplementary material
Supplementary data associated with this article can be found, in the online version, athttp://dx.doi.org/10.1016/j.jcis.2016.12.042. References
[1] M. Soos, A.S. Moussa, L. Ehrl, J. Sefcik, H. Wu, M. Morbidelli, Effect of shear rate on aggregate size and morphology investigated under turbulent conditions in stirred tank, J. Colloid Interface Sci. 319 (2) (2008) 577–589,http://dx.doi.org/ 10.1016/j.jcis.2007.12.005.
[2] J. Nan, W. He, J. Song, X. Song, Fractal growth characteristics of flocs in flocculation process in water treatment, in: International Conference on Energy and Environment Technology, 2009. ICEET ’09 2 (2009), 2009, pp. 582– 588,http://dx.doi.org/10.1109/ICEET.2009.379.
[3] R.J. Gibbs, Estuarine flocs: their size, settling velocity and density, J. Geophys. Res. 90 (C2) (1985) 3249,http://dx.doi.org/10.1029/JC090iC02p03249. [4] S.A. Lee, A.G. Fane, R. Amal, T.D. Waite, The effect of floc size and structure on
specific cake resistance and compressibility in dead-end microfiltration, Sep. Sci. Technol. 38 (4) (2003) 869–887,http://dx.doi.org/10.1081/SS-120017631.
[5] W. Xu, B. Gao, Effect of shear conditions on floc properties and membrane fouling in coagulation/ultrafiltration hybrid process—the significance of Alb species, J. Membr. Sci. 415–416 (2012) 153–160,http://dx.doi.org/10.1016/j. memsci.2012.04.046.
[6] D. Bouyer, C. Coufort, A. Liné, Experimental analysis of floc size distributions in a 1-L jar under different hydrodynamics and physicochemical conditions, J. Colloid Interface Sci. 292 (2) (2005) 413–428, http://dx.doi.org/10.1016/j. jcis.2005.06.011.
[7] T. Li, Z. Zhu, D. Wang, C. Yao, H. Tang, The strength and fractal dimension characteristics of alum–kaolin flocs, Int. J. Miner. Process. 82 (1) (2007) 23–29,
http://dx.doi.org/10.1016/j.minpro.2006.09.012.
[8] L. Liang, Y. Peng, J. Tan, G. Xie, A review of the modern characterization techniques for flocs in mineral processing, Miner. Eng. 84 (2015) 130–144,
http://dx.doi.org/10.1016/j.mineng.2015.10.011.
[9] M. Vlieghe, C. Coufort-Saudejaud, C. Frances, A. Liné, In situ characterization of floc morphology by image analysis in a turbulent Taylor-Couette reactor, AIChE J. 60 (7) (2014) 2389–2403,http://dx.doi.org/10.1002/aic.14431. [10] F. Xiao, Y. Peng, J. Tan, G. Xie, PIV characterisation of flocculation dynamics and
floc structure in water treatment, Colloids Surf., A 379 (1–3) (2011) 27–35,
http://dx.doi.org/10.1016/j.colsurfa.2010.11.053.
[11] L. Ehrl, M. Soos, M. Morbidelli, Dependence of aggregate strength, structure, and light scattering properties on primary particle size under turbulent conditions in stirred tank, Langmuir 24 (7) (2008) 3070–3081,http://dx.doi. org/10.1021/la7032302.
[12] Y.M. Harshe, M. Lattuada, M. Soos, Experimental and modeling study of breakage and restructuring of open and dense colloidal aggregates, Langmuir 27 (10) (2011) 5739–5752,http://dx.doi.org/10.1021/la1046589.
[13] A. Thill, S. Veerapaneni, B. Simon, M. Wiesner, J.Y. Bottero, D. Snidaro, Determination of structure of aggregates by confocal scanning laser microscopy, J. Colloid Interface Sci. 204 (2) (1998) 357–362, http://dx.doi. org/10.1006/jcis.1998.5570.
[14] S. Schuetz, M. Piesche, A model of the coagulation process with solid particles and flocs in a turbulent flow, Chem. Eng. Sci. 57 (20) (2002) 4357–4368,http:// dx.doi.org/10.1016/S0009-2509(02)00351-2.
[15] P.T. Spicer, S.E. Pratsinis, M.D. Trennepohl, Coagulation and fragmentation: the variation of shear rate and the time lag for attainment of steady state, Ind. Eng. Chem. Res. 35 (9) (1996) 3074–3080,http://dx.doi.org/10.1021/ie950786n. [16] S. Tang, J.M. Preece, C.M. McFarlane, Z. Zhang, Fractal morphology and
breakage of DLCA and RLCA aggregates, J. Colloid Interface Sci. 221 (1) (2000) 114–123,http://dx.doi.org/10.1006/jcis.1999.6565.
[17] A. Vahedi, B. Gorczyca, Application of fractal dimensions to study the structure of flocs formed in lime softening process, Water Res. 45 (2) (2011) 545–556,
http://dx.doi.org/10.1016/j.watres.2010.09.014.
[18] Y. Adachi, M. Kamiko, Sedimentation of a polystyrene latex floc, Powder Technol. 78 (2) (1994) 129–135,http://dx.doi.org/10.1016/0032-5910(93)02771-2. [19] G.C. Bushell, Y.D. Yan, D. Woodfield, J. Raper, R. Amal, On techniques for the measurement of the mass fractal dimension of aggregates, Adv. Colloid Interface Sci. 95 (1) (2002) 1–50,http://dx.doi.org/10.1016/S0001-8686(00) 00078-6.
[20] B. Cao, B. Gao, M. Wang, X. Sun, J. Wang, Floc properties of polyaluminum ferric chloride in water treatment: the effect of Al/Fe molar ratio and basicity, J. Colloid Interface Sci. 458 (2015) 247–254, http://dx.doi.org/10.1016/j. jcis.2015.07.057.
[21] M. Lattuada, H. Wu, P. Sandkühler, J. Sefcik, M. Morbidelli, Modelling of aggregation kinetics of colloidal systems and its validation by light scattering measurements, Chem. Eng. Sci. 59 (8–9) (2004) 1783–1798,http://dx.doi.org/ 10.1016/j.ces.2004.01.033.
[22] C.M. Sorensen, Light scattering by fractal aggregates: a review, Aerosol Sci. Technol. 35 (2) (2001) 648–687,http://dx.doi.org/10.1080/02786820117868. [23]S. Mancuso, Fractal geometry-based image analysis of grapevine leaves using
the box counting algorithm, VITIS – J. Grapevine Res. 38 (3) (1999) 97. [24] P. Bubakova, M. Pivokonsky, P. Filip, Effect of shear rate on aggregate size and
structure in the process of aggregation and at steady state, Powder Technol. 235 (2013) 540–549,http://dx.doi.org/10.1016/j.powtec.2012.11.014. [25] W. He, J. Nan, H. Li, S. Li, Characteristic analysis on temporal evolution of floc
size and structure in low-shear flow, Water Res. 46 (2) (2012) 509–520,http:// dx.doi.org/10.1016/j.watres.2011.11.040.
[26] P. Jarvis, B. Jefferson, S.A. Parsons, Breakage, regrowth, and fractal nature of natural organic matter flocs, Environ. Sci. Technol. 39 (7) (2005) 2307–2314,
http://dx.doi.org/10.1021/es048854x.
[27] D. Wang, R. Wu, Y. Jiang, C.W.K. Chow, Characterization of floc structure and strength: role of changing shear rates under various coagulation mechanisms, Colloids Surf., A 379 (1–3) (2011) 36–42, http://dx.doi.org/10.1016/ j.colsurfa.2010.11.048.
[28] P.T. Spicer, S.E. Pratsinis, J. Raper, R. Amal, G. Bushell, G. Meesters, Effect of shear schedule on particle size, density, and structure during flocculation in stirred tanks, Powder Technol. 97 (1) (1998) 26–34,http://dx.doi.org/10.1016/ S0032-5910(97)03389-5.
[29] M.M. Clark, J.R.V. Flora, Floc restructuring in varied turbulent mixing, J. Colloid Interface Sci. 147 (2) (1991) 407–421,http://dx.doi.org/10.1016/0021-9797 (91)90174-7.
[30] M. Kobayashi, Breakup and strength of polystyrene latex flocs subjected to a converging flow, Colloids Surf., A 235 (1–3) (2004) 73–78,http://dx.doi.org/ 10.1016/j.colsurfa.2004.01.008.
[31] M. Kobayashi, Y. Adachi, S. Ooi, Breakup of fractal flocs in a turbulent flow, Langmuir 15 (13) (1999) 4351–4356,http://dx.doi.org/10.1021/la980763o.
[32] W. Yu, J. Gregory, L.C. Campos, Breakage and re-growth of flocs: effect of additional doses of coagulant species, Water Res. 45 (20) (2011) 6718–6724,
http://dx.doi.org/10.1016/j.watres.2011.10.016.
[33] C. Coufort, D. Bouyer, A. Liné, Flocculation related to local hydrodynamics in a Taylor-Couette reactor and in a jar, Chem. Eng. Sci. 60 (8–9) (2005) 2179– 2192,http://dx.doi.org/10.1016/j.ces.2004.10.038.
[34] I. Solomentseva, S. Bárány, J. Gregory, The effect of mixing on stability and break-up of aggregates formed from aluminum sulfate hydrolysis products, Colloids Surf., A 298 (1–2) (2007) 34–41, http://dx.doi.org/10.1016/ j.colsurfa.2006.12.016.
[35] A. Keyvani, K. Strom, Influence of cycles of high and low turbulent shear on the growth rate and equilibrium size of mud flocs, Mar. Geol. 354 (2014) 1–14,
http://dx.doi.org/10.1016/j.margeo.2014.04.010.
[36] D. Saha, M.U. Babler, M. Holzner, M. Soos, B. Lüthi, A. Liberzon, W. Kinzelbach, Breakup of finite-size colloidal aggregates in turbulent flow investigated by three-dimensional (3D) particle tracking velocimetry, Langmuir 32 (1) (2016) 55–65,http://dx.doi.org/10.1021/acs.langmuir.5b03804.
[37] R. Verney, R. Lafite, J.C. Brun-Cottan, P. Le Hir, Behaviour of a floc population during a tidal cycle: laboratory experiments and numerical modelling, Cont. Shelf Res. 31 (10, Supplement) (2011) S64–S83,http://dx.doi.org/10.1016/j. csr.2010.02.005.
[38]K. Kataoka, Taylor vortices and instabilities in circular Couette flow, Encyclopedia of Fluid Mechanics, vol. 1, Gulf Publishing Company, 1986. [39] F. Wendt, Turbulente Strömungen zwischen zwei rotierenden konaxialen
Zylindern, Ingenieur-Archiv 4 (6) (1933) 577–595,http://dx.doi.org/10.1007/ BF02084936.
[40] E. Barbot, P. Dussouillez, J.Y. Bottero, P. Moulin, Coagulation of bentonite suspension by polyelectrolytes or ferric chloride: floc breakage and reformation, Chem. Eng. J. 156 (1) (2010) 83–91,http://dx.doi.org/10.1016/j. cej.2009.10.001.
[41] C. Coufort, C. Dumas, D. Bouyer, A. Liné, Analysis of floc size distributions in a mixing tank, Chem. Eng. Process. 47 (3) (2008) 287–294,http://dx.doi.org/ 10.1016/j.cep.2007.01.009.
[42] P.T. Spicer, W. Keller, S.E. Pratsinis, The effect of impeller type on floc size and structure during shear-induced flocculation, J. Colloid Interface Sci. 184 (1) (1996) 112–122,http://dx.doi.org/10.1006/jcis.1996.0601.
[43] Y. Kikuchi, H. Yamada, H. Kunimori, T. Tsukada, M. Hozawa, C. Yokoyama, M. Kubo, Aggregation behavior of latex particles in shear flow confined between two parallel plates, Langmuir 21 (8) (2005) 3273–3278,http://dx.doi.org/ 10.1021/la048011j.
[44] M. Soos, L. Wang, R.O. Fox, J. Sefcik, M. Morbidelli, Population balance modeling of aggregation and breakage in turbulent Taylor-Couette flow, J. Colloid Interface Sci. 307 (2) (2007) 433–446, http://dx.doi.org/10.1016/j. jcis.2006.12.016.
[45] T. Serra, X. Casamitjana, Structure of the aggregates during the process of aggregation and breakup under a shear flow, J. Colloid Interface Sci. 206 (2) (1998) 505–511,http://dx.doi.org/10.1006/jcis.1998.5714.
[46] H. Wright, R. Muralidhar, D. Ramkrishna, Aggregation frequencies of fractal aggregates, Phys. Rev. A 46 (8) (1992) 5072–5083,http://dx.doi.org/10.1103/ PhysRevA.46.5072.
[47] D.H. Bache, E. Rasool, D. Moffat, F.J. McGilligan, On the strength and character of alumino-humic flocs, Water Sci. Technol. 40 (9) (1999) 81–88,http://dx.doi. org/10.1016/S0273-1223(99)00643-5.
[48] C.A. Biggs, P.A. Lant, Activated sludge flocculation: on-line determination of floc size and the effect of shear, Water Res. 34 (9) (2000) 2542–2550,http://dx. doi.org/10.1016/S00431354(99)00431-5.
[49] R.J. François, Strength of aluminium hydroxide flocs, Water Res. 21 (9) (1987) 1023–1030,http://dx.doi.org/10.1016/0043-1354(87)90023-6.
[50] Y. Wang, B. Y Gao, X.M. Xu, W.Y. Xu, G.Y. Xu, Characterization of floc size strength and structure in various aluminum coagulants treatment, J. Colloid Interface Sci. 332 (2) (2009) 354–359, http://dx.doi.org/10.1016/j. jcis.2009.01.002.
[51] K. Higashitani, K. Yamauchi, Y. Matsuno, G. Hosokawa, Turbulent coagulation of particles dispersed in a viscous fluid, J. Chem. Eng. Jpn. 16 (4) (1983) 299– 304,http://dx.doi.org/10.1252/jcej.16.299.
[52] B.K. Brunk, D.L. Koch, L.W. Lion, Observations of coagulation in isotropic turbulence, J. Fluid Mech. 371 (1998) 81–107, http://dx.doi.org/10.1017/ S0022112098002183.
[53] S. Melis, M. Verduyn, G. Storti, M. Morbidelli, J. Bałdyga, Effect of fluid motion on the aggregation of small particles subject to interaction forces, AIChE J. 45 (7) (1999) 1383–1393,http://dx.doi.org/10.1002/aic.690450703.
[54] G.R. Zeichner, W.R. Schowalter, Use of trajectory analysis to study stability of colloidal dispersions in flow fields, AIChE J. 23 (3) (1977) 243–254,http://dx. doi.org/10.1002/aic.690230303.
[55] D.L. Feke, W.R. Schowalter, The effect of Brownian diffusion on shear-induced coagulation of colloidal dispersions, J. Fluid Mech. 133 (1983) 17–35,http://dx. doi.org/10.1017/S0022112083001767.
[56] T.G.M. van de Ven, R.J. Hunter, The energy dissipation in sheared coagulated sols, Rheol. Acta 16 (5) (1977) 534–543, http://dx.doi.org/10.1007/ BF01525653.
[57] Y. Adachi, M.A. Cohen Stuart, R. Fokkink, Kinetics of turbulent coagulation studied by means of end-over-end rotation, J. Colloid Interface Sci. 165 (2) (1994) 310–317,http://dx.doi.org/10.1006/jcis.1994.1234.
[58] D. Marchisio, M. Soos, J. Sefcik, M. Morbidelli, Role of turbulent shear rate distribution in aggregation and breakage processes, AIChE J. 52 (1) (2006) 158–173,http://dx.doi.org/10.1002/aic.10614.