AUG
30 1940
THE CRITICAL CONSTANTS AND COMPRESSIBILITY OF
GASEOUS ISOBUTENE
AND THE COMPRESSIBILITY
OF A GASEOUS
MIXTURE OF METHANE AND N-BUTANE
by
HENRY GILBRT INGERSOLL B.S. Washington College 1935 M.S. University of Maryland 1937
Submitted in Partial Fulfillment of the
Requirements for the Degree of Doctor of Philosophy
from the
MASSACHUSETTS INSTITUTE OF TECHNOLOGY
194o
Signature of author .. .. ... ...-Department of Chemistry, May 1940
Signature of Professor
in Charge of Research... Signature of Chairman of De mental
Committee on Graduate Stui
/
ts ...ACEOWIEDGMENT
The author is deeply grateful to Professor
James A. Beattie for his advice and assistance during the course of this research and for the many valuable lessons in mental and experimental technique which he has taught.
The author is much indebted to his collaborator, Mr. W. H. Stockmayer, for indispensable assistance rendered and
for a refreshing and inspiring example at all times.
The author expresses his sincere appreciation also to
The Massachusetts Institute of Technology, for several Fellowships, Scholarships and Loans.
The Polymerization Process Corporation, for a Research Fellowship.
Doctor Manson Benedict, for helpful advice and pure hydrocarbons. Doctor Leo I. Dana, for pure hydrocarbons.
Messrs. Gallagher, Wilhelmson and Carter for willing and essential services in constructing and repairing the apparatus.
23c:5
TO MY FAT71110
"A Coeur vaillant rien rimpoesible".
TABLE OF CONTENTS
Page
I Introduction 1
II Vapor Pressure of Isobutene. 4
1. Vapor Pressures. 4
2. Discussion . 4
III Critical Constants of Isobutene. 11
1. The Critical Point. 12
2. Comparison of the Critical Constants with
Recorded Values. 13
IV The Compressibility and the Equation of State of Isobutene. 15 1. The Compressibility Measurements. 16
2. The Equation of State. 16
V The Compressibility of a Mixture of Methane and n-Butane. 19
1. Discussion. 20
VI Summary. 23
Appendix
I The Method of Measurement and Calibration of the Apparatus. 2 A
1. Measurement of Pressure. 2 A
Description and Calibration of the Gauge. Calculation of Pressures.
2. Measurement of Mass. 3 A
---
C-ii~~-TABLE OF OONTENTS (continued)
3.
Measurement and Control of Volume.
4 A
Description and. Calibration of Compressor.
The Riser Block.
The Bombs.
Calculation of Volumes.
Blank Runs.
4.
Measurement and Control of Temperature.
9
A
Thermostats.
Calibration of
the
Thermometer.
II The Loading.
1.
Preparation and Purification of the Isobutene.
12
A
2. Loading.
13 A
--LIST OF TABLES
Table 1 - Vapor Pressures of Isobutene. Table 2 - Orthobaric Densities of Isobutene.
Table 3 - Comparison of the Vapor Pressure of Isobutene to Recorded Values.
Table 4 - Heats of Vaporization of Isobutene.
Table 5 - Isotherms of Isobutene in the Critical Region. Table 6 - Critical Constants of Isobutene.
Table 7 - Decomposition Times for Isobutene.
Table 8 - Decomposition of Isobutene During Compressibility Measurements.
Table 9 - Vaor Pressure of Isobutene After the 2750 Isotherm. Table 10 - Comparison of Observed and Calculated Pressures for
Isobutene.
Table II - High Density Compressibility of Isobutene.
Table 12 - Equation of State Constants for the Hydrocarbon Gases.
Table 13 - Compressibility of a Methane - n-Butane Mixture. Table 14 - Equation of State Constants Used in the Calculations. Table 15 - Deviations from Method I.
Table 16 - Deviations from Method II. Table 17 - Deviations from Method III. Table 1 - Deviations from Method IV.
LIST OF TABLES (continued)
Table 19
Table 20
-Table 21
-Comparison of Deviations for the Pure Gases and Deviations for the Mixture.
Sunmmary of Averaged Deviations for All Three Mixtures.
Grand Summary of Deviations Averaged Over All Three Mixtures.
LIST OF FIGURES
The Critical Region of Isobutene.
- The Compressibility Apparatus. Figure 1
I. INTODUCTION
Compressibility measurements require the determination of four quantities - the pressure, volume, temperature and mass of a substance. These variables completely define the state of an isotropic system, and their correlation by means of an equation of state is of fundamental importance. Thus, from the equation of state and beat capacities for a substance all of its thermodyrnaic variables may be calculated, Random examples of the numerous other applications are the calculation of the effect of pressure on gaseous equilibria (1), the calculation of Joule-Thomson coefficients (2), and the estimation of fluid friction terms (3).
Although the equation of state is usually obtained on a semi-empirical basis, it may be derived in a very general form from classical statistical mechanics. The relation so obtained, written in the "virial" form, is:
PV=
1+Bi
(
()
RT +--+ +
V V 2
where B, C, etc. are called the second and third "virial" coefficients
and are functions of temperature only. It may be shown that, for the case of spherical molecules, the second virial coefficient is given by the equation:
E( r)
B = 2 rnN r2
(1 - e dr
where E(r) is the potential energy of a pair of molecules for an inter-molecular distance r. This is an integral equation giving the
I--=I-
-C-intermolecular force law from the experimentally determined second virial coefficients. Conversely, some particular force law may be assumed, such as the van der Waals or Lennard-Jones potentials, and the second virials calculated for comparison with experimental values.
Industrially, pressure-volume-temperature relations are becoming increasingly valuable, because of the present trend to high pressure processes. In designing reactors and other expensive equipment for such industries, the use of the ideal gas laws may cause 400 percent error in the calculated volumes. Usually the best possible approximations are based on reduced AL-charts which have been generalized from the avail-able data on hydrocarbons (5)- Such methods are very useful, but they may be in error by 2 to 10 percent for pure gases.
Some of the more familiar equations of state that have been proposed are those of van der Waals (6), Dieterici (7), Keyes (g), and
Beattie-Bridgeman (9). The Beattie-Bridgeman equation is probably the best compromise between mathematical simplicity and accurate representation
of the data. It is usually written
P r I-E) [V + BJ A V V2 A = Ao (1 - a) v B = Bo (1 - -) V VT3 MEN--- ANNIM I
The constants for a substance are unique and are easily obtained from the experimental data. The form of the equation is well adapted.to the
analytical determination of the thermodynamic variables. The range of the equation may be extended by adding terms, but still maintaining the same general form. Various simple rules for calculating the constants for gas mixtures from those for pure gases have been quite successful. This treatment is much superior to other proposed methods for mixtures, such as Dalton's law, Gibbs-Dalton law, Amagat's law and Gilliland's rule (10). The use of the Beattie-Bridgeman equation of state for mixtures of methane and n-butane is the most drastic test yet made of these combining rules.
The data for these mixtures will also be of great value in the general
theory of gaseous solutions.
At present, compressibility data are available for eight of the lower hydrocarbons. Beattie-Bridgeman equation of state constants have been obtained for six (Table 12) . The compressibility of gaseous
isobutene will be a valuable addition to this group. The critical con-stants will be of value in reduced equation d state work and also of much interest in testing the rules for the critical region, particularly those which may be proven by approximate theory. Isobutene receives much
industrial attention since it is easily polymerized and hydrogenated to isooctane, a gasoline of 100 anti-knock rating. Particularly promising are fermentation sources of isobutene, with acetone and diacetone alcohol the intermediates.
II. VAPOR PRESSURE OF ISOBUTENE.
The isobutene for this research was obtained from
Doctor Manson Benedict of the M. W. Kellogg Company, and contained less then 0.5 mole percent of impurity in the liquid phase. The preparation, purification and analyses are described in Appendix II. The sample
received by us was further purified and loaded into the bomb (Appendix II).
1. Vapor Pressures.
Vapor pressure measurements should be a further check on the purity of the isobutene. Consequently, vapor pressures were measured at 30 , 50 0 75 0, 100 1250 Centigrade, and with variations in the vapor
volumes up to 289-fold. The results are tabulated in Table 1.
Liquid density measurements were obtained by collapsing the vapor entirely into the liquid phase, and noting the volume at which there was a sharp rise in the pressure. (Table 2)
2. Discussion.
In calculating the vapor volumes in Table 1, estimates of the saturated vapor densities were necessary. Generalized reduced
fugacity versus T charts are available, but would not be convenient pressure Tcritical
for conversion to volumes. Accordingly an equation of state with the second virial coefficient was used.
RT
P -+B(T)
For B(T) , the "reduced Beattie-Bridgeman equation" for aliphatic hydro-carbons has been proposed by W. C. Kay (11). It is easy to use and has
Temperature 30C Gas Volume Pressure
90.44
3.h46
81.00
3.443
66,84
3.444)4
TABLI 1VAPOR PRESSURES OF ISOBUTENE (Pressures in Normal Atmospheres)
500M
750
o1000
Gas Gas Gas
Volume Pressure Volume Pressure Volume Pressure
66.58
5.974
97.62
10.853
100.82
18.075
51.84
5,974
67.30
o10.54
6.*9
18.073
37.09
5.974
44.47
10.857
45.06
18.077
22.35
5.975
21.72
10.859
21.17
18.085
7.61
5.979
6.55
o,10.65
5.24
18.092
3.92
5.979
3.o0
o10.869
2.85
18.091
0.23
5.979
0.38
10.868
0.46
18.093
12500
Gas Volume Pressure48.79
28.397
21.38
28.410
7.67
28.415
3.11
28,419
0.36
28.419
Largest volume 1.36 289. Smallest volume Highest P - Lowest P 0.003 Final value 3.444for pressure + 0.006 atm.
257.
0.005
5.976
+ 0.008 atm. 219.0.016
10.861
+ 0.019 atm.136.
0.02018.084
±
0,023 atm. 0.022 28.412 + 0.025 atm. ..._ .. ... 1._..,- .. 1.-- I lliTABLE 2
ORTHOBARIC DENSITIES OF ISOBUTENE
(Grams/c.c.)
fV
'fL
v)
i
V)
Liquid Density (Observed)0.5579 + 0.0006
0.5202 + 0.0006 0.4756 + 0.0006 Gas Density (Calc. by (Calc. by Beattie-Kay Bridgeman Equation) Equation)0.0142
0.0142
0.0255 0.02550.0427
0.0455
(Observed) (Calc. by Rect. Diam.)0.2861
0.2861
0.2729
0.2731
0.2606
0.2600
(Calc.by (Observee) Katayama Equation)+o.ooo6
+0.006C
0.0689
0.0832
0.2469
0.2469
0
0.5437
0.5455
-0.oo001
o.4947
o.4940o
+0o.0007
0.4301
o.4276
+0,oo0025
0.3274
0.3277
-0.0003
Temp.(
0c)
PL
fV
100 125 0.4106 + 0.ooo0006been well tested. According to this B Bo Ao RT T3 where Bo = 4.795 x 10- 3 M -4 Ao = 8.092 x 10 MT0
c
44.430 x l0" MT 3 M = molecular weight = 56.06 TC = critical temperature (oK) = 416.The gas densities in Table 2, column 2, were calculated by this method. The densities in column 3 were recalculated by using the Beattie-Bridgeman equation and the constants for isobutene which were determined from the compressibility data (this Thesis, page 17 ). The Beattie-Bridgeman
equation explicit in the volume (V a F(P,T) ) would not have enough virial coefficients for accuracy in the pressure range desired. Hence, using the equation in its usual form, pressures corresponding to the densities of column 2 were first calculated. Depending upon the agreement of observed and calculated pressures, another gas density was assumed and the corres-ponding pressure calculated. Finally, by considering a constant
dP
over a small pressure range, the correct gas densities were interpolated. These densities were used in obtaining the liquid and gas density differ-onces and averages labelled "observed" in Table 2. The errors in the observed liquid densities were estimated by assuming 0.1% error in the volume determination. Actually, the error is probably much less than this,
except at 1250, where the break in the pressure-volume isotherm with lique-faction was rather vague because of the proximity to critical conditions.
(.
The maximum effect of decreasing vapor volume upon the vapor pressure was 0.02 atm. The pressures all fall on a good straight
1
line when plotted as log P versus - . It was concluded that, although T
some impurity was present, possibly other butenes or isoactene, the amount was negligible for our purposes.
There are not enough data to warrant a three constant vapor pressure equation. The data were least squared to obtain the relation
logoP
4.37476
-1163.
T
The standard deviation of observed pressures and pressures calculated from this equation is 0.018 atm. It should be noted that the overall accuracy of the final values for the vapor pressures, Table 1, includes 0.003 atm. experimental error.
A surary of the present vapor pressure results and the values reported in the literature is given in Table 3. The data cited
1
were plotted as log P versus - and the interpolations or extrapolations compared with our values. The double parentheses indicate extrapolations and s ngle parentheses interpolations.
Coffin and Maass (12) measured the vapor pressure of
iso-o 0
butene from -79. C to +22. C.
Scheeline and Gilliland (13) extended the measurements, covering the range 370C to 148.8 C. The purity of their isobutene is questionable.
Lamb and Roper (14) have reported the vaporpessure at six
O O
temperatures, from -57 C to 0 C. Their results were fitted to a three constant equation, which was used for the extrapolation shown in Table 3.
TABLE 3
COMPARISON OF THE VAPOR PRESSURE OF ISOBUTENE TO RECORDED VALUES
(Normal atmospheres) Observer Scheeline Coffin Lmgnb
Temp, and Gilliland and Maass and Roper
VS
(( 3.8))
( 6.3)
(11.0)(17.s)
(26.9)
39.7
((3.40)) ((3.30))
Kellogg This Research
((3.4))
(5.9)
(10.8)
(18.2) (28.8)39.5
3.444
5. 976
o10.61
28.412
39.485
+ooo6
+0.008
+0.019+0.0oo23
+o.025
+o.ol4
( ) = interpolated values; (( )) = extrapolated values.
TABLE
4
HFATS OF VAPORIZATION OF ISOBUTENE
K
v(Gram cals./mole)
Lamb and Roper
((5320.)) (approx.)
5370.
((5130.))
4649.
4210.
3499.
2479.
3050
75
100125
to Temp. 0 0 -7.12 -7.12 5075
100
125
---- ~~-
I
-7-The Kellogg (15) measurements extend from 55 0C to 135.80C. These data are best suited for comparison with the vapor pressures deter-mined by this research, since the temperature range is nearly the same. The agreement in all cases is good and an added assurance of the purity of the isobutene.
It is interesting that the vapor pressure equation fitted to the data (page
6
) extrapolates to a critical pressure which agrees within 1.% with the critical pressure determined independently from the pressure volume isotherms. (This Thesis, page 13)P/
= 39.485 atm.
(experimental)
PC = 39.01 atm. (extrapolated)
This would seem to indicate that the slope of the vapor pressure curve remains constant through the critical region, in the case of isobutene. That is, rearranging the Clapeyron
equation,-d In P S- T MHV
constant
d(l) P Ov
0 HV = molal heat of vaporization
av = difference between molal liquid
and vapor volumes
Calorimetric measurements at high pressures are very difficult, so that the Clapeyron equation applied to the vapor pressure and liquid and vapor density data offers a useful method for obtaining heats of vaporization. The results of these calculations are shown in Table 4. Lamb and Roper's (16) value for the heat of vaporization at
the boiling point was obtained by assuming perfect gases and neglecting the liquid volume. A comparative value was extrapolated from the present
-8-data by using the vapor pressure equation given to evaluate (dP) and the
dT
Katayama equation for A v (pagelO). The agreement is much improved when Lamb and Roper's assumptions are used (labelled approximate in Table 4).
A brief digression into general theory of the critical region will yield some interesting relations which are applicable to the data obtained. It is necessary to assume:
(1) That the pressure volume isotherms remain analytical in the critical region.
P = F (V,T)
(2) That the critical point is that point on a particular isotherm which has both zero slope and an inflection.
2
dPT
-d-=o .
d PV
0o
T
(3) That the vapor pressure in the critical region is a
linear function of the temperature.
P = P- (TC- T) c= (T)
(4) That the change in free energy with vaporization is zero (Gibbs rule).
dF L V dP 0
The relations which may be thus proven are (17)
2 =
c
+ A (Tc - T) (1)L /OV = ya 144 1 (2)
S
1/2
12
/0L
-0
)
(Toc"
T)
(3)
where / L = liquid density, grams per cc.
= vapor density " "
c
= critical density " " tm = molecular weight
VC = critical volume, liters per mole
I P p
6T8V
/
8V /
C
C
Equation (1) is the well known law of rectilinear diameters,
which agrees with experiment not only in the critical region but also over a wide range of temperatures below the critical. The averages of the liquid
and gas densities in Table 2 fall on the straight line
/L V = 0.4550 - 0.0005226 T
2
with a standard deviation of 0.00035 grams/cc. The extrapolated critical density agrees very well with the critical density determined from the pressure volume isotherms (this Thesis, page 13).
d = 4.220 moles/liter (rect. diam.)
dC = 4.167 ± 0.032 (page 13)
It is to be emphasized that the two methods are independent.
Equation (2) has been obtained empirically from two surface tension equations which were discovered by Macleod and Katayama, and is frequently referred to as the Katayama equation. Deviations from the relation
-10-0.3243
are given in the last column of Table 2.
Equation
(3)
is quite useful for engineering purposes
because the parameters are constant enough so that one curve will
represent within one percent the quantities
-
mL
versus
T - T
-11-III. THE CRITICAL OONSTANTS OF ISOBTTTENE
The critical point of a pure substance is defined, with reference to the pressure volume isotherms, as the point at which an isotherm has both a horizontal tengent and an inflection, i.e.
dP)= 0 ( d2P =0
The critical temperature of isobutene was estimated as well as possible from previous workers' results and from the known -T ratio, which is about 0.64 for any substance. A desirable range of compressor settings was estimated from the critical density obtained by rectilinear diameters. Isotherms were then run at the estimated critical temperature and in the critical region thus indicated. As the work
pro-gressed, pressures were plotted against compressor turns. This indicated
to some extent what isotherm was to be studied next. It was desired to
o
have isotherms 0.01 above and below the critical isotherm, one or two
in the all fluid region and several in the vapor-liquid region, covering
in all about 0.300. Measurements were continued far enough at each end of the isotherms to definitely establish the vapor and liquid regions.
The intersections of smooth vapor and liquid compressibility curves with the horizontal vapor pressure lines fixed the width of the vapor-liquid regions. The conventional "steam dome" was then drawn through all the intersections, although some artistic adjustment was required to make the whole two phase region smooth.
-12-1. The Critical Point
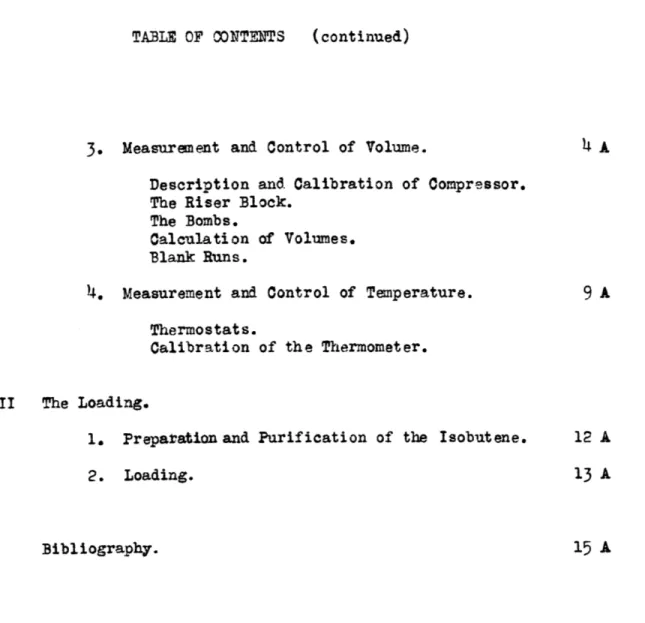
The critical isotherms are tabulated in Table
5.
Figure 1 illustrates the graphical determination of the critical point. All points are drawn as circles of 0.002 atmospheres radius, since the pressures are relatively accurate to that amount. The critical volume obtained by this method is less accurate than either the critical tem-perature or the pressure. The use of rectilinear diameters over the short temperature range studied was very helpful in checking the correct-ness of the steam dome and the critical volume chosen. Plots of the change in pressure with compressor setting (-P-) against the compressor
av
settings (v) were used for the three isotherms nearest the critical as a further check. Unfortunately, the pressure differences are so small that
AP
the -- - values scatter badly. However, the plots did indicate that the critical isotherm was chosen correctly. The critical constants so
obtained are: o o
T
=144*73
+
0.02
0
PC = 39.485 + 0.014 normal atm. v = 0.240 + 0.002 liters/mole d = 4.166 + 0.032 moles/liter RTC =
0.619
TOTABLE 5. ISOTHERMS OF ISOBUTENE IN THE CRITICAL REGION
144.45 144.50 144.60 144.65 144.70 144.71 144.73 144.75 144.80
Volume Density
i/m m/1 Pressure (normal atmospheres)
39.2945
39.2985
39.3000
39.3050
39.3175
39.3270
39.3300
39.3335
39.3585
39.3755
39.3870
39.394o
39.3960
39.3020
39.3330
39.4005
39.40oo00
39.3995
39.3040
39.3320
39.3995
39.3995
39.3035
39.3870
39.4055
39.4170
39.4260
39.4290
39.4315
39.4320
39.4235
39.4390
39.4475
39.4565
39.4530
39.4615
39.4635
39.4610
39.4680o
39.4695
39.4650
39.4725
39.4800oo
39.4815
39.4830
39.4760
39.4850
39.4900
39.4925
39.4950
39.5055
39.5125
39.5185
39.5225
39.4335
39.4625
39.4720
39.4845
39.4945
39.5270
39.3985
39.4335
39.46o4
39.4640
39.3975
39.4340
39.4650
39.4660
39.3990
39.434o
39.4650
39.4725
39.4845
39.4970
39.4725
39.4855
39.4975
39.5300
39.4740
39.4g60
39.4985
0.28914
0.281860.27457
0.26728
0.25998
0.25270
0.249o06
0.24724
0.24541
0.24359
0.24177
0.23995
0.23813
0. 234 48
0.2308os4
0.22902
0.22355
0.21627
0.20~99
0.20170
3.4585
3.5479
3.6421
3.7414
3.8464
3.9573
4.0151
4.o0450
4.0748
4.o1055
4.1362
4.1678
4.1994
4.2321
4.2648
4.3320
4.
673
4.4733
4.623
4.7849
4.9579
39.3375
39.3395
39.3450
39.3620
39.4045
39.4055
39.4115
39.4370
39.4370
39.4395
39.4485
39.4735
39.4675
39.4705
39.4825
39.4770
39.4800
39.4915
39.4905
39.4955
39.5030
39.5020
39.5085
39.5200
39.5 65
39.5 30
39.5565
Temp. 0"C39.3025
39.3355
39.3995
39.4350
39.4670
39.4745
39.4870
39.4995
39.5320
39.3045
39.3050
39.3110
--- --- -k-..---L---.--z~T--~C- I~--T-p -- ~ -C-~3----pl I ---- ~7-~ --~-L "-L C----* - 1. ~ ~--- I~--- --.-- - ~-~-3 9.6 O0 3 9.5 5 3 9.5 O0 39.45 39.40 39.35 39.30 -0.2 O0 0.2 2 0.2 4 0.26
VOLUME
CRITICAL
REGION OF
ISOBUTENE
Figure 1. 0.2 8 0.30 IiJ 1 4J Lu
co
D CI) LI) l)w
c,a-[LI TERSIMOL]
-- ---
I
U
2. Comparison of Constants with Recorded Values.
TABLE 6.
CRITICAL CONSTANTS OF ISOBUTENE
This Research Extrapolated
Toc)
(73
0.02
144- 73±
0.02 (normal atm.)39.495 +
0.014
39.01
(md )4.167
±
0.032
4.22o Kellogg Scheeline and GillilandCoffin and Maass
144,4 + 0.6
144.9 + 1.2
1'43.5 + 0.2
39.5
±
0.2
39.7
+ o0.1
Table 6 presents a summary of the present results and of other recorded values for the critical constants of isobutene. The agreement is satisfactory since the other constants cited were all obtained by noting the disappearance of the meniscus. As previously indicated, the isobutene used by Scheeline and Gilliland may well have been impure. Coffin and Maassivalue for the critical temperature is
slightly lower than the others. This fact is of interest in connection with the liquid and vapor density differences found by Maass above the critical temperature as located by the disappearance of the meniscus. (18) It seems very probable that these density differences are some sort of hysteresis phenomena and that the classical theory is not contradicted
-1
3-~
when final equilibrium states are dealt with. Or, it is equally possible that small amounts of impurity are the cause. At any rate, the question
is still very much an open one. It is interesting to compare the critical temperatures which are obtained by the "disappearing meniscus" and the pressure-volume isotherm methods. Unfortunately, there are no data avail-able, so that only the following insignificant comparison is
possible:-t t c c (Disappearing (P-V-T) meniscus) Propane 95.60 C 96.81o C Isobutene 14-3.50 144.730
IV. THE COMPRESSIBILITY AND THE EQUATION OF STATE OF ISOBUITENE
It was desired to measure the compressibility of isobutene from above the critical temperature to 300 0 and to pressures of 350 normal atmospheres. Irobutene is notorious for polymerization, so that it was imperative to have exact knowledge of the pressure and temperature below which decomposition is negligible. Krauze, Nemtsov and Soskina have published some data on the rate of polymerization of isobutene at high temperatures (19). Their work was done in a glass-lined bomb and above 330 0. The results show that the mole fraction, x, of isobutene polymerized after t minutes at an initial concentration of c moles per liter is given by x = Etc. The reaction constant K is calculated
from the absolute temperature t as follows:
logI o K = 12.27 - 9560
T
0
These data were extrapolated to temperatures below 300 0 and times
calculated for 0.01 mole percent decomposition at different gas densities (Table 7). It was concluded that the decomposition would be negligible
0
to 225 C, at least. The procedure adopted was to check the pressure at the lowest density (1 mole/liter) after completing each isotherm. These checks, indicating the extent of decormposition, are summarized in Table 8. The isobutene was even more stable than expected, and 2500 and
o
02750 isotherms were measured. After the 275 isotherm, a check run on
the 1500 isotherm showed 0.39 percent decrease in the pressure (Table S),
indicating appreciable decomposition. This was substantiated by a similar decrease noted in the vapor pressure at 100 (see Table 9).
::
TIMES FOR 0.01 MOL PERCENT DECOMPOSITION OF ISOBUTENE
C (Moles/liter)
5.
1. 10. 1. 10. 1. 10. t (Hours) *33000.
166o.
166.
166.
16.6
16.61.66
Calculated from data of Krauze, Nemtsov
and Soskina, (19).
Temp. ( o)
150
175
200225
TABLE
7
TABLE 8
DECOMPOSITION OF ISOBUTENE DURING COMPRESSIBILITY MEASUREMENTS
175
200225
250
275
1 mole/liter density
150
(after 2750)
Pressures (Normal Atmospheres)
25.67
28.41
25.66
28.41
31.09
33.71
36.30
38.s4
25.67
31.08
33.71
36.28
38.76
25.57
0.01 0.00 0.01 0.00 0.02 0.08 0.100.04
0.03
0.06 0.21 0.39TABLE 9
VAPOR PRESSURE OF ISOBUTENE AFTER THE 2750 ISOTHERM
0 Temp. C 100 G as
Volume
100.82 cc. Pressure Before 1500 After 2750 18.075 atm. 17.8700.~6 cc.
18.093
18.034
Temp. 0 150 Before Isotherm After Isotherm D P LP 1.140.205
bet ,0.059
0*33
-16-1. The Compressibility Measurements.
The compressibility of isobutene was measured at
150, 175, 200, 225, 250 and 2750C and at several integral gas densities. High density measurements were limited to pressures of 350 atmospheres; at the higher terperatures pressures were restricted to 250 atmospheres in order to minimize decomposition. One-half to three-quarters of an hour was allowed for equilibrium at each point. At the temperatures
225, 250. and 27500 the measurements were made at twenty minute intervals, because of the instability of isobutene.
Pressures were measured with an overall accuracy of from 0.01 to 0.03 percent. The stated temperatures are maintained to + 0.0020C and known to 0.020 on the international platinum resistance thermometer scale. The gas volumes corresponding to the integral densities varied from about 100 cc. to 10 cc. with maximum uncertainties of approximately + 0.01 cc. For calculating the corrections DI, D3, A v (Appendix II) pressures were estimated from chemical engineering /-charts (20), with
accuracy varying from 3 to 5 percent. Measured pressures were then used
to recalculate the corrections; usually the change was only noticeable
in a v, and but one recalculation necessary for convergence. 2. The Equation of State.
The compressibility data up to the critical density has been correlated by means of the Beattie-Bridgeman equation of state, which is conveniently written (21) :
P = RT VT3 V +Bo (1 - - Aa(1
-17-The unique constants c, Bo, b, Ao, a were determined as described by Beattie (22) and Simard (23). The values obtained were
a a 250 x 10l Bo = 0.24200 b a 0.08750
Ao
a
16.9600
a
a
O.10860
mol.
wt.
=
56.0616
Units: normal atmospheres, liters per mole, oK (273.13 + OC)
These are tabulated in Table 12 with the Beattie-Bridgeman constants that have been determined for other hydrocarbone, and are slightly lower than those for n-butane as one would expect. The Beattie-Bridgeman
equation reproduces the observed pressures with a total average deviation of 0.218 atmospheres and a total percentage deviation of 0.381 percent (Table 10). If the 4 moles/liter isometric is omitted, the total average
deviation is reduced to 0.29 percent. The curvature of this isometric is
positive, so that a negative c constant would be required to straighten the "corrected" isometrics, Pt vs T , where
Density (Moles/liter) Temp.
(
0c)
150 Observed Obs.-calc. % dev. 175 Observed Obs.-calc. % dev. 200 Observed Obs.-calc. % dev. 225 Observed Obs.-calc.%
dev. 250 Observed Obs.-calc. % dev. 275 Observed Obs .-calc.% dev.
1.0 1.5 2.0 2.53.0
3.5
Pressures (Normal atraospheres)
25.67
-0.20-0.77
28.41
-0.12 -0,42 31.09-0.07
-0.23
33.71
-0.07
-0.2136.30
-O.0 -0.08 -0.22 -0.12-0.31
Average dev. (atm.) 0.11
32.92
-0.25
-0.76
37*49
-0. 10-0.26
41.88
-0.07
-0.
17
46.24
-0.02-0.o4
50.
-0.06
-0.1254.64
-0.o14
-0.26
37.51
-0.15
-0.
io
44. 1.
4
+0.05
+0. .150.52
+0.
10
+0.2056.76
+0.10
+0.18
62.86
+0.02+0.03
68.86 -0.11-0.16
40.19
+0.12 +0.3049.02
+0.26
+0.53
57.53
+0.25+0.43
65, g
+0.22 +0.3374.06
+0.13
+0.18
41.62+0. 42
+1.0152.714
+0.38
+0.72
63.52+0.25
+0.3974.14
+0.19
+0.26
e4.61
+0016+0.17
94 98
+0.14
+o.lr-41, g4
-0.02-0.05
55.78
+0.10 +0.1868.99
-0.]3
-0.19
82.11-0.16
-0.2095.14
-0.03
-0.03
42.80-0.13
-o. 30
58.58
-1.64
74.43
-1.22-1.64
90
*39-0.96
-1.07
106.26
-0.h14
122.03+0.19
+0.
].6
0.11
0.09
0.20
0.2F
0.09
0.66
Average % dev. 0.36 0.25 0.18 0.35
o.
15
0.13
0o.8
Total average deviation (atm.) 0.218; total
%
deviation, 0.381 TABLE 10COMPARISON OF PRESSURES CALCULATED FROM THE EQUATION OF STATE WITH THE OBSERVED PRESSURES FOR ISOBUTENE
-19-Including this isometric seriously impaired the possible accuracy, but
was considered to be the best compromise between accuracy and range of
representation.
The high density measurements are reported in Table 11. Their treatment would require an equation of state containing more terms. The generalized reduced Al-charts for hydrocarbons is the best approximate
method.
The importence of second virial coefficients has been
men-tioned and it is worth while to see how accurately they rmay be obtained from the Beattie-Bridgeman equation of state. This gives
Ao
c
B = Bo
RT T3
The best experimental method consists in extrapolating plots of V - 1 1
versus V to zero density. The Beattie-Bridgeman B's are uniformly too high.
Temp. (oC) B (LM) Calc. Exp.
150
-0.2791
-0.2920
175
-0.2466
-0.2576
200 -0.2181 -0.2260225
-0.1928
-0.19'
250
-0.1703
-0.1760
275
-0.1500
-o.1568
==---i--TABLE 11
HIGH DENSITY COMPRESSIBILITY OF ISOBUTENE Pressures (Normal Atmospheres)
Density (m/1) 4.5 5 6 7 8 9 Temp.(OM)
150
43.19
43.78
47.86
65.66
122.27
254.09
175 61*58 65.33 78.60 111.26 189.42200
o.s48
87.78 110.55 157.54
225
99.57
110.58 143.20 204.70
250
118.76
133.63 176.16
275
156.56 209.07
TABLE 12
EQUATION OF STATE CONSTANTS FOR THE HYDROOARBON GASES
Units: o o 0
Normal atmospheres, liters per mole, K (T K = t C + 273.13)
Gas
OH
4C
2H
60
3HS
n-04H1o0n-0
7H
1 6 R0.08206
o0.08206
0.08206
0.08206
0.08206
Ao
2.2769
5.8800
11.9200
17.794
5)4.520
a
0.01855
0.05861
0.07321
0.12161
0.20066
B o0.05587
0.09400
0.18100
0.24620
0.70816
b.-
0.01587
0.01915
o0.0o4293
0.09423
0.19179
C12.83
90.00
120.350.
4oo.
02H4 0.08206 6.152 ,0 = OHa Ca0.08206 16.9600
o.o04964
0.12156
o.10860
0.24200
0.03597
22.68 x
10
428.031
0.08750 250.
x 10
456.0616
Mol. Wt.16.0308
30.o462
440.o616
58.0770
o100o.1248
104
104 104 10 4 4 10V. THE COMPRESSIBILITY OF A MIXTURE OF MET~ANE AND n-BUjTANE.
The compressibility of a gaseous mixture containing approximately 75 mole percent of methane was studied, supplementing the work of Mr. W. H..Stockmayer in this laboratory (24). Isotherms were
o 0 o
measured from 25 to 300 0 at 25 intervals and from 10 to 350 atmospheres pressure. /f -charts were used for an estimate of the pressure for the lowest isotherms, after which the assumption of linear isometrics was more accurate and convenient. In using the /-charts, "pseudo-critical" con-stants were calculated by the method of W. B. Kay (25). This method assumes that the "pseudo-critical" constants which may be used to predict
of the products
the P-V-T properties of the mixture are equal to the sums/of the mole fractions and the respective critical constants of the pure components. These "pseudo-critical" constants have no physical significance; the appearance of liquid at 500 was predicted by assuming instead that the actual critical temperature is a linear function of the weight fractions of the pure components.
The complete results are presented in Table 13. A check isotherm at 1500 after the 300 isotherm gave no indication that decom-position had occurred.
TABL 13
:F A M[IXTrE CONTAININTG ' .95 O,0 PERCENT
OF -MTHAIr AND 5.105 M1OLE PMCENT OF n-BUTANh
3 3.5 4 6.5 Density (m/1i) Temp. (0c) 25 50 75 100 125 150 175 200 225 250 275 300 150 (after 300) 1.25 24.02 28.51 31.90 34.86 37.77 40.67 43.56 46.'43 49.30 52.14 54.99 r7.82 40.67 2 2.5
6
102.05
118.23
138.49
1
58.78
178.92
198.84 218.82 238.73 258.64 278.48 298.10 7 (Liquid) 136.53 161.79 187.12 212.48 237.51 262.71 287.89 312.98 338.06 8 157.25 188.22 219.55 250.86 281.90 313.08 344.28 9 181.85 219.73 258.08296.39
334.47 1.5 28.07 33.02 37.50 41.15 44.73 s8.30o 51.8355.35
58.87 62.36 65.86 69.3473.87
s4 .58 96.47 108,.22 119.85 131.34 142.81 154l.23 165.58 176.91 188.21 81.27 92.97 106.78 120.48 134.o4 147.43 160.85 174.18 187.43 200.68 213.87 5 88.43 101.34 117.12 132.89 148.50 163.93 179.38 194.78 210.08 225.37 2~o.57 148.4435.93
41.75 48.07 53.16 58.18 63.15 68.06 72.96 77.85 82.71 87.56 90.39 43.47 50.19 57.91 64.57 71.12 77.59 84.02 90.38 96.74 103.06 109.37 115.64 77.58 50.71 58.35 67.18 75.50 83.68 91.78 99.78 107.75 115.68 123.;6 131.42 139.27 (liquid) 66.24 76.03 6.o09 96.02 105.82 115.53 125.17 134.79 144.35 153.90 163.39 10 212.60 258.73 305.37 351.90 hL~- C~_E~L-=_~BClt~E~e~~ I I I I I -~-~s~ -- -p ~B~---~-~-~-~ I ~ _~____ I ~._
-20-Discussion.
Methane and n-butane are sufficiently different that the data will be an excellent test for the Beattie-Bridgeman equation of state for mixtures. The fundamental assumption is that the equation of state for mixtures has the same analytical form as in the case of a pure substance. Simple rules have been used for calculating the constants for the mixture from the constants for the pure gases (26)
Aom = ( iXi . )2 am i Xi ai
Bom a i Xi Boi (linear) or
Bom = X1 Bl + -1 XX 2 (Bo1 + Bo /3 ) + Bo+ (Lorentz)
14 0 2 X2B02 bm a i Xi bi m , r fi Xi Ci (linear) or Cm = ( fi Xi i ) (square root)
Physically, linearity of the square root of Ao corresponds to the assumption that the law of force between two unlike molecules is the geometric mean of the forces for the two like pairs. Linear Bo means
that the collision volumes should be additive, while the Lorentz Bo assumes
that collision radii are additive. C is combined quadratically in
cogni-1
zance of the experimental fact that the B's are not linear in but require
-21-1
an additional T3 term. The remaining constants are combined linearly in the lack of more exact knowledge and since they are small.
These proposed rules offer four different methods of obtain-ing the constants for the mixture from those for the pure gases. To save space these will be henceforth be referred to numerically
Method I linear Bo, linear C. Method II linear Bo, square root C. Method III Lorentz Bo, linear C. Method IV Lorentz Bo, square root C.
The gas densities for the mixture were calculated using
1939 atomic weights. Since the constants for pure methane and pure n-butane had been fitted with 1928 atomic weights, it was necessary to convert them
to the new atomic weight scale. (Table 1h) The details of this calculation have been described by Stockmayer (27).
Tables 15 through 18 give the deviations of the observed pressures from those calculated by the four methods. Method IV is uniformly
good at all densities. Method I, simplest and most widely used in the past, is clearly second best. It becomes progressively worse at higher densities because the n-butane data was not fitted above 3.5 moles per liter, also because the error inherent in additive collision volumes is relatively more
important at higher pressures. Method III is best of all at low densities but quickly fails at higher densities, since here the error in linear C's is more disastrous. It is interesting that Method II is uniformly bad; evidently Method I owes its sccess to some sort of compensation of errors in the two poor assumptions.
TABLE 14
CONSTANTS FOR THE BEATTIE-BRIDGEMAN EQUATION OF STATE
USED IN CALOULATING THE CONSTAINTS FOR METHANE - N-BUTANE MIXTURES (Based on 1939 Atomic Weights)
Units: Normal atmospheres, liters per mole, K (ToK = toC + 273.13)
Gas CH4 mol.wt.
0.082117
2.2801
0.01856 0.05591 -0.01588 12.81x10
416.042
N-O4H lo 0.082122 17.8210 0.12170 0.24639 +0.09430 350. xlO4 58,121 _ 1_~__TABLE 15
DEVIATIONS OF OBSERVED PRESSURES FROM THOSE CALCULATED BY METHOD I (Linear Bo, linear c)
(Observed minus calculated pressures in normal atmospheres)
Density 1.25 1.5 2.
2.5
3.
3.5
4.4.5
I
(m/l)
Tp. 74.g95 mole percent Methane - 25.105 mole percent n-Butane
( c)
75
100
125 150175
200
225250
275
300
-0.19-0.245
-0.35
-0.53
-0.63
-0.71
-0.82 -0.91 -1.02-0.15
-0.27
-0.
h2
-0.55
-0.70
-0.83
-0.95
-1.09
-1.21-1.31
-0.28-0.53
-0.78
-0.
94
-1.28-1.49
-1.71
-1.83 +0.28-0.57
-0.98
-1.35
-1,74
-2.08 -2.2-2.74
-3.07
+0.83
+0.14-0.50
-1.09
-1.66
-2,18-2.67
-3.15
-3.60-4.02
+1.70
+0o.66
-0.25 -1.10 -2.60-3.24
-3.-17
-4.43
-5. 00
+2.90
+1.42 +0.15-0.97
-2.02-2.93
-3.74
-4.
53
-5.224-5.90
+2.48
+0. 82-0.614
-3.098
-4.io
-5.05
-6.68+6.52
+3.-4
+0.74
-0.10-1.73
-3.-0
-4.26
-5.36
-6.31
-7.23
Absolute average . 5g Avg. % 1.22 De 1.22 Dev.0.75
0.
99
1.31
1.33
1.54
1.
98
2.
47
2.98
3.32
3.92
1.60
1.74
1.92
2.07
2.26
2.37
TABLE
16
DEVIATIONS OF OBSERVED PRESSURES FROM THOSE CALCULATED BY METHOD II (Linear Bo, sq. rt. c)
(Observed minus calculated pressures in normal atmospheres) Density
(m/ll) 1.25
Temp.(
0c)
75
100 125 150175
200
225
250
275
300
-0.67
-0.69
-0.74
-0.79
-0.84
-0.91
-0.96
-1.05
-1.12-1.20
Absolute average 0.90 Average % dev. 2.02 1.5 2. 2.5 3. 3.5 4l. 4.74.995
mole percent Methane - 25.105 mole percent n-Butane-0.90
-0.93
-1.00-1.06
-1.15
-1.24
-1.32 -1.4 3-1.51
-1.62
-1.42
-1.61
-1.73
-1.
S9
-2.03
-2.18-2. 33
-2,49
-2.00
-2.14
-2.32
-2.52
*-2.73
-2.97
-3.19
-3.43
-3.65
-3.91
-2.58
-2.82-3.11
-3.39
-3.72
-4.03
14.33
-4.66
-5.28
-3.12
-3,,51
-3.93
-4.36
-4.78
-5.20
-5.59
-6.oo
-6.37
-6.78
-3.61
-)I.24
-4.825.37
-5.95
-6. 5
-6.92
-7.41
-7.86
-j.30o
-4.02
-4. 93
-5.69
-6.o40
-7.12
-7.69
-8.25
-8.82-9.31
-9.82
-4.32
-'.60
-6.55
-7.42
-8.95
-9.56
-10.68
-11.23
1.22
1.91
2.89
3.89
4.96
6.09
7.21
8.28
2.27
2.81
3.32
3.76
4.13
4.45
4.68
4.81
TABLE 17
DEVIATIONS OF OBSERVED PRESSURES FROM THOSE CALCULATED BY vME-HOD III
(Lorentz Bo, linear c)
(Observed minus calculated pressures in normal atmospheres)
Density (m/) 1.25 Temp.
(o
0C)
'75
100
125 150175
200225
250
275
300
+0.21+0.15
+0.07
+0.01
-0.06
-0.18
-0.26-0.33
-0.0
0
Absolute average Average%
dev. 0.391.5
2.
2.5
3*
3.5
74.895 mole percent Methane - 25.105 mole
+0.37
+0.29
+0.18
+0.09
-0.01
-0.11
-0.19
-0.29
-0.37
-O.
66
+0.89
+0*
70
+0.52 +0.35+0.16
-0.01
-0.15
-0.31-0.45
+1.67
+1.36
+1.05
+0.76
+0.L9
+0.22-0.01
-0.24
-o.67
+2.80 +2.28 +1.80 +1.31+0.97
+0.61
+0.28-0.33
-0.60o
+.32
+3.52
+2. 84
+2.22+1.66
+1.16
+0.73
+0.33
-0.o03
-0.39
4.
percent+6.27
+5.10
+4.13
+3.31 +2.55 +1.93 +1.39+0.90
+0.47
+0.080.24
0.39
0.69
1.10
1.72
2.61
3.94
0.h5 0.66 0.95 1.33 1.82 2.43 3.22 4.04 4.5 n-Butane+8.67
+7.33
+5.78
+4.71
+3.73
+2.99
+2,
34
+1.75
+1.27
+0.83
5.
+11.58+9,40
+7.78
+6,43
+5.24
+4.34
+3.61 +2.95 +2.44 +1.95'5.57
--TABLE 18
DEVIATIONS OF OBSERVED PRESSURES FROM THOSE CALCULATED BY METHOD IV (Lorentz Bo, sq. rt. c)
(Observed minus calculated pressures in atmospheres)
Density
(m/1) 1.25
Temp.
(00)
75
-o.30
oo0
-0.29
125
-0.32
150
-0.3 4
175
-0.36
200
-0.o
225
-o.43
250
-O.9
275
-0.53
300
-0.59
Absolute
0.41
average
Average 0.90
%
dev.
1.5
2.
2.5
3.
3.5
74.895
mole percent Methane
-
25.105 mole
-0.37
-0.36
-0.39
-0o.41
-0.147
-0o.52
-0.56
-0.62
-c.67
-0.74-0.50
-0.50
-0.57
-0.59
-0.68
-0.76
-0.83
-0.92 -1.01-0.57
-0.60
-0.67
-0.76
-0.86
-0.99
-1.10 -1.23-1.36
-1.50
-0.55
-0.63
-0.76
-0.88-1.05
-1.20
-1.37
-1.52
-1.6 s
-1.83
-0.39
-0.58-0.76
-0.97
-1.18-1.39
-1.57
-1.76
-1.93
-2.12 4, percent-0.09
-0.43-0.73
-1.00 -1.29 -1.51 -1.71-1.92
-2.10.2.54
4.5
5.
n-Butane +O.hO +1.03-o.16
+0.22
-0.56 -0.29-0.91
-0o. 72
-1.18
-1.13
-1.50
-1. 37
-1.71
-1.55
-1.93
-1.72
-2.08 -1.82-2.24
-1.94
0.51
0.71
0.96
1.15
1.27
1.33
1.27
1.18
1.0oo
0.9
0.76
0.66
1.os
1.04
0.95
1.03
It is difficult to estimate what part of the observed deviations is the result of the failure of the Beattie-Bridgeman equation to fit the pure gases perfectly. Sums of the averaged observed minus calculated pressures for the pure gases (28) (29), weighted according to
the respective mole fractions, are compared to the averaged deviations for the mixtures in Table 19. The indication is that the effect is of minor importance. It must be remembered that the methane constants were fitted
0
for the range 0 - 200 0 and for densities from 0. to 6 moles per liter. In the case of n-butane, the constants were determined from the data for
0 o
150 to 300 0 and for densities from .5 to 3.5 moles liter. Obviously it is impossible to separate the errors in the equation for pure gases from the combining rule errors.
It is gratifying that the trends observed for this mixture are closely paralleled in the two mixtures which were studied by
Mr. Stockmayer. Final averaged deviations for all three mixtures have been tabulated in Table 20. The uniform increase in the deviations with increasing methane concentration may be attributed to the different ranges of conditions for which the constants for the pure gases apply strictly. There is one exception to this increase; this is for the
75
mole percent methane mixture as calculated by Method III. C for methane is so muchsmaller than in the case of n-butane that linear treatment of 0 causes much less error at such concentrations.
Table 21 presents the deviations averaged for all three mixtures. It may be concluded that in the case of hydrocarbon mixtures, Method IV is superior in accuracy to the other proposed rules. Method I
is an excellent mean between simplicity of treatment and accuracy of
representation, particularly in case the components are not very different.
TABLE 19
COMPARISON OF DEVIATIONS FOR THE PURE GASES AND DEVIATIONS FOR THE MIXTURE
(Averaged observed minus calculated pressures in atmospheres)
Density (m/l)
1.
1.5
2.2.5
3.
3.5
Ei Xi 61
0.03
0.060.09
0.07
0.16
Method I 0.580.75
0.
99
1.51
1.947
2.47 Method IV0.41
0.51 0.710.96
1.15 1.27Y __
TABLE 20
SUMMARY
AVERAGED 0BSRVD MINUS CALCULATED PRESSURES FOR THREE
MIXTUrRES OF METHANE AND N-BUTANE Pressures (Normal Atmospheres)
Points Measured Average P - P obs. calc. Method I II III IV
0.96
2,34
2.44
0.51
1.21 2.682.08
0.59
72
IP
DP
P
1.38
3.49
3.44
0.67
1.44
3.38
3.03
0.65
89
aP A Pt2.07
4.17
1.
4
0.981.76
3.59
1.71
0.92 TABLE 21 GRAND SUMMARYAVERAGE PERCENTAGE DEVIATION OF OBSERVED MINUS CALCULATED PRESSURES FOR ALL THREE MIVURES - 225 POINTS MEASURED
Method Average % Deviation
I II III
IV
1.503.27
2.35
0.74
i----~CP--
-23-VI. SUMMARY
The vapor pressures of isobutene have been measured at several temperatures and are:
Temp. (oC)
30
50
75
100
125Pressure (normal atmospheres)
3.444 + 0.006
5.976
+ 0.o00s
10.861
+
0.019
18.084
+
0.023
28.412 + 0.025The critical constants of isobutene have been determined
as:
14*.73
±
0.02
0C39.485
0.014 atm.
1
4.167 + 0.032 moles/liter
The compressibility of isobutene in the superheated region has been measured at densities of 1 to 9 moles per liter and at
0 o
temperatures of 150 to 275 0, at 25 intervals. The isometrics for from 1 to 4 moles per liter have been fitted to the Beattie-Bridgeman equation of state with an average deviation of 0.218 atmospheres. The equation of state constants so obtained are:
Ao = 16.9600 a = 0.10860
Bo = 0.24200 b = 0.08750
R = 0.08206 c = 250. x 10
Compressibility measurements have been made for a
gaseous mixture of methane and n-butane at densities of from 1.25 to 10 moles per liter and over a temperature range of 250 to 300
0
at 250intervals. The results indicate clearly that the equation of state con stants for the mixture may be accurately calailated from the constants for the pure gases. The most accurate of the proposed combining rules consists in linear combination of a and b, square root combination of
1
A
Appendix I.
THE METHOD OF MEASURE.ENT AND CALIBRATION OF THE APPARATUS.
The experimental procedure consisted in measuring, as accurately as possible, the temperature, pressure and volume of a fixed mass of the substance. Keyes, Burks and others have used quite similar methods in previous equation of state work. (30) The present method has been well described by Beattie (31), Simard (23) and Su (20) so that the discussion here will be very brief and undetailed.
The apparatus used is shown diagrammatically in figure 2. The material studied was maintained at a constant temperature by the thermostat G. T' is a control platinum resistance thermometer and T is the platinum resistance thermometer used for measuring the temperature. The volume of the gas space in F was controlled and measured by adding or withdrawing known amounts of mercury by means of the volumnometer, 0. Pressures were measured on the Amagat dead weight piston gauge, B.
The maximum possible temperature range of the measurements extends from the freezing point of mercury to 32500, where large uncer-tainties are introduced by the presence of mercury vapor. Pressures from 10 to 500 atmospheres may be measured. Above this pressure hysteresis effects in the dilation of the apparatus seriously effect the accuracy. In the present research the conditions were more restricted because of possible decomposition of the substance measured.
//0 VOL TS
THE COMPRESSIBILITY APPARATUS
Figure
2.
2A
1. Measurement of Pressure.
Description and Calibration of the Gauge.
The pressure in the bomb F was transmitted by mercury to the riser block, D, from there by oil to the base of a piston float-ing in oil. The gas pressure was balanced by puttfloat-ing weights on a
scale pan. When the pressure was just balanced an insulated steel needle in the top of the riser block made intermittent electrical contact with the mercury surface, causing a pilot light to flash on and off. The gauge was calibrated against the vapor pressure of carbon dioxide at OO as described by Doctor Bridgeman. The gauge constant (pressure unit weight) has shown first an increase, then a decrease, over a period of years. Similar behavior has been observed with several other gauges in the laboratory.
Constant of Piston Gauge No. 21,
1927 0300 = 2.00184 international mm./gr. at Cambridge
1931 C03 0 = 2.00291 mm./gr. 1935 0300 = 2.00355 mm./gr.
Present value C3 0o = 2.002677 mm./gr.
The variation of the gauge constant with temperature is caused by the expansion of the steel and mar be calculated from the equation
C o
=
0o
+ 2.2 x
10
(30
- t)
t 30
0300 = gauge constant at 30°C.
Calculation of Pressures.
Gas pressures were calculated by means of the relaticr Pgas P + PBar + PLevel + PMeniscus " PHg
3A
P = pressure measured by gauge.
PBar a corrected barometric pressure.
PLevel a correction for the difference in levels between the gauge and the bomb.
This correction consists of three parts: (1) oil head
(2) mercury head at room temperature (3) mercury head at bath temperature PMeniscus = a correction of + 1. mm. for capillary
depression at the oil-mercury interface in the riser block.
PHg = partial pressure of mercury, corrected for the change with total gas pressure by the Poynting equati on.
2.303 RT logo H V (ga g) PoHg
where PoHg = vapor pressure of mercury at ToK V = molal volume of liquid mercury.
2. Measurement of Mass..
The substance to be investigated, after suitable purifi-cation (Appendix II) was condensed into a stainless steel weighing bomb. This was weighed repeatedly against a tare of identical dimensions to minimize air buoyancy corrections. Weighings were made to a tenth of a milligram and buoyancy corrections applied. After the loading was com-pleted, a correction wae made for the gas lost in the loading system, if necessary.
![Figure 1. 0.2 8 0.30IiJ1Lu4JcoCI)DLI)wl)a-c,[LI TERSIMOL]-- --- I](https://thumb-eu.123doks.com/thumbv2/123doknet/14519889.531208/25.918.92.835.162.1033/figure-iij-lu-jcoci-dli-wl-tersimol.webp)
