A CONTINUOUS SEISMIC PROFILING SURVEY OFF THE COAST OF LEBANON
by
DONALD HUGH CARLISLE
B. A. Sc., Engineering Physics, University of Toronto (1963)
SUBMITTED IN PARTIAL FULFILLMENT OF THE REQUIREMENTS FOR THE
DEGREE OF MASTER OF SCIENCE
at the
MASSACHUSETTS INSTITUTE OF TECHNOLOGY
June 1965
Signature of Author
Depa rZent of Geology and Geophysics,
Certified bv
Thesisprfervis or
Accepted by
Chairman, Depar1(mental Committee on Graduate Students. .00 Ar L- 4v
r If
ABSTRACT
A CONTINUOUS SEISMIC PROFILING SURVEY OFF THE COAST OF LEBANON
by
Donald Hugh Carlisle
The bathymetric results from a geophysical reconnaissance
survey off Lebanon show that the continental shelf of Lebanon is generally narrow, with broadenings off Damour and between Tyr and Saida. The dip of the slope increases northward from 6 degrees at Tyr to 30: degrees at Beirut. South of Beirut, and possibly north of it, the slope is incised with canyons. Seismic profiling results show that a deep, ubiquitous, possibly Upper Cretaceous reflector forms the surface of an old slope
off Lebanon and extends into the Eastern Mediterranean as far west as Cyprus and as far south as Port Said. On the outer shelf, this surface is overlain by a layered sequence of sediments as thick as 0. 83 seconds
and by an upper veneer of sediments as thick as 0. 008 second. The continental rise is composed of mostly inhomogeneous sediments south of Beirut and a thick sequence of layered sediments north of Beirut. The area is surrounded by layered, mostly Nile-derived sediments.
It is suggested that the present shelf was formed by deposition of sediment on the ancient slope, and was later eroded. The eroded
material, along with land-derived material, now constitutes the sediments of the rise.
Thesis Supervisor: Dr. J. B. Hersey Senior Scientist
Woods Hole Oceanographic Institution Woods Hole, Massachusetts
and
Professor of Oceanography
Department of Geology and Geophysics Massachusetts Institute of Technology Cambridge, Massachusetts
p
Page
ABSTRACT 2
LIST OF FIGURES 4
CHAPTER I. INTRODUCTION 7
CHAPTER IL METHODS OF OBSERVATION AND ANALYSIS 8 CHAPTER III. PRESENTATION AND DESCRIPTION OF
RESULTS 25
CHAPTER IV. DISCUSSION OF RESULTS 67
CHAPTER V. SUMMARY AND CONCLUSIONS 90
APPENDIX A. GEOLOGY OF LEBANON AND ITS
RELATIONSHIP TO SURROUNDING AREAS 94
APPENDIX B. TABLE 1 124 ACKNOWLEDGEMENTS 129 REFERENCES 131 TABLE OF CONTENTS lZ I
V Figure Figure 1. 2. Figure 3. Figure Figure Figure Figure 4. 5. 6. 7. Figure 8. Figure Figure Figure Figure Figure 9, 10. 11. 12. 136
Schematic of profiling electronics.
Arrangement of ship, source, and receiver for seismic profiling.
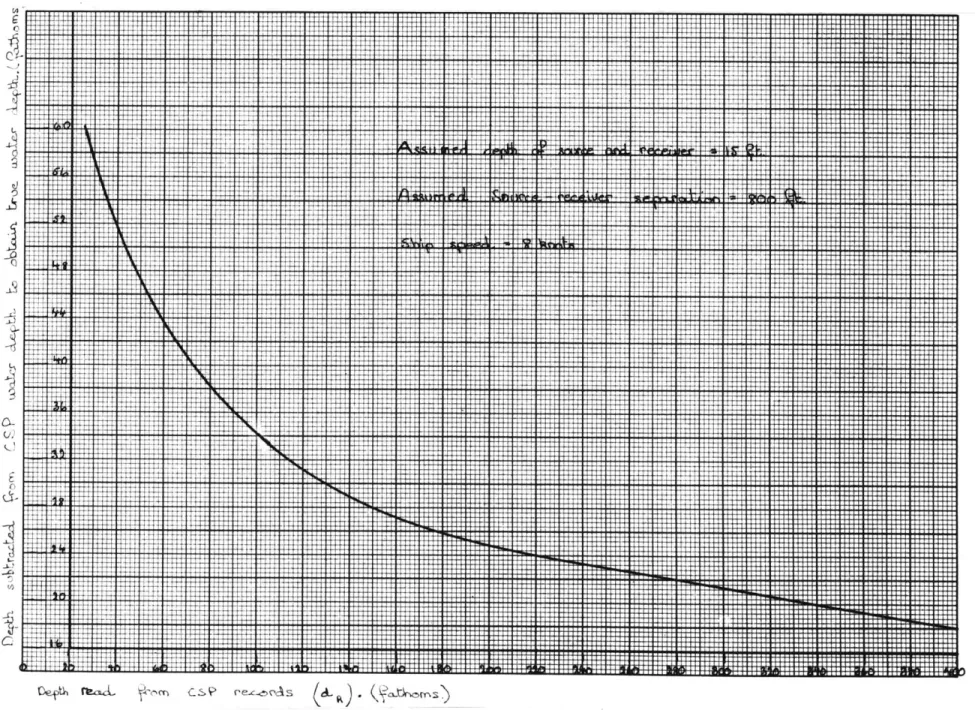
Correction curve used in obtaining true water depths from seismic profiling records.
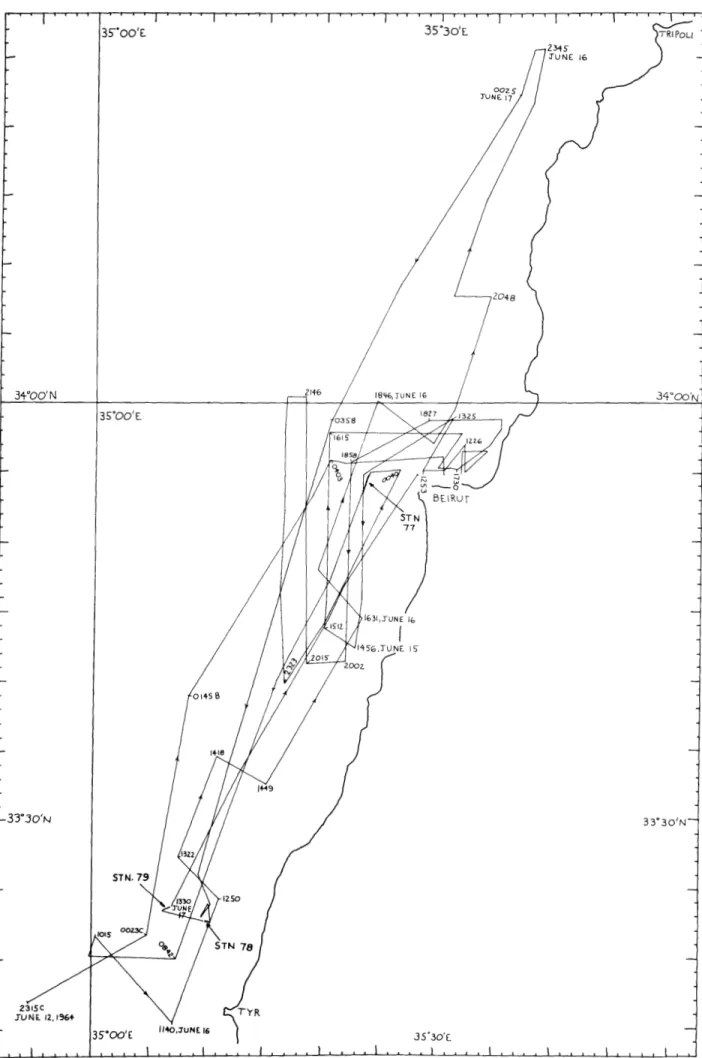
Corrected ship's tracks of echo-sounding survey. Effect of varying velocities of sound in overlying
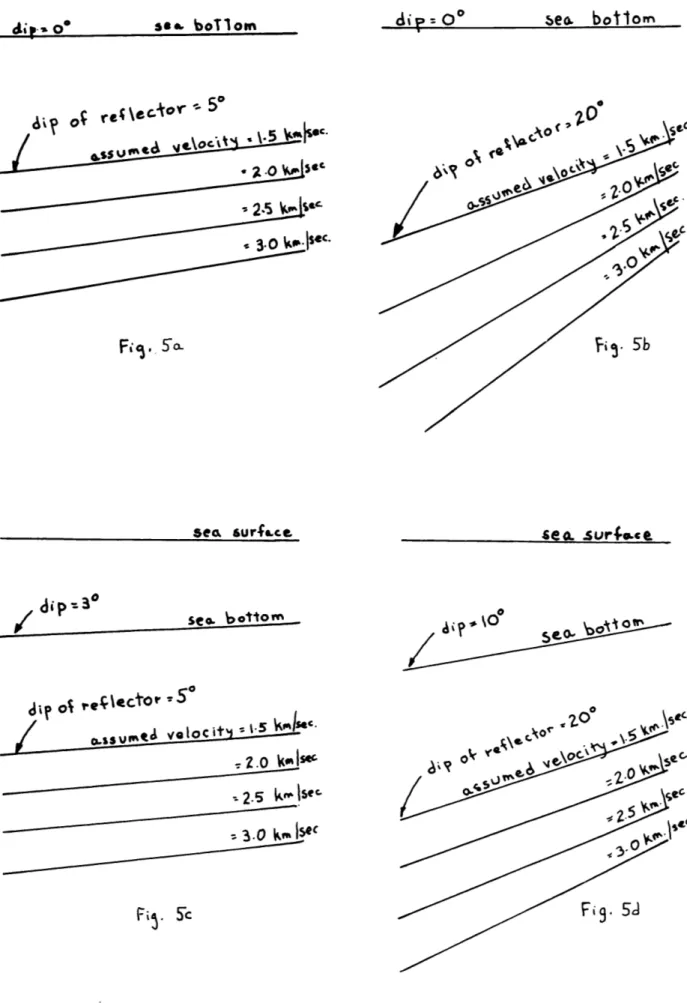
sediment on position and attitude of reflector. Offshore topography of Lebanon.
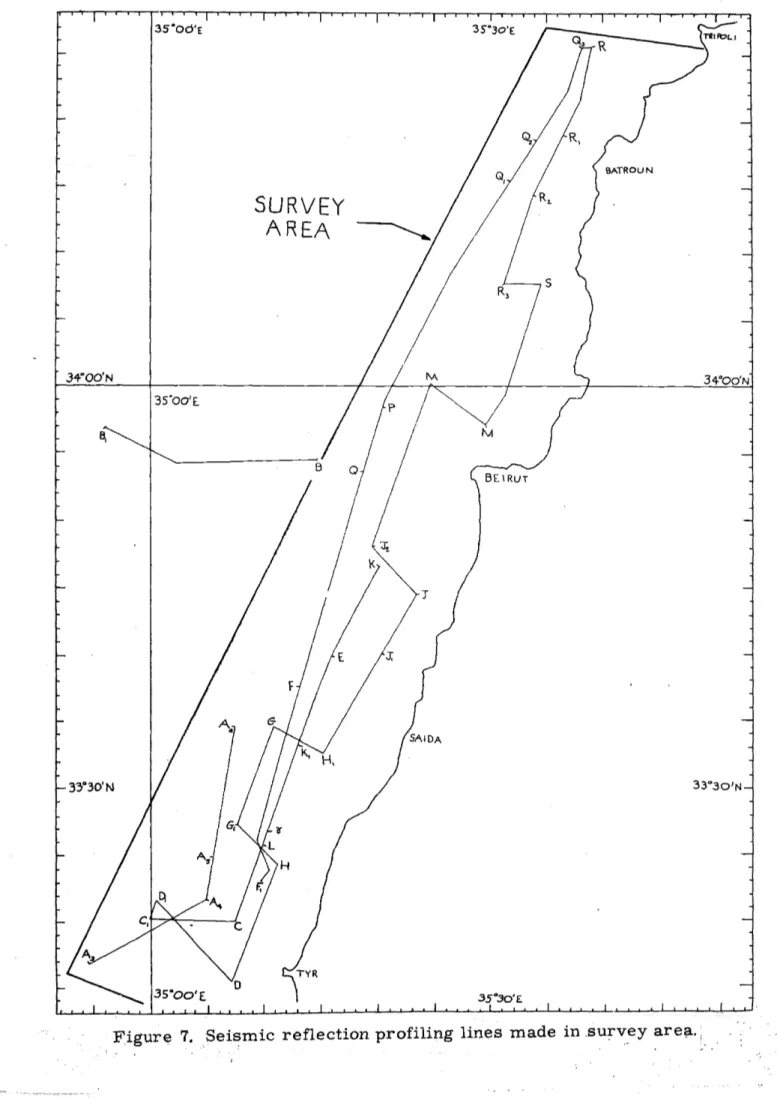
Seismic reflection profiling lines made in survey area.
Seismic reflection profiling lines made outside survey area. Profile A1A5 -Profile BB2. Profile EC. Profile FF1. Profile GG1. Profile A6A4.4 LIST OF FIGURES Text Fiures Page 9 9 17 18 22 26 30 31 39 40 40 40 40 Figure 14,
Text Page
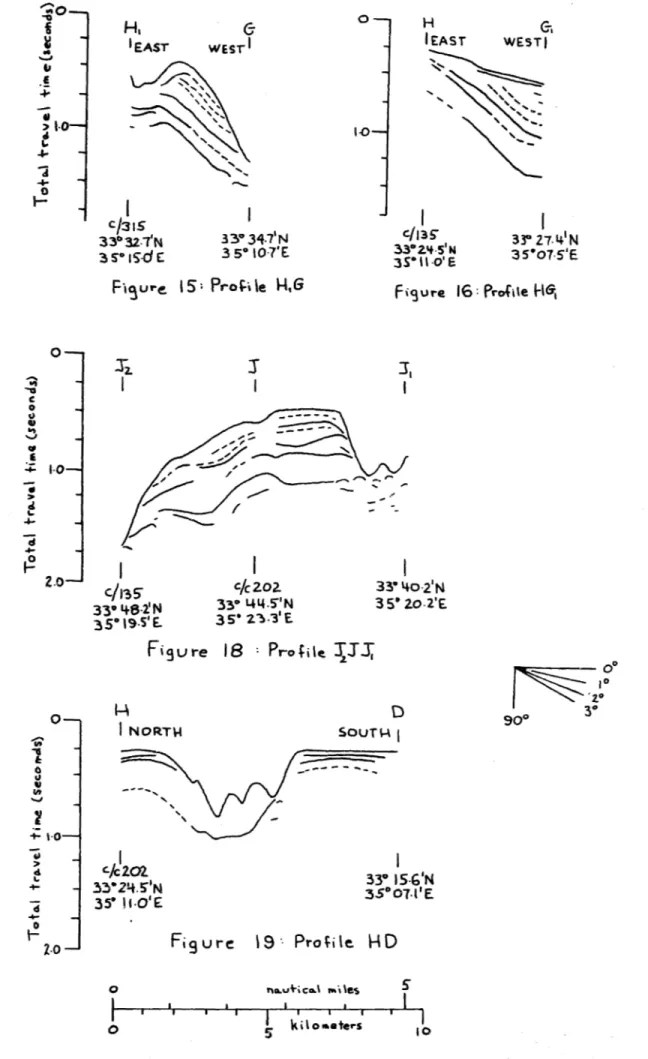
Figure 15. Profile H1G. 41
Figure 16. Profile HG 41
Figure 17. Veneer of sediments on shelf of Tyr-Saida Bank
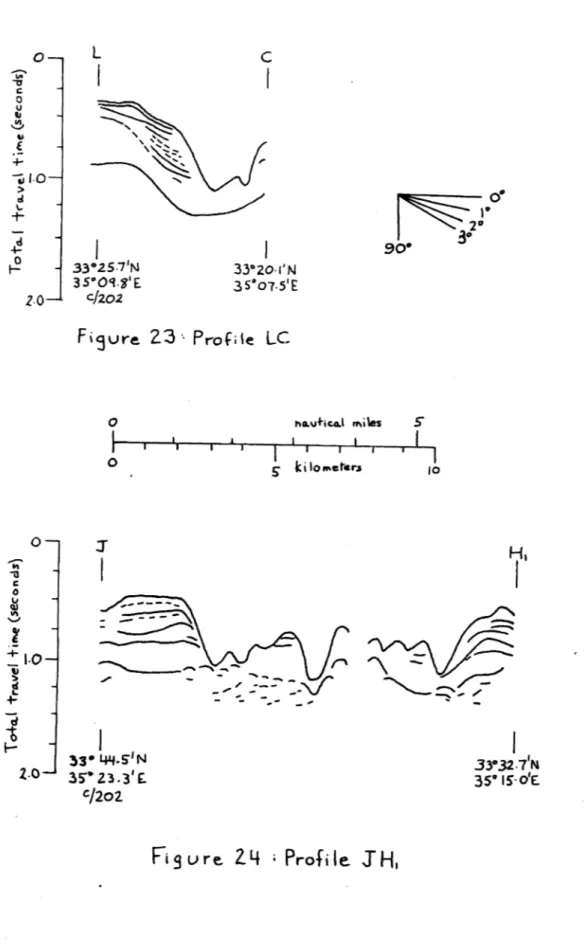
seen with short-pulse echo-sounder. 42 Figure 18. Profile J2 1.41 Figure 19. Profile HD. 41 Figure 20. Profile CC1. 43 Figure 21. Profile DD1. 43 Figure 22. Profile A4A30 43 Figure 23. Profile LC. 44 Figure 24. Profile JH1. 44 Figure 25. Profile KK1. 46 Figure 26. Profile RR2. 45 Figure 27. Profile
Q
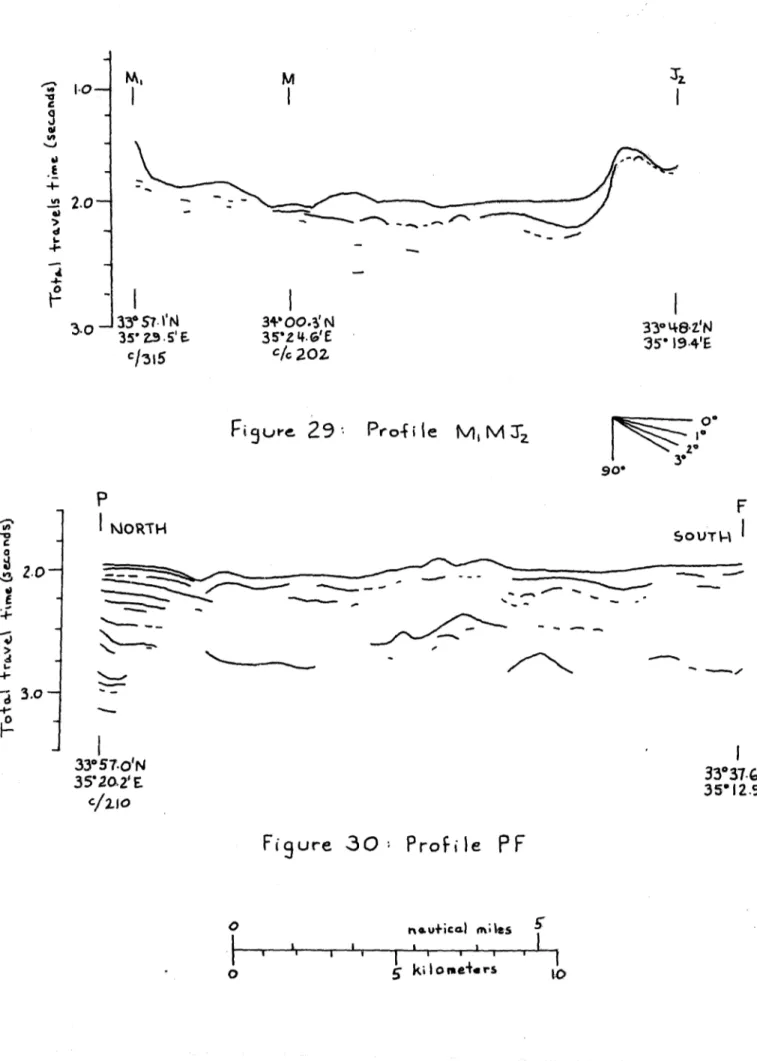
3Q 1 45 Figure 28. Profile SM1. 46 Figure 29. Profile MSM5 2Figure 30& Profile PF. 47
Figure 31. Profile
Q
2Q'
48Figure 32. Profile R1R33* 48
Figure 33. Contour map of deep reflector between Tyr
and Saida. 69
Geological map of Lebanon. (enve of View of model showing adjacent geology of Lebanon. View of model showing adjacent structures of Lebanon. View of survey area south of Beirut.
Tyr-Saida Bank.
Detail of bedding on shelf and slope of Tyr-Saida Bank. Detail of bedding on wide part of shelf opposite Damour. Slope- and rise at south end of survey area (opposite Damour).
Continental rise between Beirut and Tyr-Saida Bank. Slope and rise between Beirut and Tripoli.
Three-dimensional view of sediment-filled depressions beneath continental rise, between Beirut and Batroun.
Elope i1 back thesis) 33 34 35 35 36 36 37 37 38 38 Figure Figure Figure Figure Figure 34. 35. 36. 37. 38. Page Text
Main structural units of Lebanon.
Main structural units of Levantine coast between Israel and Turkey.
Tectonic map of Lebanon.
Stratigraphic columns for Lebanon.
Regional structures surrounding Lebanon.
Plates Plate 1. Plate Plate Plate Plate Plate Plate Plate Plate Plate Plate 2. 3. 4. 5. 6. 7. 8. 9. 10. 11. 95 99 99 105 116
CHAPTER I INTRODUCTION
In the summer of 1964, the R/V CHAIN (Cruise 43) conducted a two-day reconnaissance survey of the continental shelf, slope, and rise
off Lebanon, making seismic profiling, bathymetric, gravitational, and magnetic measurements. One camera and two dredge stations were made. Except for a study of shelf sediments, no other work has been done
off-shore of Lebanon.
The object of this thesis is to present and interpret the seismic profiling and bathymetric data. The results of the lowerings will also be described. The gravitational and magnetic results have not been reduced by the writer, and therefore are not presented here, but they have been examined qualitatively during the analysis of the seismic profiling data.
CHAPTER II
METHODS OF OBSERVATION AND ANALYSIS
I. OBSERVATIONS
The Continuous Seismic Profiler
The Continuous Seismic Profiling system will be described here briefly. Complete descriptions of the theory, instruments and techniques
employed can be found in J. Ewing (1963), Hersey (1963), Curry et al. (1964), Hoskins (1964a, 1965), Shor (1963), Caulfield (1962), and Caulfield et al. (1965).
The Continuous Seismic Profiler, used for mapping geologic structures under water-covered areas, produces a record displaying a profile of the sea floor and of acoustic discontinuities beneath the sea floor. If the discontinuities, which often appear as layers, represent lithological changes in sediments, (i. e. boundaries between different
sediment layers), then the record is analogous to a geological cross section. The record is different from a geological cross section because it plots travel time against elapsed time, (corresponding to the distance the ship advances), rather than true depth against linear horizontal distance.
A. 'Design of Profiler:
The -design of the profiling system used at the Woods Hole Oceano-graphic Institution is shown in the schematic diagram in Figure 1. The
apparatus consists of a sound source and a receiver, both towed behind
Figure 1. Schematic of profiling electronics.
Figure 2. Arrangement of ship, source, and receiver for seismic profiling.
the ship, (see Figure 2), and a recorder for registering travel time. The
source, triggered synchronously with the sweep of the recorder, generates a short pulse of high energy at regular intervals. The subsequent pulses and echo trains received. from the sea floor, deeper interfaces, and other discontinuities are received by a hydrophone array and converted into electrical signals. These signals -are passed through a broad-band ampli-fier, filtered for both a lower and a higher frequency presentation, and fed to two separate recorders.
The strengths of the signals are recorded as variations in the darkness of the line produced by the sweep-action of the recorder.
Moreover, the recorder provides automatic correlation of trains of waves from successive sound pulses. As the ship moves over a continuous
reflecting surface, the successive pulses reflected from that surface appear side by side along the length of the record, producing a line or curve as the paper advances through the recorder. A profile is thus built up as the ship proceeds.
Concurrent with. these recordings, magnetic tape recordings of the unfiltered output of the preamplifier of the hydrophone are made.
This combination of recording allows the data to be replayed and auto . matically correlated -on other recorders at a later time (Bunce and Hersey, in' preparation).
--The components of the system are subject to some basic limita-tions. A high-energy source is required for penetration of the sound to deep reflectors. The sound pulse must be of short duration to obtain resolution between finely-spaced layers. The emitted sound pulse, moreover, must have most of its energy below 800 c. p. s. (Hersey and Ewing, 1949), preferably in the range of 10 to 150 c. p. s. (Hersey, 1963), because higher-frequency energy is preferentially absorbed by sediments. A compromise must thus be made between resolution and penetration in choosing the output wave form (Hoskins, 1965). The receiver must be pressure-sensitive and acceleration-insensitive, as well as having a linear response over a large dynamic range, and should have band-pass charac-teristics favorable to frequencies below 400 c. p. s. Finally, the recorder must have a precision time base keying the sparker and the recording
sweep simultaneously on a repetitive basis. The accuracy of the recorder, and hence the straightness of the scale lines along the record, is deter-mined by the consistency of its sweep rate over long periods of time.
Throughout this survey, the sparker was used as a source, (Caul-field, 1962; Caulfield et al., 1965). The sparker produces a shock wave which decays exponentially, followed by several bubble pulses alternating 1800* in phase. With a sour ce depth of 12. 5 feet, the total length of the pulse train, incduding a surface reflection, is about 33 milliseconds. The peak output pressure of the system, operating at 100,000
joules,
(10 kilovolts-and2000 farads), is 134 db. above 1 dyne/cm2 at one yard. In this survey, the source was operated at 8. 0 kilovolts and 2000/' farads (64,000 joules), and was triggered once every 10 seconds.
Recordings were obtained on the Precision Graphic Recorder (PGR), (Knott and Witzell, 1960; Knott and Hersey, 1956). The PGR was operated on the 1000 fathom scale, which has a sweep rate of 2. 5
sec., and was gated to record every fourth sweep. The resulting vertical-to-horizontal exaggeration of the record is about 20:1.
The signal recorded on the two PGR's was filtered in frequency bands of 15 to 50 cycles per second and 100 to 200 cycles per second respectively by means of Allison rnodJl 2AR passive filters.
The tape recorder used was a 4-track Crown recorder (model 800). On the first track, CSP data were recorded; on the second, voice announcements; on the third, scale lines; and on the fourth, the 60
cycle signal which formed the time basis of the PGR.
The receiving sensor consisted of a 15-foot, neutrally buoyant Alpine array, having five equally-spaced variable-reluctance hydrophones. The frequency response of this array is peaked at 120 c. p. s. (W. Dow, personal communication).
In some places, penetr ation of sediments to about 40 feet was achieved with a .high- resolution, short-pulse echo- sounding technique employing a 12 K. C. pulse of 0. 1 to 0. 2 milliseconds duration. In these
studies, a POR sweep of 0. 25 seconds was used. - 12
-B. Capabilities of Recorder
The capabilities of the seismic profiler can be demonstrated by considering the r ?sults of the theory of sound propogation. Sound
propogation is governed by the Rayleigh wave equation. When the sound strikes a boundary, (i. e. water-air, water-sea floor, sediment, or rock boundaries), its reflection is governed by the corresponding boundary
conditions. In the case of a plane wave striking a plane boundary separ-ating two materials of constant density and sound velocity (Officer, 1958), the main conclusions of interest are:
1) A wavefront striking the air-water interface undergoes a 1800 phase shift and almost total reflection.
2) Sound will not reflect from an interface unless there is a contrast in acoustic impedance between the materials on either side.
Given the right conditions, a geologic interface may not reflect sound at all; similarly, an acoustic reflection may not correspond to a lithologic change. It is generally found, however, that when an echo train has been compared with layering in cores, (Nafe and Drake, 1957; Shumway,
1960), the marked changes in porosity and lithification are evident on the reflection record.
In any C'ase, a seismic profile will show only the presence of re-flecting surfaces within the ocean floor; this information alone provides
-inferences of a limited morphological type, such as 1) the lateital extent of layering and its relief, 2) the shapes of sediment bodies,
3) unconformable and conformable relationships between reflecting horizons,
4) the probable location of outcropping of layers,
5) the relationship of topography and structure; for example, whether topographic benches represent the outcropping of resistant layers.
No direct inferences can be made as to the copposition of the layers.
The special capability of the seismic profiler is delineating the geometrical relations of reflecting interfaces (Hoskins, 1965).
C. Interpretatiot of Records:
The interpretation of CSP records in this paper is largely limited to the identification-of reflecting surfaces by the correlation of individual echo sequences from successive pulses (a typical echo sequence is that formed by the succession of echoes reflected once by the sea floor) (Bunce
and Hersey, in preparation).
It is necessary to identify false echo-sequences on the record which
can not only be mistaken for real reflectors, but which can mask interfaces whose returns arrive concurrently with the interfering signals. Common
among these signals are:
-1) . So-called multiple reflections from the sea floor and deeper layers, involving repeated transits of the water colunitn by the sound pulse.
2) Side echoes from reflectors on or below the sea floor which are not directly below the line of the source and the receiver. Although these returns contain information about the topography'or subbottom structure, they should not be interpreted as coming from a vertical reflection.
3) Noise generated outside the profiling system, such as power-line cross-feed, or ship-generated, water-bourne noise.
Multiple sea bottom reflections can easily be recognized. For instance, the first multiple bottom reflection will appear at twice the
depth and have double the slope of the sea floor reflection. In shallow water, lines appearing after the first multiple bottom reflection were
generally not trusted in this interpretation.
Topographic side echoes can be distinguished from subbottom reflectors by replaying the recordings through a filter which has a low frequency cut-off at 1000 c. p. s. or greater. Because of the preferential
absorption of higher-frequency sound by sediment, the side echoes will
be recorded but returns from true subbottom reflectors will not.
Noise generated outside the profiling system can often be recog-nized by exarmining the record at a timne when the source was off or at
-times between the initiation of the pulse and the sea floor reflection (Hersey, 1963).
After these unwanted signals are removed, it must be kept in mind that the resolution of individual layers on the recording is determined by the width of the band of parallel dark and light lines which represent a single reflecting surface. The width of this group of lines depends on:
1) The duration of the outgoing pulse.
2) The superposition of the pulses travelling along four separate source-reflector-receiver paths, which are determined by the relative positions of the source and receiver with respect to the sea surface and the sea floor. This process will not only widen the band of lines
rep-resenting a single reflector but can also produce lines on the record which appear to represent additional reflectors. The resolution of individual
reflecting surfaces has been estimated by Hoskins (1965) to be 50 milliseconds. 3) The width of the bandpass presented.
4) The recovery characteristics of the filters.
An examination of phase continuity and interference can be helpful in distinguishing individual reflectors in a series of layers which are spaced
closer in time than the duration of the outgoing signal. The ability to
correlate corresponding events on successive sweeps is determined by the
-Figure 3. Correction curve used in obtaining true water depths from seismic profiling records.
rafio of the sweep-speed of the recorder to the wave period of the signal (Curry et al., 1964).
II. METHODS OF ANALYSIS
The following steps were taken in the analysis of the data: TOPOGRAPHIC DATA
A. Adjustment of ship's
Tracks:-Track plots were prepared by the deck officers showing the
position of the ship's tracks based on radar fixes. All the survey tracks were plotted on a grid which was 2. 5 times larger than the original. The position of the time marks occurring between fixes was corrected to allow
for variations in the ship's speed. The tracks were then adjusted, using the depths shown at each five-minute mark and the topographic maxima
and minima which occurred between these marks, so that the depths at each intersection of the tracks agreed. Along some lines, the echo-sounder was not operational; in this case, depths were computed from the sea floor depths shown on the higher-frequency presentation of the seismic profiler using a hyperbolic curve (Figure 3 ). This curve compensates for the fact that the source-receiver travel path is not near-vertical in water shallower than 400 fathoms. The curve was calculated assuming
a source and receiver depth of 15 feet, and a source-receiver separation of 800 feet. The correction curve was compiled so as to agree with other concurrent seismic profiling and shallow-water echo-soundings. At the time, the ship was maintaining a constant speed of eight knots; hence, the t.g
-variations in source and receiver depths should be small. The maximum disagreement between depths obtained by seismic profiling and echo-sounding, including the error of zero-registering the scale lines and reading the records, is estimated to be 15 fathoms.
Due to the large number of intersections, most of which occur at oblique angles, and the large changes of depth over a relatively short
horizontal distance, the depths of the intersections agree on the average to within 20 fathoms. The maximum deviation of a track from its original position based on fixes, is about 0. 75 miles.
B. Preparation of Topographic Map:
From the resulting track network (Figure 4 ), a topographic map of the sea floor was prepared (Figure 6 ). Since the ship was not allowed within the three-mile limit of Lebanon, most of the depths obtained are deeper than 200 fathoms. Topographic lines shallower than this are obtained from a chart by Boulos (1962), who shows in some detail individual soundings along the continental shelf and upper slopes. It is not known whether these soundings were obtained by echo-sounder or
cable lowerings during dredge stations. Due to the detail of echo-sounding lines south of Beirut and their relative scarcity north of Beirut, the
southern part of the topogra~phic map is much more accurate than the northern.
-fr
The unit of depth used in the presentation and discussion of the topographic data is uncorrected fathoms.
SEISMIC PROFILING DATA
1. The chart of the echo-sounding tracks, along which the seismic profiling records were taken, was reduced to the same scale as the
geological map of Lebanon (Plate 1 ).
2. Tracings were made from the records of the survey and from subsequent records, which were obtained by replaying magnetic tapes when details on the original records were not clear. These appear in Figures 9 to 32
3. The tracings were re-proportioned using a flow camera
(Hoskins, 1964b) so that, while the vertical scale across the width of the records was constant between tracings, the horizontal scale, along the length of the record, was changed from a time basis to a constant-distance basis. At the same time, by reducing the overall scale of the tracings, their horizontal length between successive fixes was made equal to the corresponding lengths of ship's track on the scale of the geological
map of Lebanon (Plate 1 ).
4. A model using the re-proportioned tracings was made in three dimensions, as an aid to interpretation (Plates 2 to 11i). This model,
21-see, surfece,
atip.I 00 see, boTlom
see-. SUrio~Ce dT0. beo. botlorn 2 .0 ~~~S 2.1 Sac-sea. sur;9-ca sea sur;.ce
ISea.
6to
2.cc 0Fig
5BAi
ectof VwrpItv\
vekocifles o souria. in~ Over \j Irlconstructed on the same lateral scale as the geologic map of Lebanon (Plate 1 ), allowed the writer to determine whether stratigraphic, topographic, or structural features seen on land could be extrapolated seaward to the area shown by the model.
5) The seismic profiling results presented here are the
repropor-tioned tracings. Several photographs of the model are included to assist the reader in following the description of the results. A solid line
represents an easily recognized succession of echoes. A dashed line represents successions which are less conspicuous. A dashed line with
a question mark suggests the continuation of a layer between two points where it can be seen.
In these tracings, the attitude of the reflectors is based on the assumption that the velocity of the seismic pulse is always the same as the velocity of sound in water (i. e. 1500 meters/second); but the pulse travels through sediments in which the velocity of sound is greater than that in water. No correction is made for the greater velocity of sound in
sediments, since no information is available on this point in the area surveyed. The effect of such a correction on the dip of an interface is shown in Figure 5 . As a result, the dips of buried interfaces on the
reflection recordings are reduced on the shelf and exaggerated on the slope. (Hoskins, 19651. If a layer crops out in a canyon, the velocity difference
-between water and sediment can be used to calculate either the dip of
the layer or the velocity of sound in the overlying material (Hoskins, 1964; Roberson, 1964); the calculation of one quantity assumes a value for the other. Such calculations, were tried assuming horizontal layering. These results will be indicated in the discussion of the profiling data.
Arc-swinging to determine the true position of the layers (Hoskins, 1964) was considered unneccessary. To be of value, the arc7 swinging
must take into account the velocity of sound in sediment, and this quantity is unknown.
In the discussion of the geological interpretation of the results, layer thicknesses will be reported as the difference in total travel time between echoes below and above the layer, and similarly, depths below the sea floor. The context will indicate whether layer thickness or depth is intended (as in Bunce and Hersey, in preparation).
-CHAPTER III
PRESENTATION AND DESCRIPTION OF RESULTS I, TOPOGRAPHIC RESULTS
The topographic contour map (Figure 6 ) describes the continental shelf, slope, and rise off Lebanon. On this map, solid contours, mostly south of Beirut and outside the three-mile limit, indicate where the
topography has been well-established by echo-sounding lines. Dotted contours, mostly north of Beirut and inside the three-mile limit, indicate where the topography has been inferred from available echo-soundings and soundings given by Boulos (1962) to 200 fathoms.
The nearshore information given by Boulos indicates that except where broadenings of the shelf occur (these features will be discussed in
the following paragraphs), the shelf is generally 3 to 7 km. wide, with a shelf break at a depth of about 50 fathoms.
A detailed description of the topography south of Beirut will now be given. In this area, much of the continental slope is incised by
canyons, and relevant information on them is given in Table I. The seaward extension of lines A to E on the contour map are good reference points for a detailed discussion of the topography because they roughly define the areas containing interesting topographic features.
Between lines A and B off Tyr, the shelf break appears to be about 25 fathoms deep, approximately 4. 5 kilometers off shore. The continental slope between the 100-fathom and 500-fathom contour lines has an average
declivity of 60. In the north half of the area, three canyons are recognized between the 200-fathom and 600-fathom contour lines.
Between lines B and C, a feature exists which will be called the Tyr-Saida Bank. The shelf of this bank extends farther seaward than the adjacent shelves, and has an average slope of 2. 50 between the 100-fathorn and 200-fathom contour lines. The shelf break occurs at a depth greater than 200 fathoms, approximately 14 kilometers from shore. The slope fronting the bank has an approximate declivity of 120 between the 200-fathom and 600-200-fathom contour lines. Only one canyon cuts across the
slope. Near the edge of the shelf, the canyon is represented by a 30-fathom depression, but is cut much deeper farther down the slope. From the
shelf break down to 400 fathoms, the canyon is sinuous; deeper than 400 fathoms, it curves slightly in a WSW direction.
In the area between lines C and D the slope to the north at the Tyr-Saida Bank is deeply incised by canyons. Four systems of canyons are recognized: the southern one has four tributaries; the next northward has three; the other two are single canyons. All but the northernmost of
these canyons appear to stop at the base of the continental slope.
Opposite Damour (between lines D and E), as in area B to C, the shelf is again wider than in the adjacent areas. Its average slope is 3. 5* between the 100 -and 200-fathom contour lines. The shelf break occurs at
I W-w . MR
-a depth of 220 f-athoms (410 meters), -approxim-ately 10 kilometers from shore. The average declivity of the slope steepens from 90 in the south to 130 in the north. Although this feature is bounded to tle north and south by canyons, none cut across the embankment.
North of line E., near the Beirut peninsula, a marked increase in the declivity of the continental slope is seen; it increases to 20 0 on the west side of the peninsula, and to 30* on the north. Several canyons are seen near the peninsula; a major one, named Beirut Canyon by Emery et al. (in press), is fed by several tributaries from the south. These canyons all extend to the continental rise.
South of Beirut, the base of the continental slope, following
approximately the 700-fathom line, is marked by hills typically 20 meters high, which extend perhaps a kilometer seaward to the 750-fathom contour line. Between the 750 and 800-fathom contour lines, the upper continental
rise is characterized by long rolling hiUs and a smooth sea floor. Out-side the 800-fathom line, variations in topography become slight and the sea floor descends westward in a long concave arc (Emery et al. , in press).
North of Beirut, only two sounding lines across the rise and lower slope define the topography. The available information suggests that the slope is steep (on the order of 150), and variations in both the shallow-water and the depp-shallow-water soundings indicate that the slope is incised by canyons.
-4
44
IL SEISMIC PROFILING RESULTS
When a seismic profiling survey along the edge of a continental margin is laid out so that the survey lines are at right-angles to the shore, the change in the configuration and sequence of sediments can be traced from the continental rise to the continental shelf. The data can often then be grouped into the physiographic divisions of continental shelf, slope, and rise. This reconnaissance survey, however, was run mostly parallel to the shore, with the result that many of the north-south profile lines
cross the continental margin obliquely. Moreover, along the coast of Lebanon, a number of structural or topographic units extending seaward from the shelf to the rise complicate the organization of the data into
divisions of shelf, slope, and rise. Nevertheless, for purposes of com-parison, this classification has been used. Fortunately, most of the structural and topographic units can be discussed satisfactorily within
this framework. In many cases, the profiles will be grouped to illustrate a structural or topographic feature. Consequently, the profiles illustrating one type of structure will often be chosen to overlap the profiles illustra-ting the neighboring structure in order to point out the relation between the two. The profiles will be referred to by upper case letters; particular
points of interest will be indicated by Greek lower case letters. Photo-graphs of the model constructed from the reflection profiles will assist the
reader in identifying profile lines and will show the various structures in three dimensions.
4
I
I
N 4 4 44 A gFigure 8. Sesimic reflection profiling lines made outside survey area.
A.
GE LOG CAL
[lAP
r* &mL.
OF
1LEBANON
S vt
S IGN
S-~4 &~aA% ~4EMJIW1ROCK.S.
A.S
.A VfS. ftioce,~e. f!d % f4%n *~of ;o&, Q40^01 3fOk CMAIC, 2*^6. S&Ecw ON 0 R y.
ar&e-4'% ~riaA o~rc~ ~ o~or *t~l
r -
-Itt
- Ire.1 I~Lew
c EN t AW, AN -T ROEIT
I
mi^
C-C E.N
*NEOaEA4E
rw' Ava& tL52
i&ciP*~f-4v~ '.04~b .A"~b4 a a (LA % a1PAtw
m
LI~J
r~
rw to mI f m
~,ott
mKor
V4M& a~sem ~O *4 ~ A~ ~..vii%w
CONvEN-TION AL.
MOP AIM -l 4m - Am-.
VOLCANIC
IPitI is "4M
C.,
ClQAT RNmR I
Fm z E N &I
Ilall
ou)
lim"too%& ObN40(-iP NF04 - 9OR I -a" 0% A")
fe,06n (Ioft&s
l t.) v n6tlk *
-1 & Pao,% k-, a.
*
ti r.. -nr (01
L-vt ftP4
ObAl Or. I AN)
nk
KEY
FOR PLATE
LZJ
Turassic
C
retaceous
Eoce
ne
Guate rary
Volcanic Rock
a
Plate 4. View of survey area south of Beirut.
Plate 6. Detail of bedding on shelf and slope of Tyr-Saida Bank.
6OO
300
/0 400Soo
00
600
04-
700
200
130
o
Plate 8. Slope and rise at south end of survey area.
Plate 10. Slope and rise between
Plate 11. Three-dimensional view of sediment-filled depressions beneath continental rise, between Beirut and Batroun.
Az
A 3 9do' ___________ -.--- ,TO 9Cf 21301
IIN n. . wiles 3330r' N 34*0 42'E 340 39'E c/c 028 0 kdorneters c C /3 57 F ureA
4 -I / 33*2l' N 3 5 05'EPro file AAs
E.ATST WEST 33* 54 2 'N 3 5* 03.2'E C/c 2 83 33* 57. 0 N 340 5 .1 ' E 90*
I
I 3400 N 34* 37-4'E I II I I Figure. 10: Prof ie BBzA
1 ~~~.1.0 C 0 U I, E - 1.0 'I d 4-0 I-LO I -4-d 330 54.A5' N 35" 14.7' E c/270 nk1 mniles' ''atar
i3-0- -
I0--SOUTH I I.0--0 2* 33'o-o' N 35* 41.5' E C- G NORT soUrKI ' - -
--4/oz
33034.7'N 35' 1o -7'E. 33* 27.4'N '35* 07.5'EF-Figure 11 : Protte EC 05 kiloMt4f-GrS1 0-, -SOUTH 1 0 RT H4AS
SOUTHI/
33*ZI'N 35 05'E. i.0-2-02 33*29.1 N 35ol-4 14 c/c 202 33*262'N 35* 01-3'E33*5'N
2 35*07YFFijure 14' Prolile. A.A+
0-I NORTH 2.0-33* 367'N 350 15-9'E C 2 0z F 'NORTH 0-C I. 10 |-O 33037.6N 35012 9' E c/210 3-0 --'
EIsure 13 :
Pro
:4 -u 'I I 4-S ) 1*0 d I. 4-I 4-a H 0--C/ 15-N 35*19.5' E 0-HI IEAST WEST| I~0-33' 34-7'N 3 5* 10-7'E ProI le H,G 3T C/czoa 33" L445'N 35' 23-3E H C-IEASr WESTrj c/j a I1 ,1 *." S%' E 3r 27.4'N 3 5*075'E Fic3ure 16: Profie HG, 3 33' 40-2'N 3 5' 20-2'E
Figure
8 Probiticr
1
NORTH c-kzm 33*24.5'N 35' H-O'E Fig ure 0 Hr~rr~r a SOUTk soo 3 33' 15G'N 35o07-l'E 19-- Proie HD kiIcomters 10 U, C 0 U U I', V £ 4-0 4 4--i -I-0 F- 1o--2.-0~ 0--u & 2. _ 33*32-~'N 3 o5 i-d EF goure 15:;
NORTH
VENEER OF
SEDIrMENT
ON SHELF
OF T4TR-SADA
BANK
(12.
k.c echo -SoUncing iulse 1.-to 0-. mitlisecond)Tuna 17,
1964-SOUTH
or 10 900 33*24.1 N c/c 135 35 Io-4'E 33* Z6-2'N 350o9-3' E S 14 Dst~noe r~ ~I\orne~e~-s7
0.125--o -250 - 0.375-L 4J C/1 95 3331 8'N 35' 11.'d E-C EAST - 2.0 --C/27o 33' 20 -o 11 3s- oi.5S'E 0-C, WEST 332.5' 9W 34- ss.9'E Figure 20 : Prc;ILe CC, -c -o 0 21.0 .1 2z-10-A4 NORTH-EAST -9N00
I
c/022 3321-.9'14 35*045 E I-or 2.0 3.0 D I EAST W I WEST TI N 33- I 8' 35*00-4,'E C/313 33* 15-N 35 OT I71 E.Fig9ure 21: Pro4 e D D,
A3 SOUTH-1 W EST JN* 3? 9O* 33" 16-9'H 3+ 54S'E Fi5urc
22:
Proe-ik A4A3 oHOJ
navt~4 muIS 5 kiometers s d7 60 u OU CJ - 4-2.0 -33'20-'N 3So07.5'E
Figure 23
Profe LC
o hO.UAiCJ eralhs 5 0 Oiomenters 10 I-33* 44-5N5 357'23,3'E. C/2 0 2Figure
2;4
ProfileFHi
33*25.7'N 35*09.'E £ c/202 3' '2 .900 3 o-0 \.0 Qi -- ~ 2.0-~ H, 3Y32.7 N 35'15-aE C
K
NORTH 33* 4G.7IN 35*Zo-o'E K .SOUrkI
*0 g9.03 33*33. 'N 35' 13-o'EF
gure25
-Prole KK, S NORTH --- -'k % .moo 34O77IN3 5*34.5'E 33'57 3529-.5'E.i'N
Fcure
as
ProfIle SM O 5 rkcticoils s L 1 1 1 1 I 1 11 o5 kiloet-ers to cm 'a 1.0 1.0--U I.-C a 0 -M, SOUTH|IR,. SOUT HI 2 900 1[20---g Flure 2G:
Profile
a
3
1NORTH
340 14.3'K 35' 33.S'E.Rz
Q, SOUTHI
I' 34 a-6N 3 .tEf/20
Ftiure 27:
Prof
i
le
QaQ,
34* 15 -4'N 35' 31-7'E -I- I n h1~A iAS 5 5C10- . 34*'256
CM
35' 38-l E Cf220 3.0 2.0 I -4 3.0 3.0-!4l . 66 I--R NORTH 0 1oM
3+6OO.' N
35'Z 4.G'E
c/c 202
Figure 29.
Pro4ile
MMI
U, C U, U + VI d +
-i
P90FINJORTN
SOUTNI
woo'o''i 3305To'N 35'2a2E c/zo Figure 30 Profile 33037.'N 35' 1I2.5'ErauticalM;Iges
'rm% 5 kilometers i[0-. 33'57-'N 35' n..S'E c/315 330 4-Z'N 35' 194'EP90*
-0. O0 I -z.340 -5' AW 35* 34.O' E C/2r P l Fivre 31
Pro
i eQ2
a ---- - - --- -P Co 33*53.oN 35' (8-6IE S 30 Soo N 32731.2' N 34'071.'E c/c 090 34O77'N 3 5*34 51E Figure 32. Prolile RR,S rtat#*ico-I miles S. 73 Oz1
NORT H -G o 20- 4-40 4-.0 P SOTN;j 1-0 --3-O 3336 -5'N 3 4' 18 -I'E c /z2o o 5 kloacers 1 -0- 49
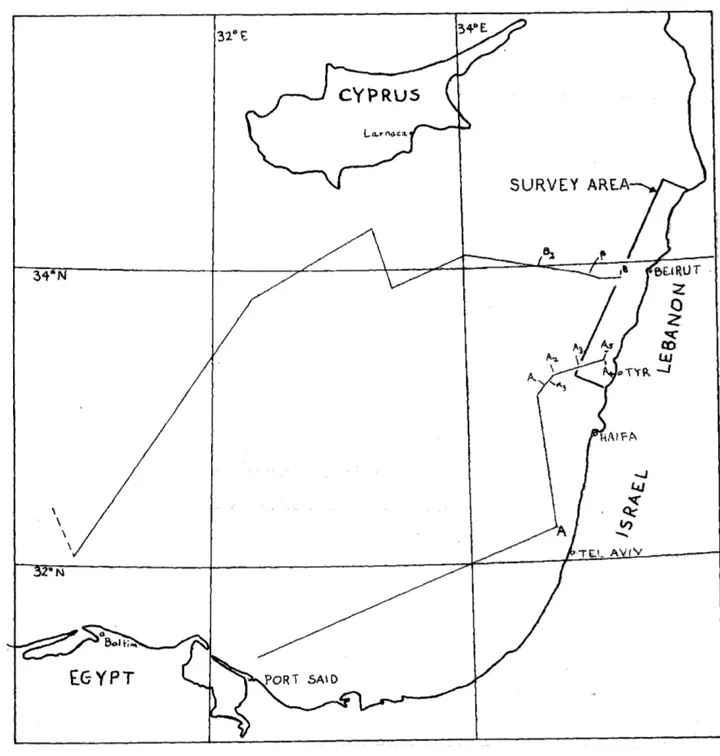
-The area which will be called the survey area is shown in Figure 7. This area includes the continental shelf., slope, and upper rise of Lebanon. Other profile lines near the survey area are shown in Figure 8
Tracings of some of the profiling results obtained south and west of the survey area (Figure 8) will be presented in order to indicate the relationship of the Lebanese continental margin to the adjacent areas of the Mediterranean.
A. RESULTS OBTAINED TO THE SOUTH AND WEST OF SURVEY AREA
1. Profile AA5 extends from a point 20 kilometers north of Tel Aviv to Tyr along the coast of Israel. A tracing of the seismic reflection records from its northern portion, Profile A1A5, is shown in Figure 9.
The three principal reflecting units which are seen along profile AA5
all appear in profile AIA5.
a) The deepest reflector, an apparently continuous acoustic interface, is found as far south as point oaL (Figure 8) where it appears at 1. 25 seconds in 650 fathoms of water. It runs horizontally until point
c4
, rises gradually 0. 25 seconds and continues horizontallyto point o43, where it disappears (Figures 8 and 9).
b) Above this reflector, a second reflector, identified by its characteristic strong reflection, is seen not only throughout the area east of Port Said but also throughout the Lebanese coast survey. South of Lebanon, the reflections seem to come from a continuous, single interface.
- 50
-In shallow water (75 meters) under an embankment 20 kilometers north of Tel Aviv (at point A), the layer lies at 0. 75 second below the sea floor and shows marked undulations: a "hill" 750 meters high is crossed in a horizontal distance of 20 kilometers. To the north, in deeper water (550 to 700 fathoms), the layer lies between 0. 5 and 0. 75 sec. below the bottom, showing slight undulations; the amplitude of the largest is 0. 125 second. Under the slope of the Tyr-Saida Bank, the layer rises to 0. 66 second under the continental slope in 300 fathoms of water (point A4).
At the same time, the acoustic character of this layer changes from that of a uniform continuous reflecting surface to that of a rough surface, characteristic of the entire Lebanese coast south of Beirut. The nature of this reflector inside the survey area, where it will be called the deep reflector, will be discussed in the next section.
c) The upper stratigraphic unit along profile AA5 is a section of gently rolling, laterally discontinuous layers. These layers form a complicated pattern: each layer fills in the depressions and laps up against the elevations of the layer beneath it. The lateral extent of
individual layers range from 0. 8 to 12. 0 kilometers. The lowest layers in this series appear to follow the topographic variations of the reflector underlying the unit. Because of the filling-in of depressions, the topo-graphic variations of the layers diminish upwards. These layers are
51
-of the reflections from an apparently continuous surface varies greatly laterally. Under an embankment 15 miles north of Tel Aviv (at point A) the thickness of the section is 1. 25 seconds in 40 fathoms of water; north-ward, in 700 fathoms of water the thickness decreases, varying between 0. 50 and 0. 75 second; finally, the section ends abruptly at point &u1
in disturbed sediment at the base of the Tyr-Saida Bank. The thickness of individual layers increases wi th depth, ranging from 0. 0 8 second to 0. 2 second.
2. Profile BB2 (Figure 10 ), oriented westward starting at a point
22. 5 kilometers west of Beirut, generally shows the same reflecting units as profile AA5. The echoes from the upper unit, a layered sequence 0. 5
seconds thick, are much weaker than those from the corresponding unit south of Tyr. The returns from the reflectors can scarcely be seen in the frequency range 15 to 50 cycles per second. In the 100 to 200 cycle
per second range, the acoustic "patchiness' seen in profile AA5 is observed.
The amplitude of the undulations of the layers is less in profile BB2'
oriented east-west, than in profile AA5, oriented north-south. This unit
overlies a continuous reflector which has the strong reflectivity of the reflector underlying the layered unit on profile AA5 This reflector rises from 0. 85 sec. below the sea floor in 900 fathoms of water at point B to
0. 5 seconds below the sea floor at point
rf
, westward of which it followsunderlie the upper continuous surface of this reflector. Eastward of point , a third deeper continuous reflector appears, 0. 1 second
below the second deepest reflector. The relationship between this third reflector and the individual reflectors below the second reflector east of ,is not clear; they may be the same reflector.
Profiles AA5 and BB2 illustrate the nature of the reflecting units
outside the Lebanese coastal survey area. The top layered unit stops at the base of the continental slope of Lebanon; a deeper reflector continues into the coastal area; the third, a deepest layer may continue into the coastal region but hints of it are seen only occasionally.
The upper two units of the reflectors seen along profiles AA and BB2, that is, the layered unit and the reflector underlying it, are also
observed along profiles extending from Port Said to Tel Aviv and along a westward extension of profile BB2 to a point 120 miles due west of
Beirut and 60 miles south of Larnaca, Cyprus. A suite of flat-lying reflectors is also seen on the Nile Delta just north of Baltim, 80 miles west of Port Said. Generally, however, west of a line
joining
Larnaca and Port Said, the layers are disturbed by folding and faulting.B. RESULTS OBTAINED INSIDE SURVEY AREA
The deepest reflecting surface inside the survey area appears everywhere along the coast of Lebanon. This interface will be called
-- 53
-the "deep reflector". South of Beirut, it has a characteristically strong echo, returned from an acoustically rough surface. The echo in some places appears to come from discrete reflectors on the surface of the deep reflector. Generally, individual reflectors are hard to identify, and the reflecting surface, although rough, appears to be continuous. The return is further confused by secondary reflections apparently coming from below the top surface of the layer: the entire wave train is often 0. 25
seconds long. These secondary echoes often appear to represent discrete reflectors, and have been shown as such on the tracings by small cres-centic arcs; they cannot be correlated into a continuous sub-surface. Part of the wave train may also be due to reverberation between the surface of the deep reflector and reflectors beneath it.
To the north of Beirut, the acoustic character of the deep reflector changes markedly. Here, the reflector is recognized by characteristic, individual crescentic echoes which represent discrete reflectors, and the
strength of the returned pulse is considerably weaker. In some places, returns from the-deep reflector are not seen between these echoes. In such cases, the dotted lines which represent the deep reflector on the tracings are intended only to infer that the crescentic echoes which they
join
belong to the same reflector. On the most seaward profiles north ofBeirut, the deep'reflector is often not seen at all, presumably because the thick sediments which overlie it absorb most of the energy from the acoustic pulse.
Despite the apparent change in the reflectivity from the deep reflector north and south of Beirut, the reflector can be followed from one area to the other.
As explained before, the discussion of the seismic profiling results inside the survey area will be organized into the divisions of continental shelf, slope, and rise.
1. Continental Shelf
Profiles cross portions of the Continental Shelf at three places, all located south of Beirut:
(1) At the Tyr-Saida Bank,
(2) At an area south of the bank, near point D (Figure 7 ),
(3) At the wide portion of the shelf south of Beirut.
It appears that similar stratigraphic units may be common to all three areas.
a.) Tyr-Saida Bank
The Tyr-Saida bank is the best-mapped area in the coastal survey. Profiles EC, FF 1 , and GG1, (Figures 11 , 12 , and 13 ) cross the
shelf of the Tyr-Saida bank, approximately parallel to its strike; profile A6A4 (Figure 14 ) crosses the seaward slope of the bank; and profiles
H1G and HG1 (F-igures i5 and 16 ) run east-west (down dip) across the
shelf and upper slope. Plates 4 , 5 , and 6 show the three-dimensional relationships of the profiles.
-On the shelf of the bank, the following stratigraphic units are recognized:
(1) The deep reflector rises under the bank from the north, south,
and west Starting from a maximum depth of 0, 725 second below the
bottom in 750 fathoms of water to the north, (Profile GG1, Figure 13 ),
and 0. 7 second below the bottom in 650 fathoms of water to the south (Profile A6A4, Figure 14), the deep reflector rises to a maximum
elevation along a line projected seaward through point Y , (Figure 7 ). (2) The deep reflector is overlain by a wedge of seaward-dipping, conformable layers, thickening seaward along profile G1H from 0. 3
second at point H to 0. 83 second at point H. These layers, sloping sea-ward under the shelf with a dip of 4. 7' (uncorrected), are truncated at a surface 12 meters below the present shelf surface and parallel to it. The separation between the four or five layers shown in the upper part of this sequence, typically 0. 025 second, is less than the resolution of the seismic profiling system, (50 milliseconds). Because the first
multiple bottom reflection masks returns from the lower part of this unit, it is not possible to determine whether the lower part of the unit is layered, or whether the unit is conformable with the deep reflector.
At the north end of the Tyr'-Saida Bank, the upper layers of this unit crop out. These sediments appear to have prograded, or built out, northward off the shelf, as the following argument will indicate. A
calculation of the velocity of sound in these layers, assuming that they
are horizontal and that their apparent downslope dip is due to the differences between the velocities of sound in seawater and in sediment (Roberson,
1964) yielded velocities between 6. 5 and 7. 0 kilometers per second. These velocities, much greater than those expected for sediments with this depth of overburden (Nafe and Drake, 1957) result from the assumption that the layers are horizontal. In fact, they do appear to possess a downslope dip which has resulted, presumably, from progration off the edge of the shelf. (The organization of this thesis suggests that it is better to include argu-ments concerning the dip of layers in this section, rather than in Chapter.4)
At the south end of profile EE 1, the upper layers of this sequence appear to have slumped toward the canyon at the south end of the bank.
On Profile A6A4, across the seaward slope of the Tyr-Saida Bank,
the upper layers in the sequence which overlies the deep reflector appear to have-been disturbed or eroded. The lower layers, which directly
over-lie the deep reflector, are thicker than the layers seen on the shelf. They may represent the seaward continuation of layers on the shelf which are not seen because they have been obscured by multiple reflections. In the
absence of a downslope pitofile from the shelf to the rise, it is hard to
correlate the layering on Profile GG1 , across the shelf, with the layering
on Profile A6A4, across the slope.
-(3) A veneer of layers having a maximum thickness of .008 sec, is seen on profile FFI with the short-pulse, 12 k. c. echo-sounder (Figure 17 ). As many as four layers are seen, apparently prograding into the canyon to the north. These layers are seen extending to depths of 300 fathoms on the upper wall of the canyon, disappearing when the slope of the sea floor reaches 7*. On the shelf of the Tyr-Saida Bank, side echoes from the deepest layer indicate that it might be rock. Buried lenses of material lie on this lowest interface. Due to a high gain setting, these layers are not seen with the echo-sounder on the adjacent profiles across the shelf, but their existence is inferred from the rather long pulse
returned from the bottom.
Farther out to sea, Profile A6A4 (Figure 14), across the slope
of the Tyr-Saida Bank, shows that the interval between the bottom and the deep reflector does not possess the finely-layered character of the
corresponding interval on the shelf. At the south end of the profile, the upper 0. 3 second of this unit consists of discontinuous, possibly disturbed,
layers. Below these layers and above the deep reflector, three continuous layers are recognized, spaced between 0. 08 and 0. 18 second apart. The total thickness of the unit above the deep reflector reaches a maximum of 0. 66 second. If layering exists in the northern part of this profile, it is obscured by side echoes.
-b.) Wide Part of Shelf Opposite Damour
Profile J2JJ1 (Figure 18 and Plate 7
)
shows a portion of theshelf and upper slope at a wide portion of the shelf south of Beirut. Profile JJ1 runs north-south along the strike of the shelf; profile J2J runs
down-slope at the north end of profile J J.
On the shelf, a stratigraphic unit 0. 35 second thick overlying the deep reflector is similar in its finely-layered character to the corresponding
sedimentary unit on the Tyr-Saida Bank. This unit may actually represent two or more sequences, as the layers in the upper 0. 13 second of the unit are not conformable with the layers below them. Because the
echo-sounder was inoperative in this area, it is not known whether the veneer of layers found on the shelf of the Tyr-Saida Bank also exists here.
An attempt to calculate velocities of sound in the layers which appeared to crop out at the south end of profile JJI, assuming that these layers are horizontal, indicated that the average velocity of sound in the unit lies between 2. 5 and 3. 0 kilometers per second. This figure seems slightly high, but not unreasonable for sediments with this depth of over-burden (Nafe and Drake, 1957), indicating that these layers may be nearly
horizontal.
Under the slope, the deep reflector descends in two steps. The over-lying unit pinches. out downslope. Sever al layers in the upper part
of the unit appear to crop out in the upper part of the slope, between 230 - 58
-and 300 fathoms below the apparent shelf-slope break. At the bottom of the slope, the deep reflector crops out.
c.) Continental Shelf Opposite Tyr
On a portion of the continental shelf, at the south end of profile HD (Figure 19 )., a stratigraphic unit having fine layering similar to that on the Tyr-Saida Bank overlies the deep reflector. This unit differs from
similar units seen on other parts of the shelf because it is thinner,
(0. 075 second) and is apparently conformable with the deep reflector. Echo sounding records reveal that a layer . 0025 second thick overlies the stratified unit.
2. Continental Slope
Those portions of the continental slope which have not already been
described previously in connection with the shelf sediments will be
discussed here. The sediments overlying the deep reflector on the slope appear to fall into recognizable groups.
a.) Slope Opposite Tyr
At the south end of the survey profiles CC1 and DD, (Figures 20
and 21 ; Plate 8 ) run downslope from near the shelf-slope break to the continental rise, Profile A4A3 crosses the sediments at the base of the
slope, and intersects profiles CC1 and DD1.
-Under the slope, the deep reflector descends seaward with an uncorrected slope of 6* from the shelf-slope break to the base of the slope, beyond which it is almost horizontal. On profile DD1, one of the
few indications of a reflecting interface below the "deep reflector" is
observed. This strong reflector is defined by a series of crescentic echoes, It appears at 0. 15 second below the deep reflector in 575 fathoms of water at the base of the slope, rises parallel to the deep reflector for 1. 0 second, and is lost in multiple bottom reflections.
A wedge of material thickening from 0. 3 sec. near the top of the slope to 0. 75 second at the base overlies the deep reflector. On profile
CC 1, this interval shows little, if any, layering; on profile DD1, patches
of material reflect sound. Except possibly for the lowest layer, no obvious stratification appears in this wedge. It is possible, however, that the reflecting patches represent some sort of discontinuous layering.
Seaward of the base of the continental slope, the sediments on the slope are replaced by material peculiar to the continental rise. This material will be described in the next section.
b.) Slopes in Rugged Canyon-Eroded Areas
Profiles which cross rugged, canyon-eroded parts of the continental shelf and slope, were made in three areas:
(1) Just south of the Tyr-Saida Bank, - 60
-returns from the deep reflector are partially masked by side echoes, this - 61
-(2) North of this bank to Damour,
(3) At the north end of the survey, between Batroun and Tripoli. Area 1 is represented by profiles HD and LC (Figures 19 and 23 Plate 5 ); area 2 is represented by profiles JH and KKl, (Figures 24
and 25 ; Plate 9 ); and area 3 by profiles RR 2 and Q3Q1 (Figures 26 and 27 ; Plate 10 ). The profiles in the first two areas are approximately parallel to the strike of the slope. The north ends of the profiles in the third area are closer to the shore than the south ends, so that the sea floor rises toward the north.
In all these profiles, the interval between the bottom and the deep reflector is largely without reflections; that is, it is nearly transparent. In the two more southern areas and on the shoreward side of the northern
areas, the apparent lack of layering in this interval may not be real, since the record is crowded wi th side- echoes from hilly topography in the region. On the more seaward profile in the northern area, however, the interval overlying the deep reflector is clearly transparent.
c. ) Continental Slope Between Beirut and Batroun
Profile SM1 extends across the strike of the continental slope
between Beirut and Batroun. On the slope, the deep reflector forms depressions whose depths range between 0. 4 and 0. 88 second. As the
- 62
-reflector can be recognized only by its characteristic individual echoes, which are joined by dotted lines on the tracing.
The depressions are apparently filled with sediments. The southern-most and deepest depression contains a series of nearly-horizontal, con-formable layers, spaced typically 0. 06 second apart. There are too many side echoes obscuring the returns from the other depressions to determine if there. are similarly layered sediments in them.
3. Continental Rise
In the survey area, nearshore profiles cross the continental rise in the area at the south end of the survey and along a line extending
southward to Damour from a point 10 kilometers north of Beirut. A long profile, farther offshore, extends from Tripoli to the Tyr-Saida Bank.
The areas of the rise south of the Tyr-Saida Bank and between Beirut and the Tyr-Saida Bank will be described here.
a.) Continental Rise Opposite Tyr
At the base of the slope, along profiles DD and CC (Figures 21 and 20
),
and along profile A4A3 (Figure 22), a wedge of material0. 75 second thick, overlies the deep reflector. This unit, in which
random discrete reflectors are seen is interpreted as being composed of disturbed sediments. This wedge separates the disturbed slope material from the layered reflectors to the south and west of the survey area. Plate 8 shows the relationship between profiles DD1 and A4A3'