HAL Id: hal-02274982
https://hal.inria.fr/hal-02274982
Submitted on 30 Aug 2019
HAL is a multi-disciplinary open access
archive for the deposit and dissemination of
sci-entific research documents, whether they are
pub-lished or not. The documents may come from
teaching and research institutions in France or
abroad, or from public or private research centers.
L’archive ouverte pluridisciplinaire HAL, est
destinée au dépôt et à la diffusion de documents
scientifiques de niveau recherche, publiés ou non,
émanant des établissements d’enseignement et de
recherche français ou étrangers, des laboratoires
publics ou privés.
Increasing life science resources re-usability using
Semantic Web technologies
Marine Louarn, Fabrice Chatonnet, Xavier Garnier, Thierry Fest, Anne
Siegel, Olivier Dameron
To cite this version:
Marine Louarn, Fabrice Chatonnet, Xavier Garnier, Thierry Fest, Anne Siegel, et al.. Increasing life
science resources re-usability using Semantic Web technologies. eScience 2019 - 15th International
eScience Conference, Sep 2019, San Diego, United States. pp.1-9. �hal-02274982�
Increasing life science resources re-usability using
Semantic Web technologies
Marine Louarn*
MICMAC - UMR S1236 & IRISA INSERM & Univ Rennes, Inria, CNRS, IRISA
Rennes, France [email protected]
Fabrice Chatonnet*
MICMAC - UMR S1236
INSERM, Univ Rennes, CHU Rennes, EFS Rennes, France
Xavier Garnier
IRISA
Univ Rennes, Inria, CNRS, IRISA Rennes, France
Thierry Fest
MICMAC - UMR S1236
INSERM, Univ Rennes, CHU Rennes, EFS Rennes, France
Anne Siegel
IRISA
Univ Rennes, Inria, CNRS, IRISA Rennes, France
Olivier Dameron
IRISA
Univ Rennes, Inria, CNRS, IRISA Rennes, France
* These authors contributed equally to this paper
Abstract—In life sciences, current standardization and integra-tion efforts are directed towards reference data and knowledge bases. However, original studies results are generally provided in non standardized and specific formats. In addition, the only formalization of analysis pipelines is often limited to textual descriptions in the method sections. Both factors impair the results reproducibility, their maintenance and their reuse for advancing other studies. Semantic Web technologies have proven their efficiency for facilitating the integration and reuse of reference data and knowledge bases.
We thus hypothesize that Semantic Web technologies also fa-cilitate reproducibility and reuse of life sciences studies involving pipelines that compute associations between entities according to intermediary relations and dependencies.
In order to assess this hypothesis, we considered a case-study in systems biology (http://regulatorycircuits.org), which provides tissue-specific regulatory interaction networks to elucidate per-turbations across complex diseases. Our approach consisted in surveying the complete set of provided supplementary files to reveal the underlying structure between the biological entities de-scribed in the data. We relied on this structure and used Semantic Web technologies (i) to integrate the Regulatory Circuits data, and (ii) to formalize the analysis pipeline as SPARQL queries.
Our result was a 335,429,988 triples dataset on which two SPARQL queries were sufficient to extract each single tissue-specific regulatory network.
Index Terms—Semantic Web, bioinformatics, SPARQL, repro-ducibility of results
I. INTRODUCTION
There are more than 1500 life science databases, each able to answer important questions in a particular domain [1]. Most of them offer a dedicated repository for expert knowledge but they fail at structuring biological datasets [2]. Indeed, the classical data management technologies used by the life science community range from data storage in the form of multiple tabulated files analyzed with spreadsheets, silo models in complex database management systems with a predetermined scheme of federated data such as Intermine [3]
or Biomart [4], to ad-hoc community centralized models such as in bio-imaging communities. These solutions address imme-diate integration requirements but they are poorly compatible with scalable and flexible integration needs, either between communities (for example to jointly analyze medical imaging and genomics data) or with the world of linked data to enrich analyses with symbolic knowledge selected in a fine and contextual way in existing databases.
An alternative approach for structuring and analyzing het-erogeneous datasets and knowledge bases is based on the Se-mantic Web technologies. They are an extension of the current Web that provides an infrastructure for integrating data and metadata in order to support unified reasoning and querying as a virtual unified dataset [5]. This approach has been widely adopted by the life science community for releasing reference data and knowledge bases [6], [7] in RDF triplestores. Thanks to the growth of linked data, supported by the Linked Open Data initiative (LOD) [8], more and more reference data and knowledge bases are integrated. Moreover, it also evolved into the FAIR principles for ensuring that the available data are Findable, Accessible, Interoperable and Reusable [9]–[12]. A bottleneck for a broader adoption of these technologies by the life science community is a technical barrier: a complete analysis scheme based on Semantic Web technologies requires users first to prepare their data according to a RDF framework to make them exploitable, and second to become familiar with the SPARQL language either for querying their own RDF data, or for analyzing them in relation with the other triplestores of the LOD. A second barrier is given by the concept of “pipeline” and workflow which is widely used in life sciences: data analysis of large-scale data consists of score computation chains involving several files to produce final results. A classical example of such an analysis pipeline is given by the Regulatory Circuits [13] project (http:// regulatorycircuits.org), which consists of several analyses on heterogeneous and
multi-layer “omics” data on human patient cells from many tissues. The output of the Regulatory Circuits study is a family of scored tissue-specific regulatory interaction networks that can be explored through text files. The method used to obtain this output is described in supplementary materials. The associated computational scripts and algorithms are limited to the consid-ered dataset. Moreover, feedback from the Regulatory Circuits’ authors was limited when solicited about the methodology. This has a huge impact on i) the reproducibility of the results, ii) their maintenance as they will need to be updated when newer or additional data sources are released and iii) their reuse for advancing other studies (which was the reason these results were generated in the first place). In addition, the output format makes it impossible to explore and enrich the data by combining them to additional knowledge on entities stored in LOD public databases.
In this article, we introduce an approach based on Semantic Web technologies to revisit the analysis workflow performed in the Regulatory Circuits study. We propose an RDF rep-resentation of the unstructured data files in order to exhibit links (triples) between biological products associated with standardized identifiers in the dataset. Based on this RDF representation of the dataset, we show that the output of the Regulatory Circuits study can be obtained by two SPARQL queries. The article is organized as follows. Section II details the application field of cellular regulation in life sciences and the main international projects producing reference datasets in this field. Section III describes our approach for structuring and integrating the Regulatory Circuits datasets: relevant files identification, data structuring, data integration, query con-struction. Section IV is a discussion and a conclusion about our approach benefits and limitations.
II. BACKGROUND
In biological sciences, gene regulation (also called tran-scriptional regulation) is a major field of investigation. It allows a better understanding of major processes such as cell differentiation (how to obtain one or several effective cell types from a common progenitor cell), cell identity (how gene expression is used to define a specific cell type) and cell transformation (how altered gene expression can lead to cell death or cancer). To understand gene expression regulation in a specific context, one needs to perform diverse types of whole genome spanning experiments, currently made available by the recent advent of high throughput sequencing. However, these experiments usually produce huge amounts of data which are heterogeneous by nature, not well organized, not well structured, and not linked to other data or to reference knowledge.
To construct gene regulation networks, one has to associate target genes with their potential regulators, so-called transcrip-tion factors (TF). At the DNA level, a TF will bind to a definite sequence (called a binding motif) in a specific regulatory region, which should be in an opened 3D conformation to allow the regulation (Fig. 1), and which can be located close or far from its target gene. This binding event will then
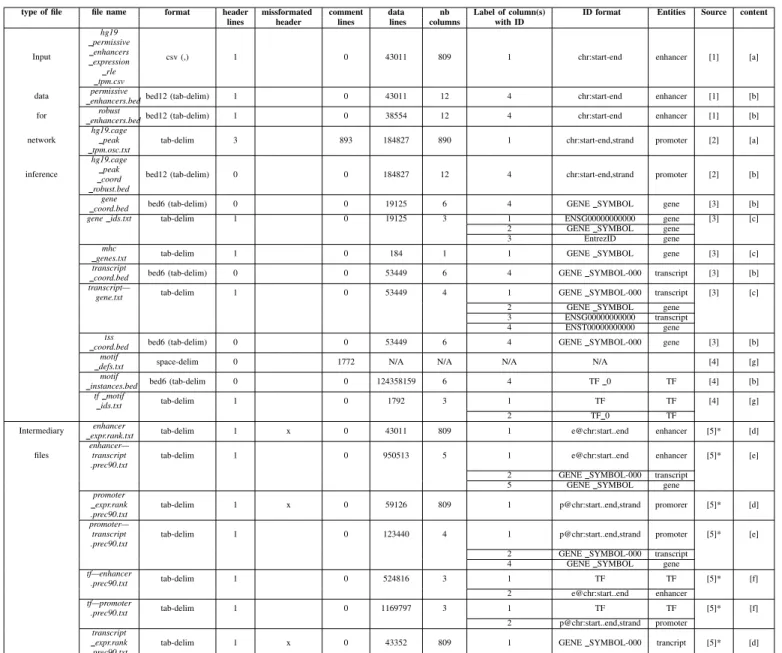
initiate a cascade of molecular events eventually leading to regulation (induction or inhibition) of the target gene expres-sion. Researchers in life sciences and in bioinformatics use huge amounts of data to build extensive regulatory networks from these different entities (genes, TF, regulatory regions), mainly by statistical and machine learning methods. This has been the case with data integration performed on the recent releases of massive databases from the ENCODE [14] [15], FANTOM5 [16] [17] and RoadMap Epigenomics [18] [19] consortia. These data are usually released as primary raw datasets, usable processed data or compiled networks but with few possibilities for adding easily new links between the data or for re-using the published bioinformatics pipelines. Consequently, those datasets have no or low compliance to the FAIR guidelines [10]. ENCODE data for example have only been published as ontologies [20], processed data together with scripts used to obtain them, or unlinked datasets. Although part of FANTOM5 has been released under the RDF format, it only concerns gene expressions and not regulatory data [16], [21]. One of the most recent example was the deep exploitation of the FANTOM5 datasets to establish 394 cell-type specific regulatory networks [13]. Contrasting with previous attempts, these networks were not derived from a statistical analysis of biological measurements but based on a set of computed correlations between regulatory regions, gene expression, and curated and scored TF binding sites. Datasets were published either as input (raw data) or intermediary (authors-processed) data files, in the form of tabulation or comma-delimited data files with various format and contents (see Table I). That dataset of regulatory networks is amongst the most recent and the most complete. They are therefore of great potential interest for the community, so we decided to transform the study original data and results to make them more easily available and usable. To this end, we identified the useful data, we structured them according to a schema supporting the network building task and integrated them in order to be able to query them. Query results could then be interpreted as the Regulatory Circuits cell-type specific networks.
III. CONTRIBUTION
Semantic Web technologies provide the infrastructure for integrating, combining with knowledge bases and querying data. They have been successfully applied on reference data, that are arguably the most prone to be reused. We have seen that this requirement also applies to research results, such as the ones from the Regulatory Circuits study. There are some ongoing efforts in the neuroimaging community to use Semantic Web technology for sharing and reusing datasets [22], but these are not directly applicable to our situation.
By structuring and integrating the data from Regulatory Circuits we were aiming at efficiently recovering the TF-gene relationships computed in the original work. We also wanted to make the data structure easily extendable to new data for the users. To do so, a requirement was to identify all the necessary entities from the published datasets (files) and the relevant
steps of the pipeline necessary for deriving the relations between genes and transcription factors. We reused the rank values for the expression measures because the Regulatory Circuits’ method section does not specify how to compute them, as well as the distance values between enhancers and transcripts. We computed the other elements.
A. Identifying relevant files among all Regulatory Circuits resources
The first step of data structuring was the identification of all the necessary files from Regulatory Circuits (available from the supplementary archive file at http://regulatorycircuits.org), including raw data (input) and pre-processed (intermediary) files, to recreate the published pipeline. Table I presents a review of the supplementary files in Regulatory Circuits, including the number of headers and comment lines, the entity names, and their format. Regulatory Circuits files also contained the computed networks, available on the download tab of their website under the Networks category. FAN-TOM5 individual networks.tar contained 394 tissues-specific networks and Network compendium.zip contained 32 high-level networks and 40 public ones. We did not use those to construct our model.
On the 21 files present in Table I, fourteen were input files and seven were intermediary ones. The dataset was composed of text files of various size ranging from 184 to 124,358,159 lines and from 3 columns to 890. This lead to large files which were complex to explore and made retrieving specific infor-mation difficult. For example the file hg19.cage peak OK.txt was just over 1.1GB.
These files had heterogeneous structures of headers and entities identifiers. 5 files had no header and one had 3 header lines. 3 of the files with headers were mis-formatted (en-hancer expr.rank.txt, promoter expr.rank.prec90.txt and tran-script expr.rank.prec90.txt). They had an offset of 1 between the number of columns in the header versus in the data, which forced us to retrieve the data of the (n+1)th column to get the information related to the nth element. This contributeed to the complexity of navigating those files. One file also had 800 comment lines above file header and one (motif defs.txt) which contained only comments and non-formatted text.
To increase the difficulty of links retrieval between the files, the entity identifiers were not homogeneous across the dataset. For example, the promoter regions had an identifier sometimes following the pattern: chr:start-end,strand and some other times following: p@chr:start..end,strand (with chr being the chromosome on which is the region and start and end are its chromosomal locations). Samples names also differed across files headers. The most common denomination was the libld identifier based on CN hs + nb where nb is a five digit integer (e.g.: CNhs11051), but in hg19 permissive enhancers expression rle tpm.csv the sample name were cellT ype + donor + nb : libld with cellT ype either only the cell line or the cell line and the localization (example: Adipocyte - breast donor1 : CNhs11051). In hg19.cage peak coord robust.bed
this identifier were tpm.Adipocyte%20-%20breast%2c%20donor1.CN hs11051.11376 − 118A8.
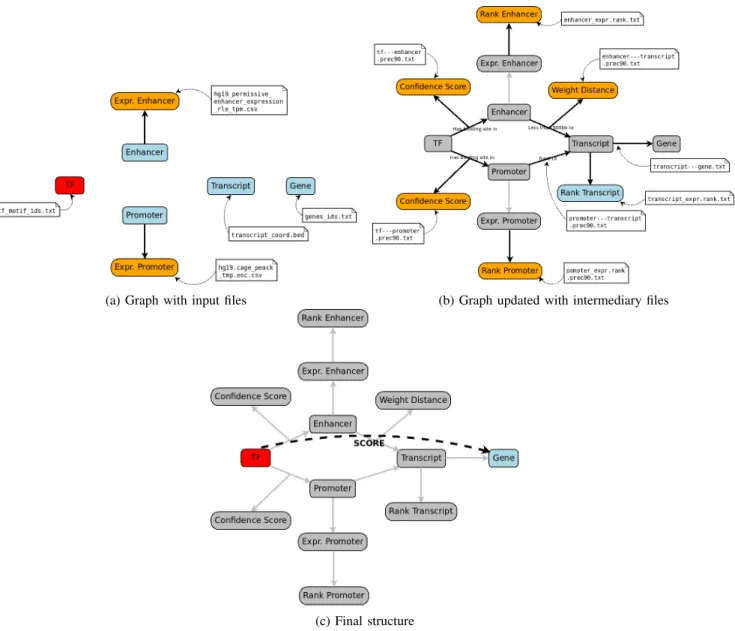
To identify which files were necessary to rebuild the reg-ulation networks, we mapped the entities and files on the biological background (see section II) as shown in Figure 1.
Fig. 1: Underlying biological background used to infer TF-gene relationships by the Regulatory circuits pipeline. TF can interact with enhancers or promoters binding sites. Regulatory Circuits original files containing the necessary entities and relations are also represented.
For the attributes linked to entities, only elements that improved the recovery of entities by users were kept, such as: binding sites motif for transcription factors, ENSEMBL identifiers for genes and transcripts and DNA strands on which promoters are located.
B. Structuration
Once we identified all the files, entities and relations required to build TF-genes interactions, we structured their content. To do so, we first placed the entities in a graph as shown in Figure 2a. The only attributes given at this step were the expression levels of enhancers and promoters.
Second, we retrieved the relationships given in the Reg-ulatory Circuits data. For those, we used the pre-computed distances between the transcripts and the regulatory regions (enhancers and promoters), as well as the weight of the transcripts-enhancer distances. We also kept all the pre-processed confidence scores for the transcription factors / regions interactions. In the Regulatory Circuits article, the authors used a rank normalization of their expressions data in the final pipeline, so we used their intermediary files including these ranks for the enhancers and promoters expressions. We also kept the file including the rank for the transcript. All these interactions are described in Figure 2b.
Third, the structure built from all these data and their interactions allowed us to easily retrieve the TF-gene rela-tionships by navigating through the entities and their relations (Figure 2c).
C. Integration
Once the data had been structured, we integrated them so that they can be browsed and queried. To do so, we unified the identifiers and explicited the links between the entities.
We created a new set of rules to homogenize the enti-ties identifiers across files ni order to facilitate integration.
TABLE I: Regulatory Circuits files’ review
type of file file name format header missformated comment data nb Label of column(s) ID format Entities Source content lines header lines lines columns with ID
Input hg19 permissive enhancers expression rle tpm.csv
csv (,) 1 0 43011 809 1 chr:start-end enhancer [1] [a] data permissiveenhancers.bed bed12 (tab-delim) 1 0 43011 12 4 chr:start-end enhancer [1] [b] for enhancers.bedrobust bed12 (tab-delim) 1 0 38554 12 4 chr:start-end enhancer [1] [b] network
hg19.cage peak tpm.osc.txt
tab-delim 3 893 184827 890 1 chr:start-end,strand promoter [2] [a] inference
hg19.cage peak coord robust.bed
bed12 (tab-delim) 0 0 184827 12 4 chr:start-end,strand promoter [2] [b] gene
coord.bed bed6 (tab-delim) 0 0 19125 6 4 GENE SYMBOL gene [3] [b] gene ids.txt tab-delim 1 0 19125 3 1 ENSG00000000000 gene [3] [c]
2 GENE SYMBOL gene 3 EntrezID gene mhc
genes.txt tab-delim 1 0 184 1 1 GENE SYMBOL gene [3] [c] transcript
coord.bed bed6 (tab-delim) 0 0 53449 6 4 GENE SYMBOL-000 transcript [3] [b] transcript—
gene.txt tab-delim 1 0 53449 4 1 GENE SYMBOL-000 transcript [3] [c] 2 GENE SYMBOL gene
3 ENSG00000000000 transcript 4 ENST00000000000 gene tss
coord.bed bed6 (tab-delim) 0 0 53449 6 4 GENE SYMBOL-000 gene [3] [b] motif
defs.txt space-delim 0 1772 N/A N/A N/A N/A [4] [g] motif
instances.bed bed6 (tab-delim 0 0 124358159 6 4 TF 0 TF [4] [b] tf motif
ids.txt tab-delim 1 0 1792 3 1 TF TF [4] [g]
2 TF 0 TF
Intermediary expr.rank.txtenhancer tab-delim 1 x 0 43011 809 1 e@chr:start..end enhancer [5]* [d] files
enhancer— transcript .prec90.txt
tab-delim 1 0 950513 5 1 e@chr:start..end enhancer [5]* [e] 2 GENE SYMBOL-000 transcript
5 GENE SYMBOL gene promoter
expr.rank .prec90.txt
tab-delim 1 x 0 59126 809 1 p@chr:start..end,strand promorer [5]* [d] promoter—
transcript .prec90.txt
tab-delim 1 0 123440 4 1 p@chr:start..end,strand promoter [5]* [e] 2 GENE SYMBOL-000 transcript
4 GENE SYMBOL gene tf—enhancer .prec90.txt tab-delim 1 0 524816 3 1 TF TF [5]* [f] 2 e@chr:start..end enhancer tf—promoter .prec90.txt tab-delim 1 0 1169797 3 1 TF TF [5]* [f] 2 p@chr:start..end,strand promoter transcript expr.rank .prec90.txt
tab-delim 1 x 0 43352 809 1 GENE SYMBOL-000 trancript [5]* [d]
[1]http://enhancer.binf.ku.dk/Pre-defined tracks.html, [2] http://fantom.gsc.riken.jp/5/datafiles/latest/extra/CAGE peaks/, [3] Ensembl biomart, [4]Pouya Kheradpour (pouyak <a> mit.edu), [5]* Regulatory Circuits: auto produced, [a] Normalized activities,[b] Genomic coordinates,[c] Identifier, [d] Rank of
normalized activities,[e] Distances, [f] Confidence score, [g] TF motifs
Regions identifiers were created using the following pattern: r chrX start end, r being the first letter of the region type (e for enhancer or p for promoter), X the chromosome number for the region and start and end its chromosomal coordinates. For the expression, we chose to keep the libld identifier (CN hs+nb with nb a five digit integer) of the tissues samples as name and added Rank before this identifier for the ranks score of the same samples. Genes, transcripts and TF retained their original identifiers.
When a relation involved more than two entities or had some attributes, we used reification and represented the relation as an additional entity. The identifier for the reified relation was defined as name1 name2 nb with name1 the type of the first
entity in the link, name2 the second type and nb a unique integer. The reified relation was then associated to the entities and attributes using regular binary relations (for example in Figure 2b, notice that the relation from a TF to a Promoter had a confidence score (conf idence); this ternary relation was represented by the tf promoter entity in the RDF model in Figure 3 which associated a TF, a Promoter and a confidence).
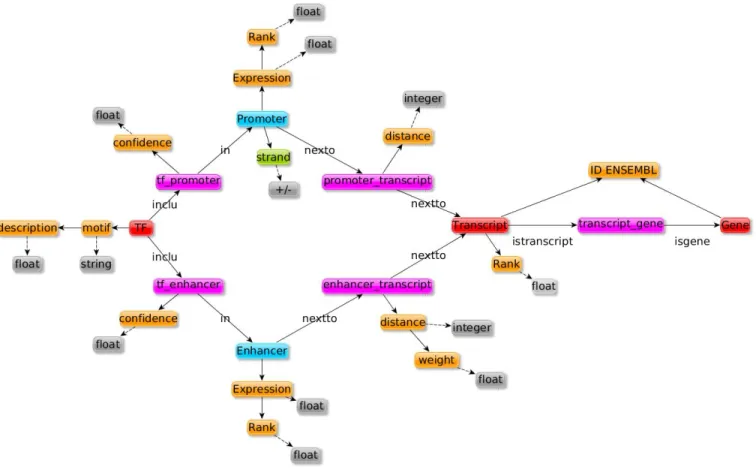
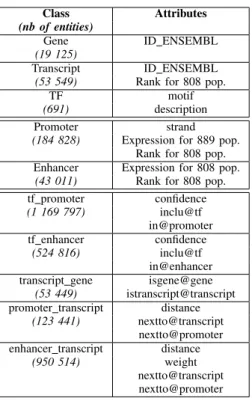
We created a RDF graph of the dataset using Regulatory Circuits data and new entities for representing reified relation-ships, as shown in Figure 3. The description of entities classes, numbers and attributes in each node can be found in Table II. We integrated these data using RDF and deployed them as
(a) Graph with input files (b) Graph updated with intermediary files
(c) Final structure
Fig. 2: The three steps of data structuring, with identification of the files containing the needed information. In (a) identification of input files. In this step we mostly import entities (genes, TF, regulatory regions). The only imported relation is the expression levels of both types of regulatory regions.
In (b) we added all the information from the intermediary files: interactions between the different elements and scores based on those relations. We also added pre-processed scores on the expression levels, called Ranks.
In (c) we can see that the TF-gene relations were obtained by following the links between entities and that these relations could be weighted using the score from step (b).
a SPARQL endpoint using OpenLink Virtuoso engine.* As
shown in Table III, we integrated ten classes representing more than three hundred million triples. To do so, we had to separate some of the files in smaller ones resulting in a total of forty-four integrated files.
The description of the dataset population can be seen in Figure 3b and Tables II and III: over three million entities, separated in ten classes, each with several attributes.
*The RDF dataset can be retrieved from https:// regulatorycircuits-rdf.
genouest.org/ dump/ and the SPARQL endpoint is accessible at https:// regulatorycircuits-rdf.genouest.org/ sparql
D. Queries
After integrating all the data, we could query the dataset in order to retrieve the TF-gene relationships for each cell type or tissue. According to Regulatory Circuits there are two ways of getting the transcription factor and gene relationship: using either type of regulatory regions (enhancers or promoters). The first step consisted in computing all the potential TF-gene relations.
The first query used the promoter as the binding region for the TF: starting from the TF, and continuing by the promoter, the transcript and then the gene. To confirm the existence of
Fig. 3: Data structure after integration. Nodes in red are gene entities, nodes in blue are regulatory region entities and nodes in pink are reified relations. Genomic localization attributes are indicated in green, other attributes are in orange and attributes type are in gray. Details about the number of entities for each nodes can be found in Table II.
this relation, we needed to verify that the TF confidence score and the promoter expression rank were both different from 0.
PREFIX user:
<http://www.semanticweb.org/user/ontologies/2018/1#>
PREFIX askomics:
<http://www.semanticweb.org/askomics/ontologies/2018/1#>
PREFIX rdf: <http://www.w3.org/1999/02/22-rdf-syntax-ns#>
SELECT DISTINCT ?tf1 ?gene1
WHERE {
?tf1 rdf:type user:tf.
?tf_promoter1 rdf:type user:tf_promoter.
?tf_promoter1 askomics:confidence ?confidence1.
FILTER ( ?confidence1 > 0 ).
?promoter1 rdf:type user:promoter.
?promoter1 askomics:Rank_CNhs12017 ?Rank_CNhs12017P.
FILTER ( ?Rank_CNhs12017P > 0 ).
?promoter_transcript1 rdf:type user:promoter_transcript.
?transcript1 rdf:type user:transcript.
?transcript_gene1 rdf:type user:transcript_gene.
?gene1 rdf:type user:gene.
?tf_promoter1 askomics:inclu ?tf1.
?tf_promoter1 askomics:in ?promoter1.
?promoter_transcript1 askomics:nextto ?promoter1.
?promoter_transcript1 askomics:nextto ?transcript1.
?transcript_gene1 askomics:istranscript ?transcript1.
?transcript_gene1 askomics:isgene ?gene1. }
ORDER BY ?tf1 ?gene1
The second query was similar but used the enhancer instead of the promoter: we started from the TF, and proceeded following the enhancer, the transcript and then the gene,
making sure that all score component were superior to 0.
PREFIX user:
<http://www.semanticweb.org/user/ontologies/2018/1#>
PREFIX askomics:
<http://www.semanticweb.org/askomics/ontologies/2018/1#>
PREFIX rdf: <http://www.w3.org/1999/02/22-rdf-syntax-ns#>
SELECT DISTINCT ?tf1 ?gene1
WHERE {
?tf1 rdf:type user:tf.
?tf_enhancer1rdf:type user:tf_enhancer.
?tf_enhancer1askomics:confidence ?confidence1.
FILTER ( ?confidence1 > 0 ).
?enhancer1 rdf:type user:enhancer.
?enhancer1 askomics:Rank_CNhs12017 ?Rank_CNhs12017E.
FILTER( ?Rank_CNhs12017E > 0 ).
?enhancer_transcript1 rdf:type user:enhancer_transcript.
?enhancer_transcript1 askomics:weight ?weight1.
FILTER( ?weight1 > 0 ).
?transcript1 rdf:type user:transcript.
?transcript1 askomics:CNhs12017 ?CNhs12017T.
FILTER( ?CNhs12017T > 0 ).
?transcript_gene1rdf:type user:transcript_gene.
?gene1rdf:type user:gene.
?tf_enhancer1askomics:inclu ?tf1.
?tf_enhancer1askomics:in ?enhancer1.
?enhancer_transcript1 askomics:nextto ?enhancer1.
?enhancer_transcript1 askomics:nextto ?transcript1.
?transcript_gene1askomics:istranscript ?transcript1.
?transcript_gene1askomics:isgene ?gene1. }
TABLE II: Data population. The first three lines correspond to the nodes in red in Figure 3, the next two correspond to the blue nodes and the last five to the pink ones.
Class Attributes
(nb of entities)
Gene ID ENSEMBL
(19 125)
Transcript ID ENSEMBL
(53 549) Rank for 808 pop.
TF motif
(691) description
Promoter strand
(184 828) Expression for 889 pop. Rank for 808 pop. Enhancer Expression for 808 pop. (43 011) Rank for 808 pop. tf promoter confidence (1 169 797) inclu@tf in@promoter tf enhancer confidence (524 816) inclu@tf in@enhancer transcript gene isgene@gene
(53 449) istranscript@transcript promoter transcript distance
(123 441) nextto@transcript nextto@promoter enhancer transcript distance
(950 514) weight
nextto@transcript nextto@promoter
TABLE III: Integrated data
Number of elements Triples 335 429 988 Entities 3 226 341
Classes 10
Datasets 53
In the final Regulatory Circuits network, all the TF-gene relations were qualified by a score (cf. Figure 2c). This score was the maximum of all the TF-gene relations scores obtained through either promoters (bottom part of Figure 2c) or enhancers (top part of Figure 2c). The intermediate score through a promoter was Conf idence Score × Rank promoter. The intermediate score through an enhancer was Conf idence Score × W eight Distance × p(Rank transcript × Rank enhancer) where Rank transcript is the max of the transcript promoters ranks. PREFIX user: <http://www.semanticweb.org/user/ontologies/2018/1#> PREFIX askomics: <http://www.semanticweb.org/askomics/ontologies/2018/1#> PREFIX rdf: <http://www.w3.org/1999/02/22-rdf-syntax-ns#> PREFIX xsd: <http://www.w3.org/2001/XMLSchema#>
SELECT DISTINCT ?tf1 ?gene1 (max(xsd:float(?confidence1) *
xsd:float(?confidence1) * xsd:float(?Rank_CNhs12017P) *
xsd:float(?Rank_CNhs12017P)) AS?weightP)
WHERE {
?tf1 rdf:type user:tf.
?tf_promoter1 rdf:type user:tf_promoter.
?tf_promoter1askomics:confidence ?confidence1.
FILTER( ?confidence1 > 0 ).
?promoter1 rdf:type user:promoter.
?promoter1 askomics:Rank_CNhs12017 ?Rank_CNhs12017P.
FILTER( ?Rank_CNhs12017P > 0 ).
?promoter_transcript1 rdf:type user:promoter_transcript.
?transcript1 rdf:type user:transcript.
?transcript_gene1rdf:type user:transcript_gene.
?gene1rdf:type user:gene.
?tf_promoter1askomics:inclu ?tf1.
?tf_promoter1askomics:in ?promoter1.
?promoter_transcript1 askomics:nextto ?promoter1.
?promoter_transcript1 askomics:nextto ?transcript1.
?transcript_gene1askomics:istranscript ?transcript1.
?transcript_gene1askomics:isgene ?gene1. }
GROUP BY ?tf1 ?gene1
ORDER BY ?tf1 ?gene1
With our structured data we could extend our queries to compute the intermediate promoter and enhancer-related scores. SPARQL queries do not support square root, but could easily be devised to compute the square of the previously presented scores. For enhancers, although we could have written queries that compute Rank transcript on the fly (and recompute it for each transcript every time a promoter is considered), we took advantage of the intermediary files where Rank transcript values were already provided, and added these pre-computed Rank transcript values to our RDF model. The resulting query for computing the score could then use directly the Conf idence Score × W eight Distance × p(Rank transcript × Rank enhancer) formula.
PREFIX user: <http://www.semanticweb.org/user/ontologies/2018/1#> PREFIX askomics: <http://www.semanticweb.org/askomics/ontologies/2018/1#> PREFIX xsd: <http://www.w3.org/2001/XMLSchema#> PREFIX rdf: <http://www.w3.org/1999/02/22-rdf-syntax-ns#>
SELECT DISTINCT ?tf1 ?gene1 (max(xsd:float(?confidence1) *
xsd:float(?confidence1) * xsd:float(?weight1)*
xsd:float(?weight1) * xsd:float(?CNhs12017T) *
xsd:float(?Rank_CNhs12017E) ) AS ?weightE)
WHERE {
?tf1 rdf:type user:tf.
?tf_enhancer1rdf:type user:tf_enhancer.
?tf_enhancer1askomics:confidence ?confidence1.
FILTER( ?confidence1 > 0 ).
?enhancer1 rdf:type user:enhancer.
?enhancer1 askomics:Rank_CNhs12017 ?Rank_CNhs12017E.
FILTER( ?Rank_CNhs12017E > 0 ).
?enhancer_transcript1 rdf:type user:enhancer_transcript.
?enhancer_transcript1 askomics:weight ?weight1.
FILTER( ?weight1 > 0 ).
?transcript1 rdf:type user:transcript.
?transcript1 askomics:CNhs12017 ?CNhs12017T.
FILTER( ?CNhs12017T > 0 ).
?transcript_gene1rdf:type user:transcript_gene.
?gene1rdf:type user:gene.
?tf_enhancer1askomics:inclu ?tf1.
?tf_enhancer1askomics:in ?enhancer1.
?enhancer_transcript1 askomics:nextto ?enhancer1.
?enhancer_transcript1 askomics:nextto ?transcript1.
?transcript_gene1askomics:istranscript ?transcript1.
?transcript_gene1askomics:isgene ?gene1. }
GROUP BY ?tf1 ?gene1
ORDER BY ?tf1 ?gene1
We then computed the score for TF-gene relations as the square root of the maximum of both the promoter and enhancer queries.
Overall, the complete Regulatory Circuits pipeline produc-ing both TF-gene relations and their associated scores could be
performed by 2 SPARQL queries. Theses queries were rather simple and involved 7 kinds of entities and 6 relations.
All queries in this section were based on the CNhs12017 sample of Regulatory Circuits and can be extended to other tissues by changing the sample name in the queries. The full list of tissue samples and their descriptions is given in the supplementary data file nmeth.3799-S2.xlsx from Regulatory Circuits†. A sub-list of samples names is given in Table IV in the following section.
E. Performances
Performance-wise, Table IV shows that all queries times ranged from 4.49 seconds for the fastest and 537.32 seconds (9 minutes) for the longest. On the 3.232 queries (4 queries for each 808 samples) only 124 had an execution time over 90 seconds. Each of the 4 queries have been performed on the 808 different samples of the dataset. This have been automated by using the python SPARQLwrapper library and feeding it the list of all different sample names.
TABLE IV: Queries’ execution time (in seconds) for some of the 808 samples. They were run on the SPARQL end-point https:// regulatorycircuits-rdf.genouest.org/ sparql. The means are over the 808 samples.
Queries for TF-relation based on: (in seconds) Sample Promoters Enhancers Promoters Enhancers
name all > 0 all > 0 & Score & Score
CNhs12017 19.310 16.359 31.319 20.515 CNhs13465 18.062 50.649 28.630 70.771 CNhs10629 23.631 20.755 37.505 27.434 CNhs11750 16.519 5.437 26.650 6.915 CNhs13195 16.138 26.339 28.377 38.867 CNhs13492 18.159 44.711 25.378 66.119 CNhs11771 22.666 13.026 30.768 16.451 CNhs12347 17.099 9.029 28.260 11.861 CNhs11047 21.361 35.926 35.727 49.122 CNhs12075 17.775 10.570 26.353 12.648 CNhs13099 16.105 9.275 24.457 12.225 CNhs12569 20.792 15.234 32.980 19.403 CNhs10636 28.768 51.718 42.956 75.017 CNhs11869 19.686 14.204 29.645 19.136 ... ... ... ... ... Fastest 12.064 4.487 18.054 4.734 Slowest 148.232 329.655 217.806 537.319 Mean 27.189 32.060 42.500 43.798
We chose to have two distinct queries to retrieve TF-gene relations score, and to process their results to keep the maximal score instead of an unique query which would result in longer execution time.
IV. DISCUSSION
Our approach consisted in structuring the data and results of a systems biology study as a RDF dataset. Our experience was that reusing the 21 raw and intermediary files from Regulatory Circuits required an in-depth analysis of their structure and of the documentation. We produced a RDF
†https://media.nature.com/original/nature-assets/nmeth/journal/v13/n4/
extref/nmeth.3799-S2.xlsx
model (Figure 3) of Regulatory Circuits that provides a unified access to their networks which are currently spread in 394 cell types and tissue-specific files, statically grouped into 32 high-level regulatory networks. This RDF model saves future users from having to manually reproduce the integration effort. Our results showed that once the relations and ranks had been pre-computed, the Regulatory Circuits analysis pipeline could be formalized as two SPARQL queries. We argue that this unified RDF dataset makes querying and reuse in other studies easier. Even if the structure of our RDF model (Figure 3) is fairly simple, the Regulatory Circuits dataset is rather large (more than 300 millions triples, cf. Table III). Despite the size, SPARQL querying performances were of a few seconds (Table IV).
The Regulatory Circuits pipeline relies on raw data as well as external resources such as Ensembl that are regularly updated. To accomodate these updates, the original Regulatory Circuit data structure requires to update some raw files, regenerate the intermediary files that depend on them and run the pipeline. With our approach, these third-party updates can easily be propagated to our RDF model by running the SPARQL queries.
The RDF version of Regulatory Circuits allows a fine-grained exploration of the relations between entities (tran-scription factors, enhancers, promoters, transcripts and genes) involved in regulation mechanisms. For example, it allows to differentiate the relations involving enhancers from the ones involving promoters (e.g. for taking into account that promoters relations are more reliable). Similarly, it allows to differentiate between the binding motifs of a single transcrip-tion factor or to consider transcriptranscrip-tion factors from a specific family that usually share similar binding site motifs.
The RDF version of Regulatory Circuits can also be ex-tended with user-specific data, which increases flexibility. For example, if users have expression data of additional tissues, a new set of regulatory regions or binding data for an undescribed transcription factor, they can update the current model to add their new data. Depending on the type of data it may require pre-processing, to fit with Regulatory Circuits current dataset. Users can also import new data not present in the current data structure by following the rules described in Section III. This will require to extend the RDF graph (Figure 3), which is straightforward in RDF.
Following the Linked Data approach, we used the En-sembl identifiers for genes and transcripts. Federated SPARQL queries can then be used to combine information for Regula-tory Circuits with information from Ensembl (e.g. variants, associations with diseases, or annotations).
Our approach is rather generic and should be easily trans-posed to other studies than Regulatory Circuits for which the analysis pipeline follows relations and performs sim-ple arithmetic functions, such as parts of the ENCODE or Roadmap Epigenomics databases. More in-depth analyses (e.g. statistical) are beyond SPARQL expressivity and should be addressed by pre-processing.
V. CONCLUSION
Life Science current standardization and integration efforts increasingly rely on Semantic Web technologies. They are currently directed towards reference data and knowledge bases. We hypothesized that applying the same approach to orig-inal studies would improve the results reproducibility, their maintenance and their reuse for advancing other studies. We considered the Regulatory Circuits case-study. We surveyed the 394 original data files and proposed an unified RDF data model. We showed that the Regulatory Circuits analysis pipeline can be formalized as two SPARQL queries and that the performances were acceptable. Overall, this unified RDF dataset makes querying and reuse in other studies easier.
ACKNOWLEDGMENT
Marine Louarn is supported by a joint INSERM-INRIA “Digital Health” PhD grant.
We acknowledge the GenOuest bioinformatics core facil-ity (https://www.genouest.org) for providing the computing infrastructure.
REFERENCES
[1] M. Y. Galperin, D. J. Rigden, and X. M. Fern´andez-Su´arez, “The 2015 nucleic acids research database issue and molecular biology database collection,” Nucleic acids research, vol. 43, no. D1, pp. D1–D5, 2015. [2] L. D. Stein, “Integrating biological databases,” Nature Reviews Genetics,
vol. 4, no. 5, p. 337, 2003.
[3] A. Kalderimis, R. Lyne, D. Butano, S. Contrino, M. Lyne, J. Heimbach et al., “InterMine: extensive web services for modern biology,” Nucleic Acids Res., vol. 42, no. Web Server issue, pp. W468–472, Jul 2014. [4] D. Smedley, S. Haider, S. Durinck, L. Pandini, P. Provero, J. Allen
et al., “The BioMart community portal: an innovative alternative to large, centralized data repositories,” Nucleic Acids Res., vol. 43, no. W1, pp. W589–598, Jul 2015.
[5] T. Berners-Lee and J. Hendler, “Publishing on the semantic web,” Nature, vol. 410, no. 6832, pp. 1023–1024, Apr 2001.
[6] P. L. Whetzel, N. F. Noy, N. H. Shah, P. R. Alexander, C. Nyulas, T. Tudorache, and M. A. Musen, “BioPortal: enhanced functionality via new web services from the national center for biomedical ontology to access and use ontologies in software applications,” Nucleic acids research, vol. 39, no. Web Server issue, pp. W541–W545, 2011. [7] S. Jupp, J. Malone, J. Bolleman, M. Brandizi, M. Davies, L. Garcia
et al., “The EBI RDF platform: linked open data for the life sciences,” Bioinformatics, vol. 30, no. 9, pp. 1338–1339, May 2014.
[8] C. Bizer, T. Heath, and T. Berners Lee, “Linked data–the story so far,” International Journal on Semantic Web and Information Systems, vol. 5, no. 3, pp. 1–22, 2009.
[9] K. M. Livingston, M. Bada, L. E. Hunter, and K. Verspoor, “Represent-ing annotation compositionality and provenance for the semantic web,” Journal of biomedical semantics, vol. 4, p. 38, 2013.
[10] M. D. Wilkinson, M. Dumontier, I. J. J. Aalbersberg, G. Appleton, M. Axton, A. Baak et al., “The fair guiding principles for scientific data management and stewardship,” Scientific data, vol. 3, p. 160018, 2016.
[11] A. Rodr´ıguez-Iglesias, A. Rodr´ıguez-Gonz´alez, A. G. Irvine, A. Sesma, M. Urban, K. E. Hammond-Kosack, and M. D. Wilkinson, “Publishing fair data: An exemplar methodology utilizing phi-base,” Frontiers in plant science, vol. 7, p. 641, 2016.
[12] M. Brandizi, A. Singh, C. Rawlings, and K. Hassani-Pak, “Towards FAIRer biological knowledge networks using a hybrid linked data and graph database approach,” Journal of integrative bioinformatics, vol. 15, no. 3, 2018, in press.
[13] D. Marbach, D. Lamparter, G. Quon, M. Kellis, Z. Kutalik, and S. Bergmann, “Tissue-specific regulatory circuits reveal variable modular perturbations across complex diseases,” Nature methods, vol. 13, no. 4, p. 366, 2016.
[14] E. P. Consortium et al., “An integrated encyclopedia of dna elements in the human genome,” Nature, vol. 489, no. 7414, p. 57, 2012. [15] M. B. Gerstein, A. Kundaje, M. Hariharan, S. G. Landt, K.-K. Yan,
C. Cheng et al., “Architecture of the human regulatory network derived from encode data,” Nature, vol. 489, no. 7414, p. 91, 2012.
[16] M. Lizio, J. Harshbarger, H. Shimoji, J. Severin, T. Kasukawa, S. Sahin et al., “Gateways to the fantom5 promoter level mammalian expression atlas,” Genome biology, vol. 16, no. 1, p. 22, 2015.
[17] R. Andersson, C. Gebhard, I. Miguel-Escalada, I. Hoof, J. Bornholdt, M. Boyd et al., “An atlas of active enhancers across human cell types and tissues,” Nature, vol. 507, no. 7493, p. 455, 2014.
[18] M. Skipper, A. Eccleston, N. Gray, T. Heemels, N. Le Bot, B. Marte, and U. Weiss, “Presenting the epigenome roadmap,” Nature, vol. 518, p. 313, 2015.
[19] A. Kundaje, W. Meuleman, J. Ernst, M. Bilenky, A. Yen, A. Heravi-Moussavi et al., “Integrative analysis of 111 reference human epigenomes,” Nature, vol. 518, no. 7539, p. 317, 2015.
[20] V. S. Malladi, D. T. Erickson, N. R. Podduturi, L. D. Rowe, E. T. Chan, J. M. Davidson et al., “Ontology application and use at the encode dcc,” Database, vol. 2015, 2015.
[21] I. Abugessaisa, H. Shimoji, S. Sahin, A. Kondo, J. Harshbarger, M. Lizio et al., “Fantom5 transcriptome catalog of cellular states based on semantic mediawiki,” Database, vol. 2016, 2016.
[22] C. Maumet, T. Auer, A. Bowring, G. Chen, S. Das, G. Flandin et al., “Sharing brain mapping statistical results with the neuroimaging data model,” Scientific data, vol. 3, p. 160102, 2016.