Cross-Channel Predictive Analytics for Retail
Distribution Decisions
by
James B. Coles
B.S., Electrical Engineering, University of California San Diego (2008) M.S., Electrical Engineering, University of California San Diego (2009)
Submitted to the MIT Sloan School of Management and MIT Institute for Data, Systems and Society in partial fulfillment of the requirements for the degrees of
Master of Business Administration and
Master of Science in Engineering Systems
in conjunction with the Leaders for Global Operations Program at the
MASSACHUSETTS INSTITUTE OF TECHNOLOGY
June 2017
C
James B. Coles, MMXVII. All rights reserved.The author hereby grants to MIT permission to reproduce and to distribute publicly paper and electronic copies of this thesis document in whole or in part in any medium now known or hereafter created.
Author ...
e
...MIT Sloan School of Management and MI Institute for Data, Systems and Society
May 12, 2017
Certified by...
Si
William
Sic
Certified by... ...
Accepted by...
Sig
Accepted by ...
Signature
nature.redacted.
Georgia Perakis, Thesis Supervisor F. Pounds Professor of Management Science MIT Sloan School of Management
nature redacted
...
.
.
.
.
.
.
.
.
.
.
.
.
.
.
.
.
.
.
...
Bruce Cameron, Thesis Supervisor Director, MIT System Architecture Lab MIT System Design and Management
nature
redacted
...
...
Maur a Herson Director, MBA Program MIT Sloan School of Management
red.acted ...
John N. Tsitsiklis
Clarence J. Lebel Professor of Electrical Engineering MIT Institute for Data, Systems and Society Graduate Officer
MASSACHUSEUS INSTITUTE
OFTECHNOLOGY co
w
Cross-Channel Predictive Analytics for Retail Distribution
Decisions
by
James B. Coles
Submitted to the MIT Sloan School of Management and MIT Institute for Data, Systems and Society
on May 12, 2017, in partial fulfillment of the requirements for the degrees of Master of Business Administration
and
Master of Science in Engineering Systems
Abstract
Distribution demand forecasting at Zara currently considers historical sales of products modi-fied by expert knowledge inputs in an algorithm developed to calculate the shipment required to meet demand for the next sales period. In 2010, the introduction of Zara.com provided customers an additional channel to complete purchases and interact with the brand while providing Zara significant insight into changing customer preferences to supplement the ex-pert knowledge of the Zara team.
This thesis investigates the utility of the data collected in the online sales channel for increasing the accuracy of the distribution demand forecasts. Two forecast types are con-sidered: Initial Shipments for which no historical data exists, and Replenishment Ship-ments which have historical data. Forecasts are performed for both brick-and-mortar and e-commerce sales channels to demonstrate cross-channel utility of the data. The study presents a review of available datasets to identify those of potential interest and describes meaningful features engineered from raw datasets. By applying machine learning algorithms, signifi-cant features are identified and a predictive model is developed demonstrating signifisignifi-cant WMAPE improvement for initial shipments to brick-and-mortar stores ( 0.23), moderate improvement for replenishment shipments to e-commerce ( 0.05) and limited improvement for replenishments to brick-and-mortar stores (<0.04). The results of this study demonstrate the potential for significant reduction of inventory requirements to maintain customer service levels and provides a baseline for future cross-channel forecasting work.
Thesis Supervisor: Georgia Perakis
Title: William F. Pounds Professor of Management Science
Thesis Supervisor: Bruce Cameron
Acknowledgments
The months I spent as part of the Zara team at the headquarters in A Corufia were a highlight of my experience in the LGO program at MIT. I'm filled with gratitude for the longstanding partnership between MIT and Inditex and the opportunity that the LGO program allowed me to engage in. This work is the result of the collective efforts of so many people.
Thank you Zara Distribuci6n team for adopting me as part of the family. My project supervisors Ane Insausti Altuna, Jose Luis Gofii and Ivin Escudero Rial were there from the beginning, introducing me to the world of fashion and providing advice whenever I needed it. Alberte Dapena Mora, you answered all of my questions twice and taught me everything I know about distribution and forecasting. Rocio, David, Lorena, Marcos, Leticia, Begofia, Susan, Ana, Pepa, Eva, Patricia, Laura, Carolina, Juan, Sergio, Egowitz, Miguel and Javier thank you all so much for sharing and teaching me about your fabulous work.
Thank you .com team, you introduced me to the cool new world inside Zara. Thank you to Fernando Talin Marifio and Ruben Botana Saavedra for being my .com guides. Jose Manuel Corredoira Corras and Javier Martinez Roldan, you taught me to use your databases, saved me when things made no sense, and made this project work. David, Juan Albuin, Juan Villacampa, Mateo, Olaia, Guillermo, and Miriam, thanks for helping to ease me in and sharing time with me to learn the inner workings of .com.
Thank you to my support at MIT. With regular check-ins, visit, ideas and support, my advisor Georgia Perakis not only kept me focused and on track but encouraged me to finish. Bruce Cameron provided the voice of experience and provided me with the perspective to consider the full context of my work. Lennart Baardman and Divya Singhvi, you helped keep me sane while lost in algorithms and gave me hope that there are good things to come. Thank you Spanish familia. Alberte, Rocio, Javi, Mateo, Yunchi, Kyoko, Rita, Xiaowen, Aya, Mari, Joyce, Alex, Carlos, Emil, Sarah, Jasmine, Cat, Andres, Ana, Gabriel, Mateo, Javi and Ainoa. I miss you and our lunches. My card is sitting on my desk as I write.
Thank you family. Mom and Dad for visiting and leaving Mom with me. I will treasure our time in Galicia. Sharon, my wife for supporting me while I was away, exploring my new home with me, and loving me through fun times and hanger.
THIS PAGE INTENTIONALLY LEFT BLANK
Contents
1 Introduction 15 1.1 Project Motivation . . . . 16 1.1.1 Demand Forecasting . . . . 16 1.2 Project Approach . . . . 18 1.3 Thesis Contributions . . . . 18 1.4 Thesis Overview . . . . 19 2 Literature Review 21 2.1 Prior MIT Thesis Work . . . . 212.2 Retail Fashion Demand Forecasting . . . . 22
2.3 Data Analytics in E-commerce . . . . 23
2.4 Omni-Channel Demand Studies . . . . 23
2.5 M IT 12 . . . . 23
3 Background 25 3.1 Zara Organization. . . . . 25
3.1.1 Zara.com . . . . 26
3.1.2 Zara Distribution and Operations . . . . 26
3.2 Key Stakeholders . . . . 26
3.3 Product Classification . . . . ... . . . . 27
3.4 Distribution Demand Forecasting . . . . 28
3.4.1 Demand Forecasting Overview . . . . 29
3.4.3 Demand Forecast Calculations . . . . 30
3.4.4 Inventory Shipment Calculation . . . . 32
4 Methodology 35 4.1 Data Analysis . . . . 35 4.1.1 Business Objective . . . . 36 4.1.2 Data Collection . . . . 36 4.1.3 Feature Engineering . . . . 36 4.1.4 Modeling . . . . 36 4.1.5 Model Evaluation . . . . 37 4.1.6 Deployment . . . . 37 4.2 Data Sources . . . . 37 5 Data Collection 39 5.1 Data Identification . . . . 39 5.1.1 Process Research . . . . 39 5.1.2 Brick-and-Mortar Stores . . . . 40 5.1.3 Zara.com Experience . . . . 41 5.2 Dataset Availability . . . . 44 5.2.1 Distribution Datasets . . . . 45 5.2.2 E-Commerce Datasets . . . . 46 5.2.3 Supplemental Datasets . . . . 46 6 Feature Engineering 49 6.1 Data Filtering and Cleaning . . . . 49
6.1.1 Filtering Parameters . . . . 49 6.1.2 Data Cleaning . . . . 51 6.2 Feature Construction . . . . 51 6.2.1 Notation . . . . 52 6.2.2 Article Features . . . . 52 6.2.3 Location Features . . . . 53 8
6.2.4 6.2.5 6.2.6
Temporal Features . . . . . Website Structure Features . Customer Behavior Features
7 Modeling
7.1 Modeling Approach .... ... 7.2 Data Pre-Processing ... ...
7.2.1 Feature Reduction . . . . 7.3 Modeling Algorithms . . . . 7.3.1 Initial Feature Investigations . . . . 7.3.2 Algorithm Selection . . . . 7.3.3 Model Adjustments and Prediction Modifications 7.3.4 Model Construction and Testing . . . . 7.3.5 Coverage Measurement . . . .
8 Results Analysis
8.1 Prediction Error . . . . 8.1.1 Initial Products . . . . 8.1.2 Replenishment Products . . . . 8.1.3 OLS Linear Model Performance Comparison . . . 8.2 Distribution Inventory Effects . . . . 8.2.1 Initial Products . . . . 8.2.2 Replenishment Products . . . .
9 Conclusions and Recommendations 9.1 Summary of Results . . . . 9.2 Recommendations . . . . 9.2.1 Implementation . . . . 9.2.2 Future Investigations . . 9.3 Conclusion . . . . 53 54 56 59 . . . . 59 . . . . 60 . . . . 61 . . . . 64 . . . . 64 . . . . 64 . . . . 67 . . . . 67 . . . . 67 71 . . . . 71 . . . . 72 . . . . 74 . . . . 78 . . . . 79 . . . . 79 . . . . 80 85 . . . . 85 . . . . 86 . . . . 86 . . . . 87 . . . . 89
THIS PAGE INTENTIONALLY LEFT BLANK
List of Figures
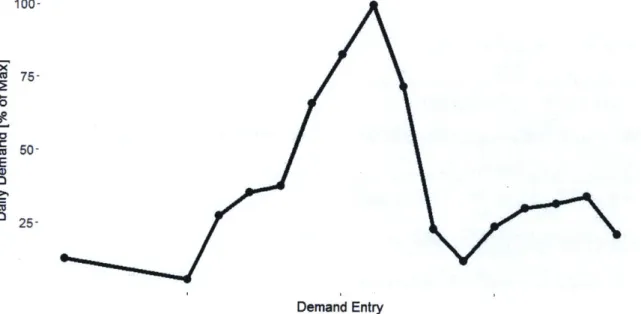
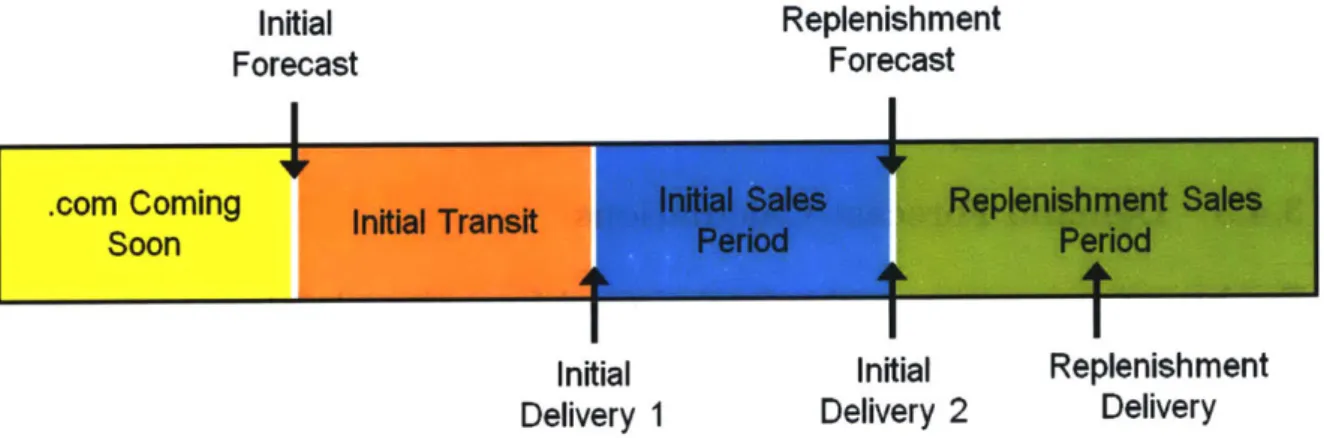
3-1 An example of demand levels for a single MCC in a single location. The y-axis is normalized to present a percent of maximum article, location demand. . . 28 3-2 The current demand forecasting timeline for new and replenishment product
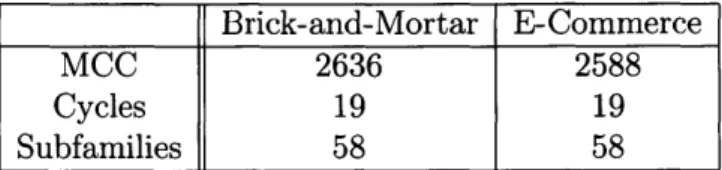
shipments in the physical and e-commerce sales channels . . . . 29 4-1 The data analysis process adapted from CRISP-DM . . . . 35 5-1 An example website layout of the Zara.com storefront with navigation tree,
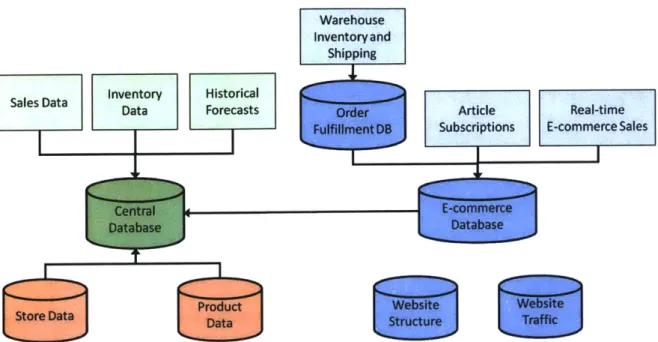
search bar and filter options . . . . 42 5-2 An example product details page with coming soon indicators . . . . 43 5-3 A representative database map depicting the available databases and selected
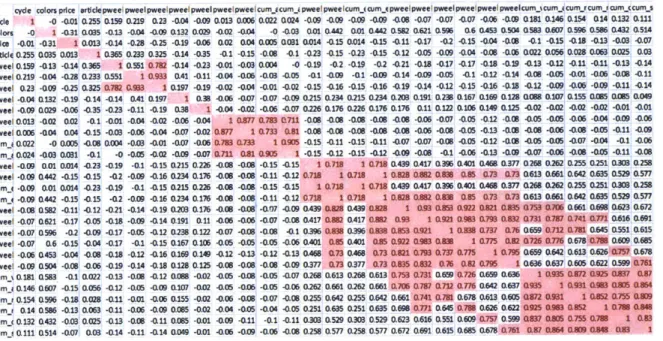
tables of datasets contained in the database. Connections are shown with directional arrows, no arrow means there is no direct connection. . . . . 45 7-1 The correlation matrix for the training set of a single replenishment feature
set. Red highlighted entries represent cross-correlations greater than 0.7 and were flagged for possible removal. . . . . 63 7-2 Example tuning of the value of m to produce minimum out-of-bag error in
the training dataset. . . . . 66 8-1 Forecasting error for baseline and updated models against actual Vm for a
subset of test entries. . . . . 73 8-2 Forecasting error for baseline and updated models against actual Vm for a
8-3 Forecasting error for baseline and updated models against actual Vm for a subset of test entries for zara.com. . . . . 76 8-4 The distribution of forecast error ratios used to calculate the coverage required
for brick-and-mortar stores. . . . . 82 8-5 The distribution of forecast error ratios used to calculate the coverage required
for Zara.com fulfillment centers. . . . . 83
12
List of Tables
6.1 Summary of available data for initial shipment analysis. . . . . 51 6.2 Summary of available data for replenishment shipment analysis. MCC
rep-resents the number of articles available, Dates or cycles are the number of distinct forecast dates or periods, and Subfamilies is the number of subfami-lies represented by the articles . . . . 51 7.1 Percentage of applicable initial shipment data entries after forecast type
fil-tering for valid website and subscription data. . . . . 61 7.2 Percentage of applicable replenishment shipment data entries after forecast
type filtering for valid website and subscription data. . . . . 61 7.3 Example frequency ratio calculation for Days New (Prior Week) . . . . 62
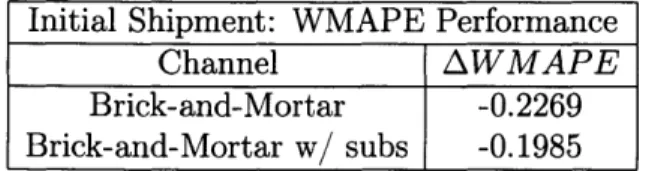
7.4 Initial shipment demand forecast WMAPE improvements with and without subscriptions . . . . 66 8.1 Initial shipment demand forecast WMAPE improvements with and without
subscriptions . . . . 72 8.2 Initial shipment feature importance rankings for brick-and-mortar stores. . . 74 8.3 Replenishment shipment demand forecast WMAPE improvements with and
without subscriptions . . . . 75 8.4 Initial shipment feature importance rankings for brick-and-mortar stores. . . 77 8.5 Initial shipment feature importance rankings for Zara.com forecasts. . . . . . 78 8.6 Initial shipment demand forecast comparison using an OLS linear model and
8.7 Replenishment shipment demand forecast comparison using an OLS linear model and an random forest algorithm. . . . . 79 8.8 Initial shipment relative coverage measurement and improvement across all
stores in the selected market. . . . . 80 8.9 Initial shipment calculated average shipments and improvement across all
stores in the selected market. . . . . 80 8.10 Replenishment shipment relative coverage measurement improvement across
all stores in the selected market. . . . . 80 8.11 Replenishment shipment calculated average shipments improvement across all
stores in the selected market. . . . . 81
14
Chapter 1
Introduction
Zara is the flagship brand of the Spanish headquartered Inditex group, the largest global fashion retailer with over 7,000 stores across 88 markets amongst 8 different brands. The Zara brand itself operates more than 2,000 stores and accounts for over 65% of net sales for the group. This footprint continues to grow; Zara introduced a net of 77 new stores in 2015 and is currently present in over 27 online markets through the e-commerce channel Zara.com
[11.
Zara operates using a business model offering about 9,000 new articles every season delivered to stores twice a week. This model encourages frequent customer engagement with the brick-and-mortar and online stores to discover the latest designs available. This engagement is further encouraged by the fact that Zara does not utilize traditional marketing methods to advertise new products but relies on high visibility storefronts and online presence to showcase new products.
Zara customers are provided the latest fashion trends at affordable prices thanks to Zara's agile supply chain and inventory distribution processes. By maintaining a high level of awareness to the fast changing trends and demand preferences of its customers, Zara is able to deliver inventory to the right locations at the right time to fulfill customer needs while minimizing excess inventory costs. This ability is a critical component of success in an industry that operates on such a fast pace as fashion.
1.1
Project Motivation
The introduction of the e-commerce sales channel in 2010 at Zara.com created the opportu-nity for Zara to learn more about customers and to respond even faster to changing trends. As consumers increasingly embrace e-commerce to supply their fashion demand, the level of customer engagement at Zara.com has continued to grow. The datasets that are collected through the normal course of e-commerce operations provide the Zara.com team with great insight into the changing needs of their customers. By identifying the ways that this data can help to inform the processes across the entire organization, significant opportunities for organizational operations improvement can be identified.
The goal of this work is two-fold. First, it provides a critical initial look at the utility and availability of the datasets collected by the e-commerce group at Zara.com to the broader Zara organization. In the absence of traditional marketing campaigns, this data provides critical insights into Zara's customers and their preferences. An analysis of the datasets available to the various teams across the organization in an effort to increase information sharing and availability allowed a number of potential applications of the combined databases to be identified.
Additionally, this project describes a first investigation into the cross-channel effects between operations in the e-commerce and brick-and-mortar domains of Zara's retail opera-tions. Focused on improving the customer demand forecast for articles across both channels, this effort combines the available e-commerce datasets with the existing demand forecasting process to create an updated model for predicting article sales.
1.1.1
Demand Forecasting
An essential strategic advantage in Zara's retail model is an accurate prediction of customer demand. In an ideal case, the retailer knows exactly how many units will be sold in a given location at a given time and have just enough inventory to fill those sales. In reality, retailers do not know exactly how many units will be 'sold, and must optimize the amount of inventory shipped based on a prediction of future sales and the certainty of that prediction. The generation of this prediction is called demand forecasting. Increasing the expected accuracy
of the forecast reduces the expected error of the number of units shipped versus the number of units actually demanded. By reducing this uncertainty, retailers can continue to meet customer demand with the same service level while minimizing the additional inventory sent to cover possible prediction error.
Traditional Demand Forecasting
For many traditional brick-and-mortar retailers including Zara, demand forecasting is typi-cally performed using a historical average of sales data. This data is often supplemented by the knowledge of sales associates and management that interact with customers to develop a better understanding of customer trends and customer reactions to current products. This information is then combined through linear regression or another statistical analysis tools to develop a description of the past sales and the expected change in sales based on the
historical trend modified by the expert knowledge of the store employees.
E-commerce retailers have additional tools to predict future sales of items. In addition to the traditional historical sales data used in brick-and-mortar stores, e-commerce websites monitor traffic through the pages of the website in an effort to improve the user experience. An additional benefit of this data is the insight it lends to the navigation of a customer through the store. This data is similar to what a traditional brick-and-mortar store would have if they tracked the movements of every customer from the time they entered until the time they exited the store. What e-commerce retailers gain in raw data, however, they lose in the personal knowledge and understanding of a customer developed through the interaction of employees in the brick-and-mortar stores.
Multi-Channel Demand Forecasting Potential
Multi-channel retailers operate in multiple retail channels simultaneously. For example, Zara operates both brick-and-mortar and e-commerce retail sales channels. The network of brick-and-mortar stores provides Zara with significant personal interaction with customers and allows for the commercial teams to develop a deep understanding of the preferences of those customers. Similarly, the e-commerce sales channel increases Zara's accessible market size by reaching customers not near a physical Zara location while allowing the company
to collect website traffic data to better understand customer preferences and trends. While each channel offers clear benefits alone, the potential benefit of combining the advantages to inform each other is an area of particular interest.
To effectively use both sets of information together, the multi-channel retailer must un-derstand the implications of each dataset on the other in a study of cross-channel demand effects. Through careful analysis of data between sales channels, retailers stand to better understand the customer needs while streamlining internal processes, and maximizing the number of customers served.
1.2
Project Approach
The proposed investigation was divided into two significant phases of Research and Analysis to address the two primary goals. The research phase included an investigation of the current demand forecasting and inventory distribution processes used by Zara's distribution team. Additionally, research included a preliminary survey of the datasets currently available across the Zara organization and the level of access available to each stakeholder.
The analysis phase of the project focused on interpreting the data collected to inform company operations. This process collected the identified datasets, aggregated and trans-formed the raw data into meaningful features, and developed predictive models to explain the trends observed. These models were then tested to demonstrate applicability to both sales channels and demonstrate the utility of the datasets for predicting customer demand.
1.3
Thesis Contributions
The contributions of this thesis focus on applying machine learning techniques to the demand forecasting process for multi-channel retailers. In particular, the cross-channel effects be-tween e-commerce and brick-and-mortar retail channels are demonstrated using the demand forecasting process. A random forest model is presented that incorporates cross-channel data to significantly improve demand forecast accuracy. Finally, a baseline feature set is defined
for future study of cross-channel effects and demand forecasting.
Primarily, this work develops a random forest model to demonstrate the utility of e-commerce data to supplement traditional demand forecasting techniques. Two specific de-mand forecasting processes are defined corresponding to two distinct product types: new products with no historical sales data and replenishment products with at least one week of historical sales data. Each process is investigated comparing the performance of models in-corporating e-commerce data with the current (baseline) forecasting model. This work shows that, with sufficient training data, a random forest model incorporating e-commerce data provides a significant advantage compared to current processes focused on historical sales. Absolute WMAPE improvement of 0.23 was observed for new article forecasts in brick-and-mortar stores, while improvements up to 0.06 were observed for replenishment shipments of existing articles in the e-commerce channel.
In support of the model development effort, a significant portion of the thesis work fo-cused on data collection. Specifically, the identification of available datasets in the structure of a multi-channel retail operation and incorporating these datasets across database bound-aries into a single, interpretable feature set. The result of this effort is a feature set that provides a framework for prioritized data collection in the e-commerce channel with a focus on optimizing utility for demand forecasting. The minimum required feature set is identified which will form the baseline for future studies involving additional datasets of interest.
1.4
Thesis Overview
This thesis is organized in chapters to facilitate ease of review according to the following outline:
Chapter 1 Introduces the project, the business motivation for the investigation performed, and the structure of the document.
Chapter 2 Reviews relevant literature as it applies to this investigation including previous work performed in partnership between Zara and MIT LGO.
Chapter 3 Develops the context of the project including a background of Zara and the fashion industry it operates in. The chapter also provides background descriptions of
the processes involved in the distribution operations for e-commerce and brick-and-mortar stores.
Chapter 4 Describes the detailed methodology used to identify and analyze the datasets in the study.
Chapter 5 Identifies the sources of data identified and analyzed in the investigation and describes their significance to the work.
Chapter 6 Documents the feature engineering process, transforming raw datasets into use-ful features to be interpreted by a model. The calculation of the features, rationale behind their use, and the resulting feature vectors and feature set is described in this chapter.
Chapter 7 Explains the modeling process used to create the predictive model demonstrat-ing the utility of the feature sets produced. Additionally, the process of determindemonstrat-ing results as WMAPE rates and expected average inventory shipment reductions are de-scribed in this chapter.
Chapter 8 Presents the modeling results for the tests described in Chapter 7 and provides an interpretation of the meaning and cause of the results.
Chapter 9 Summarizes the findings of the investigation and the implications for Zara's operations. Additional areas of investigation and development as well as practical steps for implementation are described here.
Chapter 2
Literature Review
Significant prior research has been conducted in many of the fields related to this investiga-tion. This work is the continuation of a longstanding partnership between the Massachusetts Institute of Technology (MIT) Leaders for Global Operations (LGO) program and Zara's dis-tribution team representing the MIT 12 project. Together, Zara and LGO have investigated a number of operations research projects resulting in a number of tools still in use today. Additionally, the topics of demand forecasting in the fashion industry, data analytics, and omni-channel retailing have been the subjects of extensive study and form a solid foundation for the work described in this thesis.
2.1
Prior MIT Thesis Work
The research presented in this thesis marks the twelfth (MIT 12) LGO project conducted in collaboration with Zara. Prior projects performed in the partnership between the MIT LGO program and Zara's distribution team have spanned a number of operations optimization topics. Investigations by former students have spanned many aspects of operations within Zara's organization. The subject of demand forecasting has been one of particular interest spanning multiple prior theses. Both Initial Shipment and Replenishment demand forecast-ing processes have been carefully examined and continually optimized over the many years of partnership. In particular, prior thesis research performed by Correa [2], Garro [31, Gar-cia [4], and Kong [5] were essential resources forming the baseline processes and concepts
expanded upon in MIT 12.
2.2
Retail Fashion Demand Forecasting
Demand forecasting is a topic of significant academic interest, particularly with applications in the retail fashion industry. Indeed, the sheer number of reviews of demand forecasting models available testifies to the popularity of the subject; Choi et al.(2011) [6], Liu et al.
(2013) [7], Nenni et al. (2013) [8], Thomassey (2014) [9], and Ren et al. (2016) [10] to
name a few. Current literature emphasizes the complexity of the process given the tradi-tionally long product development times, short product lifecycles, high product variety, and volatile demand profiles of the industry. In forecasting demand, retailers must identify the appropriate data aggregation level for the forecasting model used to overcome some of these effects. Additionally, retailers identify and collect relevant explanatory variables, or features, to explain demand variation in such (non-exhaustive) categories as: Item Features and Fash-ion Trends, Retailing Strategy, Marketing Strategy, Macro-economic Data, Calendar Data, Competition, and Weather Data
[91.
A number of approaches to fashion demand forecasting have been proposed and studied over decades of research. Demand forecasting and inventory distribution optimization at Zara has been previously studied and implemented in research by Caro and Gallien over a longstanding research relationship 111]. Statistical methods are a popular approach, partic-ularly the time-series analysis method autoregressive integrated moving average (ARIMA) and the seasonal variant (SARIMA). These methods are fast to perform, however cannot consider all of the relevant explanatory factors necessary. Artificial intelligence algorithms such as evolutionary neural networks (ENN) [121 have been explored, however these algo-rithms require long training times preclude them from significant practical use. Extreme learning machines are a special implementation of neural network called a single hidden-layer feed forward network and require less training time than ENN
113].
Recent research has been conducted in hybrid approaches, combining statistical analysis with artificial in-telligence algorithms to improve forecasting performance with short prediction time [141. Progress continues to be made in the fashion demand forecasting industry, decreasing the22
required amount of time to train and predict using the models while increasing the accuracy of the forecasts produced.
2.3
Data Analytics in E-commerce
Data analytics in e-commerce has been widely studied as a field of significant interest to academics and companies. E-commerce firms collect a wealth of information about the traf-fic to and around their websites. Tools such as Google Analytics and Piwik allow website owners to track the digital footprints of customers through carefully designed data architec-tures [151. This data can be used in a variety of applications from simple traffic analysis and marketing campaign monitoring to demand forecasting for retail pricing decisions using machine learning models 116].
2.4
Omni-Channel Demand Studies
There have been recent efforts to conduct research focused on the omni-channel effects on retail operations and customer demand. Omni-channel retailers offer products to customers via two or more sales channels, typically brick-and-mortar stores, e-commerce websites, and mobile apps. Indeed, studies have investigated correlations between trips to brick-and-mortar stores and online stores to determine that online shopping encourages brick-and-mortar shop-ping trips, but the relationship is not reciprocal [171. As consumers increasingly engage these alternate channels, the distinction between channels is diminishing. Retailers are adapting their strategies to adjust to this shift and embrace the opportunity to understand customer engagement across channels better through data analytics [18].
2.5
MIT 12
In context of the significant established research on the subject of demand forecasting, this thesis seeks to form a bridge between existing models. As brick-and-mortar retailers con-tinue to grow e-commerce sales, datasets collected by the retailer websites become
signifi-cant sources of insight into customer preferences. The established research investigates the current best practices for demand forecasting among fashion retailers and in e-commerce applications, however significant research has not been published exploring the application of data analysis in multi-channel fashion retail. Specifically, the cross-channel effects be-tween brick-and-mortar and e-commerce demand indicator datasets is explored in this thesis, demonstrating a significant potential increase in demand forecast accuracy attributable to combining information from both sales channels.
Chapter 3
Background
Zara is well known in the fashion industry. With net sales in 2015 of more than 613M [11, Zara is one of the world's largest fashion retail brands competing with the likes of Hennes & Mauritz (H&M), Fast Retailing's Uniqlo brand, and Gap. Zara's highly vertically integrated and responsive supply chain combined with its ability to understand industry trends and preferences of its customers provide significant competitive advantages to the brand in the fast paced, highly variable world of fashion. The internal organization of Zara and the operations processes relevant to demand forecasting and e-commerce data collection are presented here to provide context for the rest of the investigation.
3.1
Zara Organization
The Zara brand consists of three departments : Women, Men, and Kids. Each department is further divided into several tipos de producto (English: product type). At the corpo-rate headquarters, each department has groups of product manager teams assigned to each product type that oversee the commercial aspects of the stores for a particular market (e.g. Spain, China or the U.S.A). Additionally, the Distribuciin (English: Distribution) team coordinates and monitors distribution of inventory throughout Zara's network of stores.
3.1.1
Zara.com
Zara.com, the e-commerce sales channel for the Zara brand, was launched in late 2010 to offer more options for customers to engage with the brand. Since it was established, Zara.com has experienced impressive year over year growth and is currently present in over 27 markets worldwide [1]. Customer orders to Zara.com are fulfilled through warehouses called Fulfillment Centers (FC) located in or near the markets that they serve. Some markets are served by multiple FCs and some FCs fulfill orders from multiple markets.
Zara.com operates within the Zara organization. The commercial team within Zara.com is responsible for individual departments and product types, similar to the organization of the brick-and-mortar commercial teams. Distribution teams are responsible to coordinate with the Zara.com commercial team as another set of product managers in the same way they do for the brick-and-mortar stores. Additionally, the Zara.com includes engineers to monitor website traffic data collection and analysis as well as general information to maintain smooth operations.
3.1.2
Zara Distribution and Operations
The primary responsibility of the distribution team is to ensure that the number of items in each article that are available are allocated to the correct stores in the right size mixture. This responsibility also includes store operations processes for moving inventory between the sales floor and the stock room as well as inventory transfers between stores and returns. A key component to optimizing the distribution of inventory across this complex network is the demand forecast.
3.2
Key Stakeholders
A key motivation of this work is the collaboration opportunity between the e-commerce and brick-and-mortar store operations. As such, key stakeholders exist in each organization as well as across the wider company and represent critical interfaces for the work described.
Product Managers Zara's product managers are commercial experts responsible for man-26
aging the products sold at each retail location including Zara.com storefronts. Product managers are intimately aware of customer preferences and provide location-specific expert product knowledge that is used by the Distribution team in demand forecasting. Zara Distribucinn (Distribution) The Zara Distribuci6n team is responsible for the
dis-tribution of all inventory across all sales channels for the company including brick-and-mortar stores and e-commerce websites. The Distribution team is the team most directly involved in the work described here.
Information Technology (IT) Engineers The IT Engineers are responsible for the im-plementation of the Inditex information infrastructure. These engineers develop and maintain databases and tools, including demand forecasting tools investigated in this work, used by teams across the organization. Additionally, IT engineers maintain and operate the Zara.com website, associated databases, and website traffic analytics.
3.3
Product Classification
Zara products are identified by multiple levels of classification:
Family The highest level of product classification is familia (English: family) and represents the most generic grouping of product. (e.g. Dresses or Shirts)
Subfamily The second level of product classification, called subfamilia (English: subfamily) associates the product and family to a specific product type (e.g. Woman Dresses or Basic Shirts). Subfamily categorization is subjectively assigned by the commercial buyers, each containing a varying number of articles at a given time. This decision does not involve the distribution demand forecasting team.
Article (MCC) Each product sold by Zara is identified with an article code (MCC) that
serves as a unique identifier for a particular article. The article code is comprised of three features: Modelo, Calidad and Color (English: Model, Quality, and Color). MCCt An individual item is known as an MCCt at Zara where t represents talla (English:
the most basic product identification level.
While final product orders and shipments are placed on an MCCt level, the analysis performed in this work and demand forecasting algorithms focuses on the MCC level.
3.4 Distribution Demand Forecasting
Fashion products have short lifecycles with notoriously volatile demand profiles as shown in Figure 3-1. Zara's products are no exception. Articles can transition from introduction through sold out and discontinued in as little as four weeks. With such short lifetimes, it is critical to distribute inventory as accurately as possible to ensure maximum satisfaction of customer demand. 100-c 75-0 V C 0
50-E 025-Demand Entry
Figure 3-1: An example of demand levels for a single MCC in a single location. The y-axis is normalized to present a percent of maximum article, location demand.
It should be noted that demand forecasting exists in many areas of Zara's operations. Only distribution demand forecasting processes are considered in the scope of this work. Additional processes are applied by different groups for applications including product design and purchasing decisions made by the commercial buyers group and for forecasting demand in the clearance period.
3.4.1
Demand Forecasting Overview
Zara's distribution demand forecasting supports the business need for quick and accurate short term demand forecasts. Every 3-4 days (one forecast period), a new distribution demand forecast is developed for each Zara store and new shipments are sent to restock the inventory required. Due to the volatility of fashion retail demand, forecasts are made for a short term from the expected date of shipment arrival.
Distribution demand forecasts are based on a weighted average of historical sales of the article being forecast in the store being considered. Two distinct distribution shipment types are considered in the forecasting, each with a specific process applied to it. The process applied depends on the type of distribution shipment to be sent: Initial Shipment or Replenishment Shipment. The shipment type is determined by stage of the product lifecycle that the particular (MCC, store) combination is in. Both distribution types are considered in this work.
The general timeline of the forecasting and delivery process for one market is outlined in Figure 3-2. Demand forecasts are generated for each forecast period, or twice per week. The lead time for items varies based on destination, however shipments are scheduled in groups based on location such that most articles arrive in stores on approximately the same day of the week for all stores receiving a shipment. Shipments arrive twice per week corresponding to the forecasting periods, once for weekend sales and once for weekday sales.
Initial
Replenishment
Forecast
Forecast
.com Coming
Initial Transit
Replenishment Sales
Soon
Period
Period
Initial
Initial
Replenishment
Delivery
1
Delivery 2
Delivery
Figure 3-2: The current demand forecasting timeline for new and replenishment product shipments in the physical and e-commerce sales channels
3.4.2
Distribution Demand Forecast Types
Initial ShipmentInitial shipment forecasting is performed when there is insufficient prior sales data for the (MCC, store) combination. This occurs when an article is first introduced to a store and for subsequent forecasts made with less than one week of historical sales data, usually the first two forecast periods.
In this process, similar articles are subjectively defined through discussion with the com-mercial teams to identify articles that have been sent to the store that are expected to have similar demand profiles to the article in question. Each similar article is assigned a weight and the composite weighted historical demand of the similar articles for a selected time pe-riod, usually corresponding to the first two weeks of sales, is used to predict the new article performance. The similar articles are used as proxies for the article until one week of data has been collected and forecasting can be performed using the replenishment shipment pro-cess. When there is sales data for the (MCC, store), but for a period of less than one week, that sales data can be mixed in with the similar articles to inform the next shipment.
Replenishment Shipment
The replenishment shipment process'describes all forecasts made with at least 1 week of (MCC, store) historical sales data available. In these forecasts, a weighted average of his-torical sales from the specific (MCC, store) over the previous week is used to determine the shipment quantity.
3.4.3
Demand Forecast Calculations
Two key measurements are used in Zara's demand forecasting calculations to describe an article's historical sales performance.
Dias Posibles de Ventas (DPV) Dias posibles de ventas (English: days of possible sale) for a given MCC (m) in a specified location (1) of interest represents the number of days that two conditions simultaneously hold true.
1. The store of interest (brick-and-mortar or website) is open for business and can conduct sales.
2. The article of interest has available stock in the sales channel of interest on the date of interest.
Although the time period used for calculation varies in practice, for the purposes of this study, this metric is calculated over the period of a single sales week (N = 7days)
and is therefore calculated as: N
DPVi,,m = openi,tAND(stocki,m,t > 0)
t=o
Venta Media (Vm) The venta media (English: average sales) is the average sales per day of an article adjusted for days of possible sale. This metric is typically calculated for a given MCC in a specific store location or market aggregation level. The Vm approximates the untruncated customer demand for the article in that it considers the expected average sales rate of an article per day assuming sufficient stock. Demand measurements are therefore only truncated on the day that the stockout occurs and in most cases do not significantly influence the Vm value.
mi N0
salesl,m,t
DPVi,m
The Vm measurement is the primary input used to forecast the expected sales of articles in a particular store. For initial shipments, the Vm is calculated for the selected similar articles over a selected time period based on commercial and distribution experience. The weighted average of the Vm is calculated across the group and this is used as the representative article Vm for initial shipment calculations. Replenishment shipments simply use the previous 1 week of average sales in the (MCC, store).
Demand Forecast Accuracy
The accuracy of the predicted Vm is measured for each demand forecast produced by the distribution team. The standard error metric used to measure the error of the demand forecast is the weighted mean absolute percent error (WMAPE). The WMAPE is calculated over a group of articles of interest using the predicted and actual values of the Vm as:
WMAPE
actual prediction - actual| -_ |prediction -actual|1 |actual|
|actual
E
I
actual
I
Therefore, a high accuracy demand forecast will have a low WMAPE while a low accuracy forecast will have a high WMAPE.
Comparing WMAPE for the two forecast types using the baseline algorithm yields a higher WMAPE for initial shipments versus replenishment shipments. This is due to the difference in using actual sales data for replenishment calculations rather than similar arti-cles as used in the initial shipment case. Similarly, comparing WMAPE by sales channels demonstrates a higher WMAPE for brick-and-mortar stores versus online FCs. The differ-ence between channels can be explained by the volume of shipments sent to the different locations and the effect of regional demand pooling in the online FCs.
3.4.4
Inventory Shipment Calculation
The final step of the demand forecasting process is the calculation of the units to ship to each store. The objective stock level is the target level of inventory for a given (MCCt, store) combination based on the expected customer demand for the tuple. Objective stock is calculated by modifying the predicted Vm for the given shipment type by a factor repre-senting the transit time and the safety stock (coverage) required for the desired service level of the article in a model. Additional modifications are made by a combination of manual adjustments and automated models to account for new articles, anticipated macro trends like holidays, and the size allocation distribution of the article. The calculated objective stock is then compared with the shipment maximum and minimum criteria. These limits ensure that no store receives a disproportionate number of units while meeting display criteria set by the commercial team to ensure that stores have at least enough inventory to populate a
full in-store display of the article. Therefore, the objective stock level for a given (MCCt, store) is expressed as:
Stockcalculated, if Stockcalculated > Display Minimum StOckobjective = Shipment Maximum, if Stockcalculated > Shipment Maximum
Display Minimum, otherwise where
Stockcalculated = Vm * transit * coverage * size
The total units shipped is calculated using the objective stock level and subtracting the total expected stock in the store at the time of shipment arrival.
Shipment = Stockobjective - Stockinstore
Finally, each store receives a rank for a subfamily based on it's percentage of total weekly sales for the articles in the subfamily. Article shipments are then allocated to stores by subfamily ranking, with the highest ranked stores receiving the calculated shipment first, continuing until the total initial shipment inventory is allocated among the stores. The distribution team releases the proposed shipments to the appropriate commercial teams and
THIS PAGE INTENTIONALLY LEFT BLANK
Chapter 4
Methodology
This chapter introduces the specific methodologies applied to the investigation of the cross-channel demand forecasting capabilities at Zara. The methodologies employed were selected based upon the review of current processes as described in literature (see Chapter 2) in addition to processes currently in place within the distribution department at Zara.
4.1
Data Analysis
Successful implementation of a data analytics project requires a standardized process to guide the investigation. For the purposes of this project, the Cross Industry Standard Process for Data Mining (CRISP-DM) was adapted to define the process as shown in Figure 4-1. This approach ensured a standardized process that allowed the business objective to continually guide the development and iteration of the work.
Business Objective
Identification CollectionData
Feature Model
Engineering - Evaluation
4.1.1
Business Objective
The process begins with business understanding, approached in this work as the identification of the business objective and problem formulation as discussed in Section 1.1. As described, the business objective is to provide a high service level to the customer by stocking sufficient inventory in a given location while minimizing operational costs. This work seeks to achieve this by producing a demand forecast with the minimum possible WMAPE for each demand forecast type as described in Section 3.4.
4.1.2
Data Collection
After clearly defining the business objective, datasets must be identified and collected in the Data Collection phase. Datasets are identified through a number of approaches including process research and interviews with experts in addition to an analysis of the datasets di-rectly associated with the business objective. Once identified, datasets must be located and collected if available. If unavailable, datasets can be updated to incorporate specific data points of interest in future data collection efforts for inclusion in analysis at a later time.
4.1.3
Feature Engineering
Feature Engineering is the process of transforming raw datasets into useful features for inter-pretation by analytical models. In this work, this process is performed using a combination of industry knowledge collected though process analysis and training in combination with preliminary analysis of feature relationships. Additionally, all datasets are cleaned to elim-inate erroneous values prior to analysis. Features are collected into feature vectors for each entry of interest, the full set of which comprise the feature space.
4.1.4
Modeling
Using the constructed feature set, the modeling phase seeks to build a descriptive model for a subset of feature vectors comprising a feature space called the training set. The training set is used to develop a model that accurately describes the observed behavior of the data.
Subsequently, the model developed using the training set is then applied to the remaining feature vectors that were held back in a blind test. This dataset represents unseen data and demonstrates the model's ability to predict the outcome of new data.
4.1.5
Model Evaluation
After models are built, trained, and tested around the feature set, model performance is evaluated to determine the usefulness of the prediction. Multiple model types as well as features that are included in the feature vectors can be adjusted in an iterative manner to converge on the best performing solution for the problem posed. Additionally, this phase must develop a metric that links the output of the model to the business objective identified in the Business Objective phase of the process.
4.1.6
Deployment
After the best performing model for the business objective of interest has been developed and identified, the model can continue to the deployment phase. In this phase, not directly addressed in this work, models are integrated into the standard business processes for testing in a real environment. Performance of the new process is carefully monitored in the initial implementation stages of this deployment and compared to the expected performance of the model as identified in the Model Evaluation phase of the process. Model performance should continually be checked against expectations and feature vectors should be updated to reflect changes in business processes and deficiencies in model performance.
4.2
Data Sources
Zara maintains a number of key databases storing data collected from various organizations within the firm. In particular, datasets were sourced from both the Zara.com and Dis-tribuci6n departments. The data collected describe the customer behavior on the Zara.com website, sales in both retail channels, product and store details and inventory information. Details regarding the individual datasets used in this analysis are discussed in Chapter 5.
THIS PAGE INTENTIONALLY LEFT BLANK
38
Chapter 5
Data Collection
Data collection represents a critical step in data mining and analysis. In this study, databases across the Zara organization were surveyed to identify the datasets of greatest potential value for demand forecasting. Through interviews with stakeholders and experts across organizations, a mapping of available databases was constructed to guide the data selection process and feature engineering phase of the project.
5.1
Data Identification
Zara maintains extensive databases describing the daily operations of the firm with high levels of detail and accuracy. To begin the data collection process, a preliminary investigation to identify potentially useful datasets was conducted. The proposed collection of datasets represented the data required to understand the customer preferences of both Zara.com and brick-and-mortar store customers.
5.1.1
Process Research
To clarify the data requirements that support Zara's demand forecasting, interviews were conducted throughout retail operations. The goal of these interviews was to develop an end-to-end concept of the process of identifying and fulfilling customer demand for a given MCC. For specific process descriptions regarding demand forecasting methods, see Section 3. The
identification of significant data points through general process understanding is discussed here. Interviews began with customers and customer-product interfaces in the brick-and-mortar stores and e-commerce channels to understand the process used by the commer-cial teams to determine which products to stock in each store. Process understanding was combined with hypotheses from other stakeholders to identify datasets that might provide additional customer preference insight to the Distribution demand forecasts.
5.1.2
Brick-and-Mortar Stores
In-store Purchases
In brick-and-mortar stores, customers enter the store without prior knowledge of the articles available but with a general sense of their personal fashion desires. Customer demand is therefore identified and fulfilled in two primary ways.
In the case of independent customers, the customer browses the sales floor of the store to identify products that match their preferences. Product preferences are determined by product features including type, style, material, color, fit and price. If a product is found to match the customer's preferences, the customer purchases the item and sales data is recorded in the sales database. If products exist but are not found in the store, the customer demand is left unrecorded.
Some customers engage with store associates to determine if available inventory matches their preferences. Store associates work with customers to determine the products the cus-tomer is interested in based on product features and comparison products. Through this pro-cess, the associate develops knowledge of the individual customer's preferences and matches those preferences with the available inventory in store. If products are found to match the preferences of the customer, the customer may purchase the articles. If an article is not found in the store, the associate may help the customer locate a suitable match at another store or on Zara.com. If no channels offer an article that matches the customer's preferences, no sale is recorded but the store associate remembers the preferences of the customer and communicates them to the regional Product Manager either directly or through the store manager during regular meetings.
Product Manager Forecasting
When forecasting demand, Product Managers combine sales data, personal experience with the region and knowledge of fashion trends, and reports from sales associates regarding customer preferences to inform their decisions. Additional information including store display configurations and layout are considered in discussions between the Product Manager and the store employees to inform expected customer purchases as well.
5.1.3
Zara.com Experience
At Zara.com, customers freely browse the storefront via one of three access methods: Zara's mobile application, mobile optimized website, and the desktop optimized website. All three methods directly access the specific interface developed by the Product Manager for the customer's region. The e-commerce experience does not give the customer access to store associates, thus each customer behaves as the independent customer in a brick-and-mortar store.
Website Navigation
The storefront allows the customer to browse available articles through the navigation tree, a tool that assigns categories to each product and allows customers to display products within the category of interest. Products may be assigned to multiple categories. Product filters can be applied to limit the articles displayed, for example selecting specific product subcategories, price limits, colors, and sizes. A special product category called
Oltima
Semana (English: New In) is placed at the top of the navigation tree. The New In category contains products released in the last two weeks and represents the most current trends.The customer also has the option to search for their desired article using keywords entered in the search field. The Zara.com team maintains an optimized search results algorithm to display the most relevant article results based on the keywords entered. This function seeks to partially serve the role of an in-store associate suggesting products based on a discussion of the customer's interests. Figure 5-1 shows an example of a typical Zara.com storefront.
mian Us OONTAGIO * ZARA _BUSCAR I FILTRO Visi. 2 4 19 u ticulo. OLTIMA SEMANA MUJER
-Fgr -: Aneaml webit laouo th aacmsorfotwt avgto re
or prdutspr si owa selecte byth usmer Eaharil i ereete ya ht
, 1
h AoI bteO ms
t hdy
Mp
iguren 5-1 Arttn eampile wesitiaout cofr teZraso
stdorefrn
wiith inaviation tree,
sarch ar adilfit otns
o
ovewapoutGi d
als(nlih
ieGie
or
M
six product peno
sslce ytecsoer.6 Eah aricleM M
is O r peeteO ya ht
oispon.de Forstmrthtdsr more information ornomk ucae
the ustoe
musatiselect onie. of th
ptons is played in hbuts.tcretyaalbei
ienszta
iei rydoto
ticlae.Dtal
Each MCCW
ha"Medctdoaewit addtina phtgah anealsaotthril
inluin w ritnatcedsrpin
oomtrasadcrszn
nomtopie
and poWdc viaiiy h pint iwapoutGfeTla Egih ieGie
ispoie
fo r utmr htdsr
oeifraino
h
i fapriua ril.I
prduc spoue nbtntcretyaalbe
nagvnszta
iei rydoto
the pa
The Product Manager may decide to indicate that additional stock is coming with an
envelope symbol next to the unavailable size. By clicking this symbol, the customer will
have the option to enter an email address to be notified when the article is in stock. These
subscriptions can be made for articles that were once in stock but are currently out of stock,
or for articles that will be offered for the first time soon. Figure 5-2 shows an example
product details page.
CHAQUETA POUPIEL BORDADA CON DETALLES METALICOS 140,00 EUlA COLOR: Negro SELE0O0O"A TALLA
r, AVISAMS CUANQ0 LLIQU9
GUIA OE TALLAS
Chqeie o psiplel ow dis~n miskes Cuses sob" y
-MMPg large Pulls. Den slw. sesimaa. .11.AL'lJ- In CM I CH"