HAL Id: hal-03005097
https://hal-cnrs.archives-ouvertes.fr/hal-03005097
Submitted on 13 Nov 2020
HAL is a multi-disciplinary open access
archive for the deposit and dissemination of
sci-entific research documents, whether they are
pub-lished or not. The documents may come from
teaching and research institutions in France or
abroad, or from public or private research centers.
L’archive ouverte pluridisciplinaire HAL, est
destinée au dépôt et à la diffusion de documents
scientifiques de niveau recherche, publiés ou non,
émanant des établissements d’enseignement et de
recherche français ou étrangers, des laboratoires
publics ou privés.
determine real-time variation of enantiomeric excess
Antoine Comby, Caoimhe M.M. Bond, Etienne Bloch, Dominique Descamps,
Baptiste Fabre, Stephane Petit, Yann Mairesse, Jason Greenwood, Valérie
Blanchet
To cite this version:
Antoine Comby, Caoimhe M.M. Bond, Etienne Bloch, Dominique Descamps, Baptiste Fabre, et al..
Using photoelectron elliptical dichroism (PEELD) to determine real-time variation of enantiomeric
excess. Chirality, Wiley, 2020, 32 (10), pp.1225-1233. �10.1002/chir.23267�. �hal-03005097�
Using photoelectron elliptical dichroism (PEELD) to determine real-time
variation of enantiomeric excess
A. Comby,
[a]C.M.M. Bond,
[b]E. Bloch,
[a]D. Descamps,
[a]B. Fabre,
[a]S. Petit,
[a]Y.
Mairesse.
[a], J..B. Greenwood,
[b]V. Blanchet,
[a]Keywords: ((Photoionisation, PECD, Fourier, Camphor, Fenchone, Ibuprofen, Ultrafast.))
Introduction
When photoionisation using circularly polarized light takes place in chiral molecules, the 3D-angular distribution of the photoelectron is characterized by a forward/backward asymmetry relative to the laser propagation axis. This effect has been called photoelectron circular dichroism (PECD) and has been observed in all photoionisation regimes.1,2,3 By convention,
PECD is the excess of photoelectrons emitted in the forward hemisphere by left circularly polarized light. This normalized asymmetry results from the scattering of the electrons in the chiral molecular potential before their emissions from the ionic core. Being based only on the electric dipole of interaction, PECD inherits a large amplitude that can reach 10-20% close to the ionisation threshold for randomly oriented pure enantiomers, and even higher values once the enantiomers are oriented.4,5
Most of the experimental setups are based on the velocity map imaging of the photoelectrons (VMI) with a direct spatial resolution along the laser propagation axis (z) and an extra axis (x) as shown in figure 1(b).6 Up to 2012, the PECD investigations
were performed by using synchrotron sources to get the simplest ionisation scheme: the one-photon ionisation by absorption of vacuum ultraviolet (VUV) radiation. Since the pioneering works in Kassel and Amsterdam,7 PECD is also measured routinely
with femtosecond laser sources in the multiphoton ionisation regime.
The use of PECD to characterize a mixture of volatile organic compounds (VOC) by enantioselective analysis has been explored by combining the photoelectron imaging with a mass-spectrum analysis. This was achieved in one-photon or in multiphoton ionisation where a significant acquisition time was needed to obtain sufficient statistics due to the limited ion-electron coincidence rate.8,9 With a few hours of acquisition, the
precision reached on this enantioselective analysis of VOC compounds was one decimal less accurate than that obtained by GC×GC-TOFMS, which is two dimensional gas chromotography (GC×GC) using time-of-flight mass spectrometry detection (TOFMS).10
In the work presented here, that is based on a recent publication,11 instead of using mass-spectrometry to identify
each compound, we use the anisotropy of excitation induced by intermediate resonances in the multiphoton ionisation regime. This anisotropy of excitation means that among all the randomly oriented molecules produced in the gas phase, the ones with their electronic transition dipole moments aligned with the laser electric field are preferentially excited. This orientation selective excitation is molecule-dependent due to the nature of the electronic resonances, (i.e.) each is defined by a different transition moment.
Materials and Methods
The recent progress in Ytterbium fiber laser technology has led to a considerable increase of the repetition rate of intense femtosecond laser sources, from the 1kHz to the >100kHz range. As a consequence, the time necessary to record a photoelectron image in a VMI spectrometer has decreased by two orders of magnitude. In this study we used an industrial laser with a repetition rate tuneable from 166kHz to 2MHz delivering 135fs pulses at 1030nm with 50W average power (Tangerine Short Pulse from Amplitude Co.). The duty cycle of a PECD measurement then becomes limited by the time required to rotate the quarter wave-plate used to switch the polarization state from circular left to circular right. To circumvent that issue, we continuously (on-the-fly) record the angular distribution of the
[a] CNRS-CEA
Université de Bordeaux CELIA F33405 Talence, France Fax: (+)
E-mail: valerie.blanchet@u-bordeaux.fr
[b] School of Maths and Physics Queen’s University Belfast BT7 1NN, UK
Received: ((will be filled in by the editorial staff)) Revised: ((will be filled in by the editorial staff)) Published online: ((will be filled in by the editorial staff))
Abstract: In this work the photoionisation of chiral molecules by an elliptically polarised, high repetition rate,
femtosecond laser is probed. The resulting 3D photoelectron angular distribution shows a strong forward-backward asymmetry, which is highly dependent not only on the molecular structure but also on the ellipticity of the laser pulse. By continuously varying the laser ellipticity we can observe molecular and enantiomer changes in real time at a previously unseen speed and precision. The technique allows enantiomeric excess of a pure compound to be measured with a 5% precision within 3 seconds, and a 10-minute acquisition yields a precision of 0.4%. The isomers camphor and fenchone can be easily distinguished, unlike with conventional mass-spectrometry. Preliminary results for the pharmaceutically interesting ibuprofen are also given, showing the capability of photoionisation as a means of distinguishing larger molecular systems.
photoelectrons while rotating the quarter wave plate at a constant speed (one 360° turn in 8 seconds). This continuous variation of the rotation stage allows us to explore the photoelectron asymmetry as a function of the polarization state of the ionizing radiation defined by the amount of circularly polarized photons (proportional to the third Stokes parameter S3).
By varying S3, the photoelectron asymmetry results now from an
elliptically polarised multiphoton ionisation and to emphasize the difference with PECD, we called it PEELD for PhotoElectron ELliptical Dichroism. In one-photon VUV ionisation, it has been shown that PEELD scales linearly with S3: PEELD=S3*PECD.
Nevertheless, in multi-photon ionisation, the ion continuum is not reached directly and the anisotropy of excitation can play an important role.
To reach the ionisation threshold of most molecular systems (lying in the 8-10 eV range) with a fs-1030nm pulse (1.2 eV), many photons are required. This necessitates using a high intensity that can induce ponderomotive shifts of the ionisation potential as well as inducing dynamical Stark shifts of the resonances, with a possible blurring of the anisotropy of excitation. It has been shown that in this case, the measured PECD has a smaller amplitude because the electron scattering becomes more influenced by the strong laser field than by the chiral molecular potential. To avoid these strong field effects, where the photoemission is also averaged over the spatial mode and the temporal envelope, it is more appropriate to use a visible-UV fs pulse such as the harmonics of 1030nm or the tuneable output of an OPA. In such ionisation regime, less than four photons are required to reach the ionisation threshold without any energy-shift of the resonances.
Results and Discussion
Fast Enantiomeric Excess Measurements
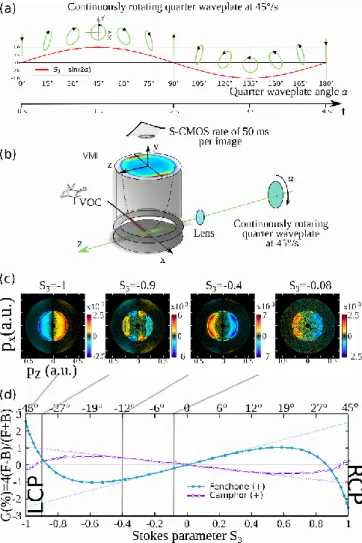
Figure 1 summarizes the most important aspects of the experiment with the typical time scale of the S3 variation and the
resulting polarisation state, combined with the VMI detection and its preferential axis (x being the molecular beam axis, y the time-of flight axis time-of the VMI and z the laser propagation axis along which the chirality of the molecular system is encoded). Figure 1c, shows the 2D-PEELD asymmetry recorded for (1S,4R)-(+)-fenchone along with its kinetic energy and angular dependency for four different S3 values. As for PECD determination, the
2D-PEELD (|S3=0.4|) have been obtained by subtracting the
photoelectron VMI image recorded at S3=+0.4 (Right helicity,
RH) from the one recorded at S3=-0.4 (Left helicity, LH). Note
that this raw-data image that we call 𝑃̅𝑎𝑛𝑡𝑖(𝑥, 𝑧, |𝑆 3|) ,
corresponds to an experimental integration of the 3D PEELD along the y-axis (the time-of-flight axis of the VMI). 𝑃̅𝑎𝑛𝑡𝑖(𝑥, 𝑧, |𝑆
3|) is an image normalised by half of the intensity of
the pixel maximum in the 𝑃̅𝑠𝑦𝑚(𝑥, 𝑧, |𝑆
3|) image with
𝑃̅𝑠𝑦𝑚(𝑥, 𝑧, |𝑆
3|) being the sum of the same photoelectron VMI
images recorded at S3=-0.4 (LH) and S3=+0.4 (RH). We see
clearly that in (+)-fenchone the asymmetry reverses as a function of S3, with a backward asymmetry for S3=-0.08 and a forward
one for the highest S3=-1.
A simpler way to monitor the PEELD effect as a function of S3 is
to integrate numerically the raw photoelectron image along 𝑥 and 𝑧 for the forward hemisphere 𝐹 and the backward hemisphere 𝐵. In line with the seminal work on VUV-PECD,12 the
asymmetry factor 𝐺(%) is defined as ‘’the difference between forward and backward emission of the photoelectrons
normalized to the mean intensity per hemisphere i.e. half of the total signal’’, or 𝐺 = 4(𝐹 − 𝐵)/(𝐹 + 𝐵). Figure 2d shows the variation of 𝐺(%) as a function of S3. We confirm that 𝐺(%)
scales linearly with S3 around the linear polarisation (S3=0).
Indeed, the elliptical field can be decomposed as a sum of linear and circular components, the latter being proportional to |S3|.
FIGURE 1: The main elements of a the PEELD experiment (a) variation of the polarisation ellipticity with time, defined by the S3 Stoke parameter, (b) the VMI detector made of an electrostatic lens with its time of flight axis along y, two microchannel plates installed at the end of a time-of-flight axis and coupled to a phosphor screen monitored by a S-CMOS camera allowing an exposure time of 50ms. The VOC source is simply a 200µm capillary tube maintained at 95°C connected to a VOC distributor made of several valves maintained at 70°C, while the VOC containers are at room temperature (c) PEELD images in (+)-fenchone recorded by the S-CMOS camera for different S3. The four photon ionisation is achieved by a 125fs pulse centered at 515 nm and defined by a 1×10¹³ W.cm-2 intensity (d) S
3 dependency of the 𝐺(%) factor defining the PEELD after x,z numerical integrations recorded in (+)-fenchone and in (+)-camphor.
For small values of |S3|, resonances taking place with three
photon absorption (around 7.2 eV) are efficiently reached by using the linear components of the field. The two-photon resonance with the CO pi* state at 4.8 eV could also be playing a role.13 From these electronically excited states, selected
molecules along one single molecular axis can be ionized by absorption of a single circular photon, producing a forward-backward photoelectron asymmetry proportional to the amount
of circularly polarized photons, (i.e.) |S3|. However, with
increasing |S3|, several electronic excitations are in play
coherently selecting several molecular axes. The anisotropy of excitation is no longer axial, as it is for |S3|<0.3, but is planar.
This change in the anisotropy of excitation is revealed by non-monotonic behaviour of 𝐺(%) taking place around |S3|=0.4 in
(+)-fenchone and around |S3|=0.55 in (+)-camphor. It is also
visible in the PEELD images of figure 1c : the angular distribution with the quasi-linear field S3=-0.08 is similar to the one measured
using S3=-0.4, but changes drastically for S3=-0.9, to even
permuting its sign for S3 =-1. By comparing (+)-fenchone to its
isomer (+)-camphor, we see clearly that this S3 dependency is
molecule specific. It is this aspect that we exploited for enantioselective analysis of a sample of fenchone and camphor. Unlike mass-spectrometry coupled to PECD, here there are no restrictions on the photoionisation rate.
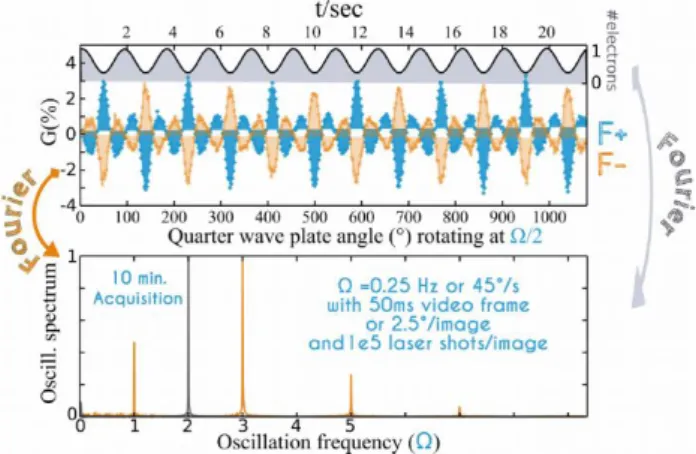
We now define an instantaneous asymmetry measurement 𝐺𝑟𝑎𝑤(𝑡) (t), that is the 𝐺(%) value as defined above recorded at
the instant t corresponding to an angular position of the quarter wave-plate. Indeed since the S-CMOS camera allows frame acquisition with zero dead time and the rotation stage has a fixed speed, we can expect the PEELD effect to be periodic, with 𝐺𝑟𝑎𝑤(𝑡) values repeated every 180° since the helicity changes
with a 90° rotation. This means that the natural frequency Ω of the S3 dependency is twice the speed of the rotation stage. The
signals from opposite helicities are compared by calculating: 𝐺(𝑡) = 1/2[𝐺𝑟𝑎𝑤(𝑡) − 𝐺𝑟𝑎𝑤(𝑡 + 𝜋/Ω)]. This latter operation has
the benefit of correcting for spatial inhomogeneities in the detector’s gain. In the present experiment, π/Ω = 2 seconds and the 𝐺(𝑡) value is retrieved every 4 seconds. Figure 2a shows 𝐺(𝑡) measured over 24 seconds with a movie of the phototoelectrons defined by a 50 ms exposure time for each frame and a laser repetition rate fixed at 2MHz. The enantiomeric effect is observed through the mirroring of 𝐺(𝑡)) recorded on (+)-fenchone and (-)-(+)-fenchone. Figure 2a shows that the total number of photoelectrons produced as a function of |S3| is also
periodic with a maximum reached for linear polarisation at the present wavelength.
FIGURE 2: 𝐺(𝑡) variation in both enantiomers of fenchone shown over three full turns of the rotational stage as a function of time as well as the quarter wave-plate angle. Therefore, the pattern shown in figure 1d is reproduced many times. Also shown on the upper part is the photoionisation efficiency measured at the same time, with the highest ionisation rate reached when the 515 nm pulse is linearly polarized. The Fourier analysis of the ionisation yield and the 𝐺(𝑡) function are shown on a photoelectron movie recorded over 10 minutes. Adapted with permission from [11].
As 𝐺(𝑡) and the total number of electrons are periodic, they can be analysed by a Fourier transform. The total signal FFT (linked to the integration of 𝑃̅𝑠𝑦𝑚(𝑥, 𝑧, |𝑆
3|)) shows a main component at
2Ω, reflecting the fact that the photoionisation efficiency maximizes every 90°, when the polarisation is linear. Note that circular dichroism in the ionisation rates is possible for a REMPI scheme,14 and would be evident as a Ω Fourier-component of
the ionisation yield. In our data there is indeed such a very weak component. But since the phase does not flip by inverting the enantiomer, we can conclude that it originates from an optical artefact and that no CD is produced in our ionization scheme. In fact, such a CD effect has been detected only up to 2+1 REMPI14,
and not yet in 3+1 REMPI.
The 𝐺(𝑡) signal is decomposed into a sum of frequency components: the natural Ω frequency of the PEELD effect (180° periodicity) and its odd harmonics which are the signature of the sharp non-monotonic pattern observed for large |S3| in figure 1d.
No even harmonics contribute due to the well-defined parity of 𝐺(𝑡).
FIGURE 3: Fourier analysis of 𝑃̅𝑠𝑦𝑚(𝑥, 𝑧, 𝑡) and 𝑃̅𝑎𝑛𝑡𝑖(𝑥, 𝑧, 𝑡) to get
the amplitudes of (a) 𝒫̅𝑠𝑦𝑚(𝑥, 𝑧, 2Ω), (b) 𝒫̅𝑠𝑦𝑚(𝑥, 𝑧, 4Ω), as well as (c)
𝒫̅𝑎𝑛𝑡𝑖(𝑥, 𝑧, Ω) and (d) 𝒫̅𝑎𝑛𝑡𝑖(𝑥, 𝑧, 3Ω) using 515 nm pulses at 5 × 10¹² W.cm−2 for three different enantiopure samples. All values are normalized to the maximum of 𝒫̅𝑠𝑦𝑚(𝑥, 𝑧, 2Ω). The 𝑧 axis is the laser
propagation direction and the 𝑥 axis is the main axis of the laser polarization ellipse. Adapted with permission.11
While the Fourier analysis of 𝐺(𝑡) is useful for characterizing the change in the relative weight of the frequencies as the anisotropy of the excitation is changed from 1D to 2D, the molecular sensitivity apparent in the rich angular and energy information of the VMI images is lost by these x and z integrations. In the context of enantioselective analysis, a clever approach is to increase the dimensionality of the measurement with the following Fourier analysis scheme. Each frame (𝑃(𝑥, 𝑧, 𝑡) of the movie is treated as the following: 𝑃̅𝑎𝑛𝑡𝑖(𝑥, 𝑧, 𝑡) =
1/2(𝑃(𝑥, 𝑧, 𝑡) − 𝑃(𝑥, −𝑧, 𝑡)) and 𝑃̅𝑠𝑦𝑚(𝑥, 𝑧, 𝑡) = 1/2(𝑃(𝑥, 𝑧, 𝑡) +
𝑃(𝑥, −𝑧, 𝑡)). Then variation in the amplitude of each pixel (x,z) of the two movies (𝑃̅𝑎𝑛𝑡𝑖(𝑥, 𝑧, 𝑡) and 𝑃̅𝑠𝑦𝑚(𝑥, 𝑧, 𝑡) ) is Fourier
analysed to extract its amplitudes varying at the frequency 2 and 4 for the symmetric movie leading to two new images 𝒫̅𝑠𝑦𝑚(𝑥, 𝑧, 2Ω), 𝒫̅𝑠𝑦𝑚(𝑥, 𝑧, 4Ω). Similarly, the amplitudes of each
pixels varying at and 3 are extracted from the antisymmetric movie to get 𝒫̅𝑎𝑛𝑡𝑖(𝑥, 𝑧, Ω) and 𝒫̅𝑎𝑛𝑡𝑖(𝑥, 𝑧, 3Ω). Figure 3 shows
these amplitudes obtained for three different pure enantiomers. While the 𝒫𝑠𝑦𝑚 images carry information on the ionisation yield,
the potential of ionisation, and more generally on the character of the cation states reached, 𝒫̅𝑎𝑛𝑡𝑖 images carry information on
the chiral nature of the enantiomer probed at this laser wavelength and intensity. The same acquisition on the opposite
enantiomer defined with the same purity would provide the same 𝒫̅𝑠𝑦𝑚 images and sign-reversed 𝒫̅𝑎𝑛𝑡𝑖. To differentiate PEELD
recorded at fixed |S3| and the Fourier analysis shown in Figure
3, we call this approach c-PEELD, (i.e.) a PEELD that has been recording Continuously with a periodic variation of S3 and then
Fourier decomposed with the aforementioned approach. Figure 3 can be seen as a database of c-PEELD molecular fingerprints for these enantiopure systems, that can be used to retrieve the composition a time-varying sample of an unknown chiral VOC.
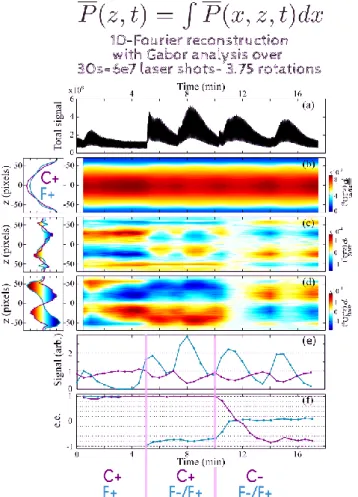
FIGURE 4: Real-time monitoring of a temporally evolving camphor-fenchone mixture. The molecular fingerprints 𝒫̿𝑠𝑦𝑚(𝑧, 2Ω) ,
𝒫̿𝑎𝑛𝑡𝑖(𝑧, Ω) and 𝒫̿𝑎𝑛𝑡𝑖(𝑧, 3Ω) extracted from the integration along x
of the images shown in figure 3 are shown in the left column. Grey vertical lines indicate the moments when the VOC mixture was modified by closing and opening different valves. (a) Total signal from the gas mixture during the c-PEELD measurement. (b) Temporal evolution of 𝒫̿𝑠𝑦𝑚(𝑧, 2Ω, T) (c, d) 𝒫̿𝑎𝑛𝑡𝑖(𝑧, Ω, T) and
𝒫̿𝑎𝑛𝑡𝑖(𝑧, 3Ω, T) where all three were extracted from a Gabor analysis
with a 30s window. (e) Contribution to the total signal by fitting the symmetric components and (f) enantiomeric excess of fenchone and camphor retrieved by fitting the antisymmetric components.
As a proof-of-concept study to use c-PEELD for an enantioselective analysis, we created a mixture of enantiopure samples of camphor and fenchone that varies as a function of time by simply opening valves connected to the different enantiomers. Similarly to Figure 3, from the 𝑃̅(𝑥, 𝑧, 𝑡) movie we will extract two new movies 𝑃̅𝑠𝑦𝑚(𝑥, 𝑧, 𝑡) and 𝑃̅𝑎𝑛𝑡𝑖(𝑥, 𝑧, 𝑡). But to
extract the time-resolved composition of the samples, 𝒫̅𝑠𝑦𝑚(𝑥, 𝑧, 2Ω) , 𝒫̅𝑎𝑛𝑡𝑖(𝑥, 𝑧, Ω) and 𝒫̅𝑎𝑛𝑡𝑖(𝑥, 𝑧, 3Ω) are calculated
from a Gabor analysis with a gaussian filter of 30 s FWHM. This provides three new movies 𝒫̅𝑠𝑦𝑚(𝑥, 𝑧, 2Ω, T), 𝒫̅𝑎𝑛𝑡𝑖(𝑥, 𝑧, Ω, T) and
𝒫̅𝑎𝑛𝑡𝑖(𝑥, 𝑧, 3Ω, T) in which T is a sliding time. In order to extract
the proportion of fenchone relative to camphor as well as their respective enantiomeric excesses, we are currently working on optimising the fitting of these three movies with a linear composition of the 𝒫̅𝑠𝑦𝑚(𝑥, 𝑧, 2Ω) , 𝒫̅𝑎𝑛𝑡𝑖(𝑥, 𝑧, Ω) and
𝒫̅𝑎𝑛𝑡𝑖(𝑥, 𝑧, 3Ω) images obtained from enantiopure camphor and
fenchone (images of figure 3). Meanwhile, for a fast in-situ monitoring of the enantiomeric excess, it is worthwhile to use a 1D fingerprint of all the images shown in Figure 3 by integrating the 𝑥 dimension while maintaining the information along the laser propagation axis 𝑧 which encodes the sensitivity to the chirality and enantiomeric excess. These 1D-plots along 𝑧 are shown on the left column of figure 4 for both camphor and fenchone. Figures 4 (b-d) show the time evolution of the VOC mixture after the x-integration of 𝒫̅𝑠𝑦𝑚(𝑥, 𝑧, 2Ω, T) ,
𝒫̅𝑎𝑛𝑡𝑖(𝑥, 𝑧, Ω, T) and 𝒫̅𝑎𝑛𝑡𝑖(𝑥, 𝑧, 3Ω, T) to get 𝒫̿𝑠𝑦𝑚(𝑧, 2Ω, T) ,
𝒫̿𝑎𝑛𝑡𝑖(𝑧, Ω, T) and 𝒫̿𝑎𝑛𝑡𝑖(𝑧, 3Ω, T). These three T-evolutions are
fitted as a linear combination of the 1D-plots shown in the left column of figure 4. The relative proportions of fenchone and camphor shown in figure 4e are extracted from a fit of 𝒫̿𝑠𝑦𝑚(𝑧, 2Ω, T) and then used in the fits of 𝒫̿𝑎𝑛𝑡𝑖(𝑧, Ω, T) and
𝒫̿𝑎𝑛𝑡𝑖(𝑧, 3Ω, T) to get the enantiomeric excess of both fenchone
and camphor shown in figure 4f. Grey vertical lines in figure 4 indicate when valves are opened and closed to change the nature of the mixture. Figure 4f clearly illustrates that c-PEELD measurements can detect fast evolutions. A precision of a few % can be reached as shown on the error bars in figure 5b from reference 11.
Pharmaceutically Interesting Molecules.
Although most of the research into multiphoton PECD has been carried out on a few exemplar molecules, such as camphor, fenchone and limonene, it can also be used to analyse larger, pharmaceutically and biologically more interesting molecules. An example of one such molecule is S-Ibuprofen. Ibuprofen is a widely used non-steroidal anti-inflammatory drug which is usually administered in a racemic form, although it is sometimes prescribed in its pure form (dexibuprofen) as it is the more active enantiomer. Unlike the isomers fenchone and camphor, chiral pharmaceuticals tend to have larger, looser structures often containing a phenyl chromophore with strong absorption around 250-280 nm. Most of these drugs are also solid at room temperature making them less accessible for PECD/PEELD which is undertaken in the gas phase.
FIGURE 5: The ellipticity dependence of the 𝐺(%) of PEELD for S-Ibuprofen at 260nm (blue) and 520nm (green). With the molecular structure of S-ibuprofen given, the chiral carbon is highlighted in blue.
Preliminary results from this molecule were taken using the device described in ref 15, and are shown in Figure 5. The
instrument has recently been augmented to study solids using a CW laser to evaporate the sample. In this study, less than 1 g of S-Ibuprofen was deposited on a stainless steel foil which was placed about 1 cm from the interaction region and gently irradiated on the reverse side by the CW laser so the foil temperature rose to around 60C. A molecular plume with a target density of 1010-1011 cm-3 ,16 was crossed by 200kHz, 300fs
laser pulses at a wavelength of either 260 nm at an intensity ~9x10¹⁰ Wcm-2 or 520nm at ~6x10¹² Wcm-2. The ionisation laser
had a longer pulse length and a factor of 10 lower average power than the laser used for the fenchone and camphor results.
The results in Figure 5 show that, as for the fenchone and camphor results, there is a strong PEELD dependence at both wavelengths and the G parameter has an opposite sign for the two wavelengths used. At 260 nm there is a maximum asymmetry of G =+1.2% at S3 = +0.5 while for 520 nm it reaches
G = +0.6% at S3 = 0.6. This wavelength dependence is not
surprising given that 260nm has a (1+1) ionisation scheme, while for 520nm it is a (2+1+1) scheme so that the final ionisation step is from a different excited state. These results show that PECD/PEELD can be obtained from non-volatile organic molecules with a less rigid molecular structure than camphor and fenchone, despite the likely presence of multiple conformers, with ref 17 suggesting that there are 10 population rich conformers. Using the energies calculated in ref 18 for the 4 lowest conformers, at the temperature used these 4 are equally present in our sample. PECD has been shown to be conformer dependent,19 sometimes with opposite signs, which may tend to
cancel the overall asymmetry of an ensemble of conformers. However, despite this, the values of G are similar to those found for fenchone and camphor.
The pulse length may also have an influence on the magnitude of the PEELD asymmetry due to molecular dynamics on these timescales. When the intermediate state is excited, the molecular structure will relax as the Franck-Condon region is usually not a minimum on the potential energy surface of the excited state. So a pulse length of 300 fs would allow time for some internal vibrational redistribution and this could increase or decrease the photoelectron asymmetry for different pulse lengths, as has been observed in fenchone previously.20
The channel electron multiplier detectors set up for stereo-detection in the instrument, operated in a pulse counting mode so that the statistical uncertainty in 𝐺(%) is given by ∆𝐺 = √8/𝑅𝑡 , where 𝑅 is the count rate in each detector and 𝑡 the acquisition time per point at each polarisation. Therefore to attain the 0.2% statistical uncertainty observed in Figure 5, an acquisition time of 50s was required per point for 𝑅 = 20,000 Hz. This was much slower than for the VMI measurements of the monoterpene ketones shown in Figure 1 due to a much less powerful ionisation laser and lower target densities. However, by using a more powerful laser, increasing the evaporation rate of the sample, using an aerodynamic lens source coupled to a thermodesorber,21 and running the detectors in analogue mode,
the analysis speeds achieved with the VMI could be replicated.
Conclusion
Unlike one photon PECD which scales linearly with ellipticity, it is shown here that multiphoton PEELD has a richer behaviour. This new photoelectron elliptical dichroism appears to be ubiquitous for resonantly enhanced MPI schemes. PEELD demonstrates the competition between linearly and circularly
polarised photons which result in the anisotropy of the photoexcited state. The Fourier analysis, of the continuously recorded data to extract the characteristic peaks of PEELD, proves to be an extremely powerful tool which provides more molecular information than conventional PECD. The resulting PEELD has been shown to not only be highly dependent on molecular species but also the wavelength used to ionise, thus acting as a distinct molecular fingerprint. Its ability to be used to measure enantiomeric excesses of mono-component samples to precision of 5% in 3 seconds and 0.4% in 10 minutes enables real time monitoring of samples as quantitatively measured in ref 11. The composition of multicomponent samples can be measured with a precision of a few percent with a temporal resolution of 30s, proving its ability to be used on more complex samples. We have also demonstrated its power to be used on more than a few benchmark molecules including those with practical applications.
REFERENCES
1. Ritchie B Theory of the angular distribution of photoelectrons ejected from optically active molecules and molecular negative ions. Physical Review A 1976;13: 1411–15.
2. Powis I Photoelectron circular dichroism of the randomly oriented chiral molecules glyceraldehyde and lactic acid. The J.
Chem.Phys. 2000;112: 301–10.
3. Beaulieu S, Ferré A, Géneaux R, Canonge R, Descamps D, Fabre B, Fedorov N, et al. Universality of photoelectron circular dichroism in the photoionization of chiral molecules. New Journal
of Physics, 2016;18: 102002.
4. Nahon L, Garcia GA, and Powis I. Valence shell one-photon photoelectron circular dichroism in chiral systems. Journal of
Electron Spectroscopy and Related Phenomena.2015;204:
322–34.
5. Tia M, Pitzer M, Kastirke G, Gatzke J, Kim HK, Trinter F, Rist J, et al. Observation of Enhanced Chiral Asymmetries in the Inner-Shell Photoionization of Uniaxially Oriented Methyloxirane Enantiomers. The Journal of Physical Chemistry Letters. 2017;8: 2780–86.
6. Eppink ATJB and Parker DH. Velocity map imaging of ions and electrons using electrostatic lenses: Application in photoelectron and photofragment ion imaging of molecular oxygen. Review of Scientific Instruments. 1997;68: 3477–84. 7. Lux C, Wollenhaupt M, Bolze T, Liang Q, Köhler J, Sarpe C, and Baumert T. Circular Dichroism in the Photoelectron Angular Distributions of Camphor and Fenchone from Multiphoton Ionization with Femtosecond Laser Pulses. Angewandte Chemie
International Edition, 2012;51: 5001–5.
Lehmann, C. Stefan, N. Bhargava Ram, Ivan Powis, et Maurice H. M. Janssen. « Imaging photoelectron circular dichroism of chiral molecules by femtosecond multiphoton coincidence detection ». J.Chem. Phys. 2013; 139: 234307.
Lu
Lux C., Wollenhaupt M, Sarpe C., Baumert T. Photoelectron Circular Dichroism of Bicyclic Ketones from Multiphoton Ionization with Femtosecond Laser Pulses. ChemPhysChem 2015; 16:115-37. 8. Ganjitabar H, Hadidi R, Garcia GA, Nahon L, and Powis I. Vibrationally-resolved photoelectron spectroscopy and photoelectron circular dichroism of bicyclic monoterpene enantiomers. Journal of Molecular Spectroscopy. 2018;353: 11– 199. Fanood MMR, Ram NB, Lehmann CS, Powis I, and Janssen MHM. Enantiomer-specific analysis of multi-component mixtures by correlated electron imaging–ion mass spectrometry. Nature
10. Nahon L, Nag L, Garcia GA, Myrgorodska I, Meierhenrich UJ, Beaulieu S, Wanie V, Blanchet V, Géneaux R, and Powis I. Determination of accurate electron chiral asymmetries in fenchone and camphor in the VUV range: sensitivity to isomerism and enantiomeric purity. Phys. Chem. Chem. Phys.
2016;18: 12696–706.
11. Comby A, Bloch E, Bond CMM, Descamps D, et al. Real-time determination of enantiomeric and isomeric content using photoelectron elliptical dichroism. Nature Communications
2018;9:5212.
12. Nahon L, Garcia GA, Harding CJ, Mikajlo E, Powis I. Determination of chiral asymmetries in the valence photoionization of camphor enantiomers by photoelectron imaging using tunable circularly polarized light. J.Chem.Phys.
2006;125: 114309
13. Pulm, F., J.r. Schramm, J. Hormes, S. Grimme, et S.D. Peyerimhoff. « Theoretical and experimental investigations of the electronic circular dichroism and absorption spectra of bicyclic ketones ». Chemical Physics 1997; 224: 143‑55. 14. Boesl U., Bornschlegl A., Logé C., Titze K. Resonance-Enhanced Multiphoton Ionization with Circularly Polarized Light: Chiral Carbonyls . Analytical and Bioanalytical Chemistry 2013;405: 6913-24.
Lehmann, Carl Stefan, et Karl-Michael Weitzel. « Coincident Measurement of Photo-Ion Circular Dichroism and Photo-Electron Circular Dichroism ». Phys. Chem. Chem. Phys., 2020, doi :
10.1039.D0CP01376E.
15. Miles J, Fernandes D, Young A, Bond CMM, Crane SW, Ghafur O, Townsend D, Sá J, Greenwood JB. A new technique
for probing chirality via photoelectron circular dichroism.
Analytica Chimica Acta. 2017;984:134-139.
16. Calvert CR, Belshaw L, Duffy MJ, Kelly O, King RB, et al. LIAD-fs scheme for studies of ultrafast laser interactions with gas phase biomolecules. Phys. Chem. Chem. Phys. 2012;18:6289-6297.
17. Izumi H, Ogata A, Nafie LA, Dukor RK. A Revised Conformational Code for the Exhaustive Analysis of Conformers with One-to-One Correspondence between Conformation and Code: Application to the VCD Analysis of (S)-Ibuprofen. J. Org.
Chem. 2009;74:1231-1236.
18. Betz T, Zinn S, Schnell M. The shape of ibuprofen in the gas phase. Phys. Chem. Chem. Phys. 2015;17:4538-4541. 19. Tia M, de Miranda BC, Daly S, Gaie-Levrel F, Garcia GA, Nahon L and Powis I, VUV Photodynamics and Chiral Asymmetry in the Photoionization of Gas Phase Alanine Enantiomers. Journal of Physical Chemistry A. 2014;118: 2765-2779.
20. Comby A, Beaulieu S, Boggio-Pasqua M, Descamps D, et al. Relaxation Dynamics in Photoexcited Chiral Molecules Studied by Time-Resolved Photoelectron Circular Dichroism: Toward Chiral Femtochemistry. J. Phys. Chem Lett. 2016;7: 4514-4519. 21. Hadidi, Rim, Dusan K. Bozanic, Gustavo A. Garcia, et Laurent Nahon. Electron Asymmetries in the Photoionization of Chiral Molecules: Possible Astrophysical Implications.