HAL Id: hal-02360069
https://hal.umontpellier.fr/hal-02360069
Submitted on 18 Nov 2020
HAL is a multi-disciplinary open access
archive for the deposit and dissemination of
sci-entific research documents, whether they are
pub-lished or not. The documents may come from
teaching and research institutions in France or
abroad, or from public or private research centers.
L’archive ouverte pluridisciplinaire HAL, est
destinée au dépôt et à la diffusion de documents
scientifiques de niveau recherche, publiés ou non,
émanant des établissements d’enseignement et de
recherche français ou étrangers, des laboratoires
publics ou privés.
soft hydrothermal conditions
Paul Estevenon, Éléonore Welcomme, Stephanie Szenknect, Adel Mesbah,
Philippe Moisy, Christophe Poinssot, Nicolas Dacheux
To cite this version:
Paul Estevenon, Éléonore Welcomme, Stephanie Szenknect, Adel Mesbah, Philippe Moisy, et al..
Preparation of CeSiO 4 from aqueous precursors under soft hydrothermal conditions. Dalton
Trans-actions, Royal Society of Chemistry, 2019, 48 (22), pp.7551-7559. �10.1039/C9DT01258C�.
�hal-02360069�
Preparation of CeSiO
4from aqueous precursors under soft
hydrothermal conditions
Paul Estevenona,b, Eleonore Welcommea, Stephanie Szenknectb, Adel Mesbah*b, Philippe Moisya, Christophe Poinssota, Nicolas Dacheux*b
Even though CeSiO4 was synthesized one time through a hydrothermal treatment, the conditions leading to its formation
remain largely unknown. In order to define the optimized conditions of synthesis, a multiparametric study was developed by varying the pH of the solution, the temperature, the nature of the reactants and of the complexing ions in solution. This study highlighted that CeSiO4 could not be obtained starting from Ce(IV) reactants. An optimal set of conditions was
defined to prepare single phase samples. Pure CeSiO4 was obtained through a hydrothermal treatment at 150°C using a
starting mixture of 1 mol·L-1 Ce(III) nitrate and Na2SiO3 solutions and by adjusting the initial pH to 8. The chemical
limitations observed during the synthesis of CeSiO4 suggested that the formation of this phase may result from the slow
in-situ oxidation of a Ce(III) silicate complex during the hydrothermal treatment.
Introduction
The synthesis of Ce(III) silicates has been extensively studied mainly because of their optoelectronic, catalytic and ion exchanger properties.1-11 The formation of cerium(III) silicates was also reported as secondary phases for cerium doped silicon nitride ceramics and cerium doped nuclear waste glasses.12 However, even if the formation of cerium(III) silicates is ubiquitous, only few information are available concerning the properties of the cerium(IV) silicate, because high temperature methods commonly used to prepare silicate based phases did not allow to form CeSiO4.3 Indeed,
thermodynamic calculations predicted that this phase was unstable compared to the mixture of corresponding oxides, CeO2 and SiO2.13
Silicate species are abundant in environmental conditions,14 especially in potential geological sites dedicated to underground repository of radioactive waste. In such conditions, actinide elements could be in contact with silicate species coming from cement, glass waste form, granite or clay. This raises important questions regarding the interaction of silicate species and actinides and associated potential impact on actinide mobility in environmental conditions. Tetravalent actinide elements are often associated to very low mobility in environmental conditions due to the low solubility of actinide bearing hydroxides, i.e. An(OH)4, in neutral and alkaline
media.15 Such a solubility could be significantly modified in the presence of silicate species in solution. Indeed, uranium(IV) and thorium(IV) are well known to form natural thorite (ThSiO4), coffinite (USiO4, second more abundant U(IV) bearing
phase) and uranothorite solid solutions by alteration of the respective oxides.16-20 Moreover, actinide silicate colloids have been observed at room temperature for actinide(IV): Th(IV), U(IV) and Np(IV). Several authors showed that colloidal transport influenced significantly the mobility of actinides in environmental conditions.21-25 In the case of plutonium(IV), the formation of PuSiO4 and of plutonium silicate colloids was also
suggested.26 The mechanism associated to their formation remained, however, largely unknown.
Cerium is commonly used as a surrogate for actinides, especially for plutonium due to some similarities in terms of ionic radius and chemical properties. First, CeSiO4 was
reported to be isostructural with ZrSiO4 (space group I41/amd),
HfSiO4 and AnSiO4 (with An = Th, Pa, U, Np, Pu and Am).27-30 It
has been reported as a natural occurring mineral phase of the zircon group by Schlüter et al. in 2009 31 and named stetindite. The formation of synthetic CeSiO4 was formerly reported by
Dickson and Glasser in 2000 during the study of cement alteration.30, 32 To the best of our knowledge, this protocol was the only reported in literature to prepare this phase. It consisted in the hydrothermal treatment (55 T 180°C for 14 to 700 days) of a mixture containing cerium(III) nitrate solution, SiO2 and CaO dissolved in aqueous solution under
inert atmosphere. From PXRD analyses, these authors reported the formation of a mixture of CeSiO4 and CeO2 for
T ≥ 130°C and of CeSiO4 as the only crystallized phase for
T ≤ 85°C. However, due to the poor crystallinity of CeO2
precipitated at low temperatures, its presence in the final mixtures was not definitively discarded. Moreover, the role of CaO in these media remained largely unclear.
This work was thus dedicated to the preparation of oxide free CeSiO4 samples in order to get a set of thermodynamic
experimental data associated to this phase. In this field, the comprehensive study of the formation of pure CeSiO4 samples
with different aqueous precursors is reported here.
Materials and methods
Preparation of CeSiO4
All of the reagents used were of analytical grade and supplied by Sigma-Aldrich. Na2SiO3 was used as silicate precursor.
Ce(NO3)3·6H2O (99.9 %) and CeCl3·7H2O (99.9 %) were used as
Ce(III) precursors, whereas (NH4)2Ce(NO3)6 (99.99 %) and
Ce(SO4)2 (99.9 %) were considered for Ce(IV). NaHCO3 was
used as the carbonate source. 1.5 mol·L-1 HNO3, 1.5 mol·L-1 HCl
and 0.75 mol·L-1 H2SO4 solutions were prepared by dilution of
Sigma Aldrich ACS grade solutions: HNO3 (70%), HCl (37%) and
prepared from Sigma Aldrich ACS grade NaOH (98 %) before the experiments. Aqueous silicate solutions were prepared by dissolving Na2SiO3 and the cerium precursor in acidic solutions
(which nature depended on the cerium precursor used). The pH was then adjusted to the final expected value with 8 mol·L-1 NaOH. The experiments were performed either in air or under inert conditions (Ar-atmosphere glove box).
All the mixtures were put in Teflon lined reactors in Parr autoclaves and then treated under hydrothermal conditions during 1 to 20 days with a temperature ranging from 40°C to 250°C and under autogenous pressure (Table S1). Reference conditions were fixed to 10 days of hydrothermal treatment at 150°C. Thus, the final precipitates were separated from the supernatant by centrifugation for 12 min at 14 000 rpm, washed twice with deionized water and once with ethanol, and then finally dried overnight at 60°C in an oven.
Characterizations
PXRD data were collected on the resulting powders using the Bruker D8 advance diffractometer equipped with a lynxeye detector and using Cu Kα radiation (λ = 1.54184 Å) in a reflection geometry (parallel beam). PXRD patterns were recorded between 5° and 100° (2θ) with steps of 0.019° and a total counting time of 2.5 to 3 hours per sample. Pure silicon was used as a standard material to extract the instrumental function. Therefore, all the collected data were refined by the Rietveld method using the Fullprof suite package.33 During the refinements, different profile and structural parameters were allowed to vary, such as the zero shift, unit-cell parameters, scale factor, and overall displacement factor. However, the occupancy of each site was fixed to the calculated values. Raman spectra were recorded with a Horiba-Jobin Yvon Aramis device equipped with an edge filter and a Nd:YAG laser (532 nm) that delivers 60 mW at the sample surface. In order to avoid any laser-induced degradation of the compound, the power was turned down by the means of optical filters. The laser beam was then focused on the sample using an Olympus BX 41 microscope with an X50LMP objective, resulting in a spot area of ∼1 μm2 and a power of 475 µW. For each spectrum, a dwell time ranging from 30 to 600 s was used. Four scans were performed to average the measurement error. For each sample, the data were collected on different areas.
FTIR spectra were recorded in the 300–4000 cm-1 range thanks to a Perkin-Elmer FTIR Spectrum 100 device. Powdered samples were deposited on the surface of an ATR crystal without any prior preparation. The spectra collected in such operating conditions exhibited a resolution lower than 4 cm-1. Four scans were performed to average the measurement error.
SEM observations were directly conducted on small aliquots of samples without prior preparation such as metallization, using a FEI Quanta 200 electronic microscope, equipped either with an Everhart-Thornley Detector (ETD) or a Back-Scattered
Electron Detector (BSED), under high vacuum conditions with a very low accelerating voltage (2 – 3.1 kV). These conditions were chosen in order to create a beam deceleration effect that led to high resolution images.
Speciation calculations were performed using the PHREEQC 2 software 34 and the thermochimie_PHREEQC_SIT_v9 database,35 combined with the thermodynamic constants available in Table S2 in order to determine the speciation of cerium in the reactive media.
Results and discussion
As already mentioned, the only protocol reported for the preparation of CeSiO4 was developed by Dickson and
Glasser.30, 32 It consisted in preparing an equimolar mixture of lime, silica and cerium(III) nitrate in aqueous solution under inert atmosphere. This mixture was submitted to hydrothermal treatment between 55 and 180°C for 14 to 700 days. The precise role of CaO and redox reactions involving cerium were not clearly understood. The syntheses of the tetravalent actinide silicates, which are analogs of CeSiO4, are
usually performed in the presence of carbonate ions.27, 36, 37 However, it was recently reported that pure ThSiO4 can be
prepared without adding carbonate ions.38 All these chemical routes have been explored with the aim to prepare pure CeSiO4. Especially, the protocols described by Costin et al. for
uranothorite solid solutions ThxU1-xSiO439-44, or other recently
developed for ThSiO437, 38, and described by Dickson et al. for
CeSiO430, 32 were adapted.
Preparation of CeSiO4 from Ce(IV) precursors
Experiments developed in the absence of carbonate species in the reactive media. Attempts to prepare CeSiO4 from Ce(IV)
precursors were performed with starting cerium and silicon concentrations ranging from 4.2 10-2 mol·L-1 and 0.21 mol·L-1 whereas the initial pH of the reactive media was varying from pH = 1 to pH = 12. Hydrothermal treatment were performed
Figure 1. PXRD patterns obtained for samples prepared under hydrothermal conditions (7 days, T = 250°C) with starting silicate and cerium(IV) concentrations
of 4.2 10-2 mol·L-1 and initial pH value equal to 10.5 (1), 8.7 (2), 6.9 (3), 4.1 (4), 3.9
(5) and 2.4 (6). Characteristic XRD lines of CeO2 and CeSiO4 were extracted from ref
30and 45, respectively.
with temperatures and holding times ranging from 90°C to 250°C and from 7 to 10 days, respectively.
10 20 30 40 50 60 70 80 90 100 Intensity (a. u.) 2· (degree) pH = 3.9 6 1 2 3 5 pH = 2.4 pH = 10.5 pH = 8.7 pH = 6.9 4 pH = 4.1 CeO2 CeSiO4
All the attempts to prepare CeSiO4 were unsuccessful. From
PXRD characterization, only mixtures of CeO2 and amorphous
SiO2 were observed (Figure 1). Moreover, the increase of the
FWHM of the XRD lines associated to CeO2 was noted when
increasing the pH of the starting mixture, as the consequence of the decrease of the crystallite size. These results were explained by the rapid hydrolysis of Ce(IV) which happened even at low pH values and prevented any complexation of cerium by silicate species.46 This explanation may be also supported by thermodynamic considerations. Indeed, the formation of CeSiO4 is expected to be strongly disfavored
compared to the mixture of CeO2 and SiO2.13
The IR spectra recorded for pH < 8 were characteristic of amorphous SiO2 (Figure S1). On the contrary, they did not
indicate the presence of SiO2 or CeO2 for pH > 8 but may
correspond to the sorption or integration of silicate species in the structure of CeO2 similar to those observed for the
sorption of silicate species on the surface of actinides oxides.47,
48
Experiments developed in the presence of carbonate species in the reactive media. For several actinides, the synthesis
performed in the presence of carbonate species led to the formation of AnSiO4 even if they are unstable compared to a
mixture of SiO2 and AnO2, as it was observed for metastable
coffinite USiO4 36, 49
or predicted for PuSiO4 27
according to ab initio calculations.13, 27
Several attempts to prepare CeSiO4 in carbonate ions rich
reactive media have been performed with starting cerium and silicate concentrations ranging from 4.2 10-2 mol·L-1 and 0.21 mol·L-1, initial pH of the reactive media varying from pH = 8.7 to 12 and for hydrothermal treatment performed during 7 to 10 days with temperatures between 150°C and 250°C. PXRD diagrams of the samples prepared are reported in Figure 2 for the various initial conditions examined. Unlike other tetravalent actinide silicates, CeSiO4 was never formed using
these conditions (Figure 2). This specific behavior of cerium(IV) could result from the stronger complexation constants of carbonate species with cerium and from the different stoichiometry of the limiting complexes obtained for cerium,
Figure 2. PXRD patterns obtained for samples prepared under hydrothermal conditions (10 days, T = 150°C) with starting silicate and cerium(IV)
concentrations of 0.21 mol·L-1 and initial pH value equal to 8.7 and with NaHCO3
concentration equal to 0.21 mol L-1 (7), 0.42 mol L-1 (8), 1.0 mol L-1 (9) and
2.1 mol L-1 (10). XRD lines of the sample holder are pointed out by an asterisk.
Characteristic XRD lines of CeO2 and CeSiO4 were extracted from ref 30 and 45,
respectively.
Ce(CO3)68- 50 and actinides, An(CO3)56- 51 in carbonate media.
Both aspects would induce the decrease of the cerium availability as the consequence of the strong interactions with carbonate species (Table 1) leading to the formation of the cerium hexacarbonate complex and preventing other ligands to interact with the metal due to steric constraints.
Table 1. Constants of complexation of Ce(IV) and An(IV) with carbonate associated to the limit complexes at I = 0 (25°C).
Ln/An log(β°5)* log(β°6)* Reference
Th 31.0 ± 0.7 --- 52
U 34.0 ± 0.9 --- 53
Np 35.6 ± 1.1 --- 53
Pu 35.7 ± 1.1 --- 53
Ce 41.8 ± 0.5 42.2 ± 0.5 50
* β°n is associated to the reaction An4+ + n CO32- = An(CO3)n(2n-4)-.
Preparation of CeSiO4 from Ce(III) precursors in solution.
Impact of the initial pH and concentrations of reactants on the formation of CeSiO4 in nitric acid media. Since hydrolysis and complexation by carbonate ions are strongly unfavorable to the formation of pure CeSiO4, complementary experiments
have been performed starting from Ce(III) precursors. With this aim, the syntheses were developed from mixtures of Ce(III) and silicate ions with starting concentrations of 0.21 mol·L-1 and initial pH values ranging from pH = 1.3 to 12.3. The hydrothermal treatments were performed during 10 days at 150°C under inert atmosphere (Ar). The PXRD of the samples obtained are reported in Figure 3. It is worth noting that the formation of CeSiO4 was observed in a small range of
pH, i.e. between 7 and 9. Moreover, it was not obtained as a pure phase. Indeed, the formation of CeSiO4 was limited by
that of CeO2 whether at higher and at lower pH values.
Complementary characterization by IR spectroscopy (Figure S2) revealed the presence of SiO2 for pH < 7 whereas it
suggested the integration of silica in the lattice of cerium
Figure 3. PXRD patterns obtained for samples prepared under hydrothermal conditions
(10 days, T = 150°C) with starting silicate and cerium(III) concentrations of 0.21 mol·L-1,
in nitric acid media and with an initial pH equal to 12.3 (11), 10.1 (12), 9.0 (13), 8.4 (14), 7.0 (15), 5.9 (16), 3.1 (17) and 1.3 (18). XRD lines of the sample holder are pointed out
10 20 30 40 50 60 70 80 90 100 CNaHCO3 = 0.21 M CeO2 Int ensi ty (a. u.) 2· (degree) CeSiO4 * * 8 9 10 7 CNaHCO3 = 0.42 M CNaHCO3 = 1.0 M CNaHCO3 = 2.1 M 10 20 30 40 50 60 70 80 90 100 pH = 12.3 11 Inten sity (a.u.) 2· (degree) CeO2 CeSiO4 * * 12 pH = 5.9 pH = 10.1 pH = 9.0 pH = 8.4 pH = 7.0 13 14 15 16 17 pH = 1.3 pH = 3.1 18
10 20 30 40 50 60 70 80 90 100 Intensity (a. u.) 2· (degree) T = 210°C 29 25 26 14 28 T = 250°C T = 90°C T = 130°C T = 150°C 27 T = 170°C CeO2 CeSiO4 10 20 30 40 50 60 70 80 90 100 CeO2 Ce2O(CO3)2 Natural burbankite Int ensi ty (u. a.) 2· (degree) CeSiO4 34 35 CNaHCO3 = 0,21 M CNaHCO3 = 1,0 M
by an asterisk. Characteristic XRD lines of CeO2 and CeSiO4 were extracted from ref 30
and 45, respectively.
dioxide or the sorption of silicate ions on the surface of the samples for the pH > 9, as already described for thorium.47
Working with higher cerium and silicate concentrations (typically CCe CSi 1.0 mol·L
-1
) did not affect the pH range in which CeSiO4 was formed (Figure 4). However, the comparison
of the data reported for both concentrations showed the significant increase of the relative content of CeSiO4
(compared to CeO2) in the mixture when increasing the initial
cerium and silicate concentrations. This result was in good agreement with that obtained for ThSiO4,
37, 38
for which high concentrations of reactants appeared to improve the yield of formation of the silicate phase. In order to fix the better conditions associated to the preparation of CeSiO4, Rietveld
refinement of the PXRD data was performed (Figure 5). From the results reported in Figure 4 and in Figure 5, the maximum relative content of CeSiO4 in the prepared mixtures was
obtained for concentrations of reactants of 1.0 mol·L-1 and for pH = 8.2.
Although the results confirmed the synthesis of CeSiO4 from
Ce(III) precursor as described by Dickson et al.30, 32, we can conclude from this study that CaO does not play any important role during thesynthesis. In order to increase the recoveryyield of CeSiO4, several experiments were unsuccessfully
Figure 4. PXRD patterns obtained for samples prepared under hydrothermal conditions (10 days, T = 150°C) with starting silicate and cerium(III) concentrations
of 1.0 mol·L-1, in nitric acid media and with an initial pH equal to 8.7 (19), 8.6 (20),
8.2 (21), 7.8 (22), 7.4 (23) and 7.0 (24). Characteristic XRD lines of CeO2 and CeSiO4
were extracted from ref 30 and 45, respectively.
Figure 5. Relative contents of CeSiO4 and CeO2 (expressed in wt.%) determined by
Rietveld refinement of the PXRD patterns of samples prepared under hydrothermal conditions (10 days, T = 150°C), with starting silicate and cerium(III) concentrations
of 1.0 mol·L-1, in nitric acid media and for various initial pH values.
performed by using over-stoichiometric amounts of silicate compared to cerium. Furthermore, additional syntheses performed in air led to lower reaction yields than those obtained under argon atmosphere. This difference was assigned to the rapid oxidation of Ce(III) into Ce(IV) under aerated conditions,54 which led to the rapid precipitation of cerium tetrahydroxide, then finally to CeO2 by ageing.46
Impact of the heating temperature on the formation of CeSiO4
in nitric acid media. In order to underline the impact of the
temperature of the hydrothermal treatment on the yield of formation of CeSiO4, various experiments were performed
between 90°C and 250°C during 10 days, with starting cerium and silicate concentrations of 0.21 mol·L-1 and initial pH values ranging from pH = 7 to pH = 9. The PXRD diagrams of the samples obtained are plotted in Figure 6 for several temperatures of hydrothermal treatment. It is worth noting that CeSiO4 was formed only between 90°C and 150°C. At
higher temperatures (T ≥ 170°C), only crystallized CeO2 was
formed whereas at lower temperatures, the amount of CeO2
formed as a by-product of the synthesis was difficult to quantify because of its poorly crystallinity for T < 120°C. However, even for the lower temperatures studied, the formation of CeO2 was evidenced by Raman spectroscopy,
whereas that of amorphous SiO2 was confirmed by IR
spectroscopy (Figure S3).
Figure 6. PXRD patterns obtained for samples prepared with starting silicate and
cerium(III) concentrations of 0.21 mol·L-1, in nitric acid media and with an initial pH
ranging from 7 to 8, after hydrothermal treatment during 10 days at 90°C (25),
130°C (26), 150°C (27), 170°C (28) and 250°C (29). Characteristic XRD lines of CeO2
and CeSiO4 were extracted from ref 30 and 45, respectively.
Figure 7. PXRD patterns for samples prepared with starting silicate and cerium(III)
concentrations of 1.0 mol·L-1, in nitric acid media with initial an pH equal to 7 at
various temperature: T = 40°C (30), and T = 60°C (31). XRD lines of sample holder
are pointed out by an asterisk. Characteristic XRD lines of CeO2 and CeSiO4 were
extracted from ref 30 and 45, respectively.
Figure 8. Variation of the lattice parameters a and c of CeSiO4 versus the temperature
of hydrothermal treatment. Dash lines correspond to the unit cell parameters obtained after heating the samples at 1000°C (considered as reference values).
The optimal conditions to prepare CeSiO4 were found to be
pH = 8.0 and T = 150°C. Performing the syntheses at lower or
10 20 30 40 50 60 70 80 90 100 pH = 8.7 Inten sity (a.u.) 2· (degree) CeO2 CeSiO4 pH = 7.0 pH = 8.6 pH = 8.2 pH = 7.8 pH = 7.4 19 20 21 22 23 24 6.5 7.0 7.5 8.0 8.5 9.0 0 20 40 60 80 100 Wt.% Ce SiO 4 pHinitial 0 20 40 60 80 100 Wt.% Ce O2
10 20 30 40 50 60 70 80 90 100 Int ensi ty (a. u.) 2· (degree) 30 T = 40°C T = 60°C 31 CeO2 CeSiO4 * 40 60 80 100 120 140 160 6.19 6.20 6.21 6.95 6.96 6.97 6.98 6.99
a parameter
c parameter
La
tti
ce
pa
ra
mete
rs
(Å)
Temperature (°C)
10 20 30 40 50 60 70 80 90 100 CeO2 Int ensi ty (a. u.) 2· (degree) 32 33before nitric acid washing
after nitric acid washing Sm(OH)2Cl
CeSiO4
higher pH values led to the significant decrease of the yield of formation of CeSiO4 (and thus to the formation of higher
amounts of CeO2 and SiO2). It has been observed that, at 90°C,
the optimum pH value was shifted to lower values (i.e. pH = 7), probably because of the dependence of the water self-ionization constant with temperature. Moreover, it is worth noting that the extension of the holding time of the hydrothermal treatment up to 210 days at 40°C or up to 52 days at 60°C also led to the formation of CeSiO4 (cerium and
silicate concentrations of 1.0 mol·L-1 and pH = 7) (Figure 7). As it was reported for ThSiO4,38, 55 the synthesis temperature
of CeSiO4 affected the lattice parameters of the crystallized
phase. Indeed, the decrease of the a lattice parameter and the increase of the c lattice parameter were observed when the temperature increased (Figure 8). As inferred for ThSiO4,38, 55
this evolution could result from the elimination of hydroxide groups inserted in the silicate phase when increasing heating temperature.
Figure 9. PXRD patterns obtained for a sample prepared under hydrothermal conditions during 10 days at T = 150°C with starting silicate and cerium(III)
concentrations of 0.21 mol·L-1, in hydrochloric acid and with pH = 8.5. PXRD
obtained before (32) and after washing step in 6 mol·L-1 HNO
3. Characteristic XRD
lines of CeO2, CeSiO4 and Sm(OH)2Cl were extracted from ref 30, 45 and 56,
respectively.
Finally, the stability of CeSiO4 under hydrothermal conditions
was examined at 250°C by contacting CeSiO4 with solution for
different pH. No proof of the CeSiO4 degradation was obtained
during these experiments. Therefore, it may inferred that the impact of temperature on the preparation of pure CeSiO4 did
not result from the metastability of this phase. It is surely associated to the degradation of intermediate species required to form CeSiO4 instead of CeO2 in the final samples.
Preparation of CeSiO4 in hydrochloric acid medium. Several syntheses were performed in hydrochloric media using CeCl3
as starting precursor. The results followed roughly the same trend than in nitric acid solution. However, the formation of CeSiO4 in these conditions was limited by the formation of
cerium hydroxyl-chloride, Ce(OH)2Cl which formed in the same
pH range (Figure 9). Ce(OH)2Cl is isostructural to Ln(OH)2Cl
phases which were formed under hydrothermal conditions in experimental conditions close to those developed in this study.57, 58 Due to its high solubility in nitric acid, a washing step of 10 minutes with 1 M nitric acid after the synthesis allowed to dissolve specifically the Ce(OH)2Cl phase leading to
a CeSiO4 and CeO2 mixture (Figure 9).
The direct comparison of the results obtained in nitric and hydrochloric media showed that oxidation of cerium(III) to cerium(IV) necessary to form CeSiO4 was not only due to the
presence of nitrate ions. Residual oxygen dissolved in water could contribute to this oxidation reaction.
Figure 10. PXRD patterns for the samples prepared under hydrothermal conditions during 10 days at T = 150°C with starting silicate and cerium(III) concentrations of
0.21 mol·L-1, with pH
initial = 8.7 and carbonate concentration of 0.21 mol·L-1 (34) or
1.0 mol·L-1 (35). Characteristic XRD lines of CeO2, CeSiO4, Ce2O(CO3)2 and natural
burbankite, (Na,Ca)3(Ca,Sr,Ba,Ln)3(CO3)5, were extracted from references ref 30, 45,
61 and 60, respectively.
Preparation of CeSiO4 in carbonate media. Several attempts to use carbonate ions as pH buffer in the reactive media and/or as complexing agent of cerium to increase its availability, thus its reactivity with silicate species did not lead to the formation of CeSiO4. The main limitation was the formation of cerium(III)
carbonate based species, such as Ce(OH)CO3 under
hydrothermal conditions at 150°C as observed by Guo et al.59, and burbankite type phases 60 Na4Ce2(CO3)5, for higher
carbonate concentrations (Figure 10). Moreover, increasing the temperature of the hydrothermal treatment led to the decomposition of such cerium carbonate species to form cerium oxide (mixed with amorphous silica) without any trace of CeSiO4. These results indicated that the complexation of
Ce(III) with carbonate ions was more favorable than with silicate species (see Figure 13 and Figure S9 thereafter).
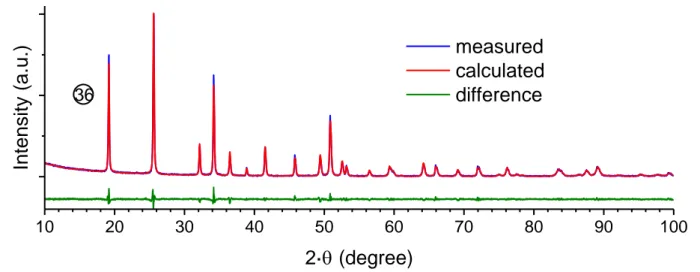
Figure 11. PXRD diagram, calculated and difference profile after Rietveld refinement obtained for CeSiO4 prepared under hydrothermal conditions (T = 150°C, t = 20 days,
Ar-atmosphere), in nitric medium, with CCe(III) CSi 1 mol·L-1 and pHinitial = 8.0 (36).
10
20
30
40
50
60
70
80
90
100
measured
calculated
difference
Intensity (a.
u.)
2·
(degree)
36
Characterization of CeSiO4 sample obtained in optimized
conditions
From the multiparametric study developed, the set of optimal conditions to prepare pure CeSiO4 (Figure 11) and optimize its
yield of formation, corresponds to high Ce(III) and silicate concentrations (i.e. 1 mol·L-1) and pH value adjusted to 8.0 with the help of NaOH. Hydrothermal treatment is performed at 150°C for 20 days under inert atmosphere (Ar).
Rietveld refinements performed on the XRD diagrams confirmed that CeSiO4 crystallized in the zircon structure
(I41/amd space group) with the following unit cell parameters:
a = 6.9603(1) Å, c = 6.1946(2) Å, i.e. V = 300.11(2) Å3 (Table S3). These values are close to those reported by Skakle et al.30 (a = 6.9564(3) Å and c = 6.1953(4) Å, i.e. V = 299.80(3) Å3).
In such conditions, neither silica nor cerium oxide features were observable from infrared and Raman spectrometric
measurement (Figure S4 and Figure S5). Moreover, infrared and Raman spectra confirmed the same features for CeSiO4
than for isostructural zircon-type silicate (Table 2).
The characterization of CeSiO4 by Scanning Electron
Microscopy clearly showed the formation of square based bipyramids crystals with less than 1 µm in length. This morphology is clearly characteristic of zircon-type actinide silicates (Figure 12).32
As suggested by Dickson et al.32, heating of CeSiO4 under inert
atmosphere (Ar) or in air revealed that the phase was stable up to 1000°C. The unit-cell parameters obtained after heating at this temperature were found to a = 6.9446(1) Å, c = 6.1975 Å and V = 298.89(1) Å3 (Figure S7 and Table S3). It showed the decrease of the a unit cell parameters and the increase of the c unit cell parameter, compared to those obtained just after hydrothermal treatment. Such a difference could result from the elimination of hydroxide groups in the structure.38, 55
Table 2. Assignment of the bands associated to silicate groups observed by Raman and IR spectra for CeSiO4 and comparison with some other zircon-type compounds.
Raman spectroscopy Infrared spectroscopy
ν2 ν4 ν1 ν3 ν2 ν4 ν1 ν3
ZrSiO462, 63 439 cm-1 608 cm-1 974 cm-1 1008 cm-1 431 cm-1 620 cm-1 866 cm-1 1049 cm-1
HfSiO464-66 448 cm-1 620 cm-1 984 cm-1 1018 cm-1 430 cm-1 610 cm-1 890 cm-1 1020 cm-1
ThSiO439 438 cm-1 592 cm-1 887 cm-1 914 cm-1 445 cm-1 584 cm-1 823 cm-1 986 cm-1
USiO439 424 cm-1 591 cm-1 906 cm-1 919 cm-1 437 cm-1 578 cm-1 850 cm-1 970 cm-1
CeSiO4 (this study) 416 cm-1 592 cm-1 903 cm-1 919 cm-1 431 cm-1 572 cm-1 800 cm-1 984 cm-1
New insights regarding the formation of CeSiO4
Several lessons can be extracted from the results presented in this paper, especially to explain the reasons of the formation CeSiO4 and to propose associated mechanism. First, CeSiO4 is
formed when either cerium and silicate ions are available to react in solution, e.g. using Ce(III) precursor and working at pH = 8. The mechanism of formation surely involves the existence of cerium silicate complexes in solution, as already suggested during the preparation of ThSiO4.38 Working at lower pH values
is unfavorable to the formation of CeSiO4 (and surely to the
existence of this cerium silicate complexes) consequently to the precipitation of SiO2.14 On the contrary, the precipitation
of Ce(OH)3 (and its oxidation to form CeO2) could limit the
availability of cerium for higher pH values.46 The same considerations with Ce(IV) precursor lead to conclude that the coexistence of free cerium and silicate ions in solution is not possible, which prevents the formation of CeSiO4. Moreover,
(a)
(b)
Figure 13. Speciation diagrams of Ce(III) (a) and Ce(IV) (b) determined by PhreeqC
calculations at room temperature with CSi total CCe total = 0.21 mol·L-1.
Thermodynamics data considered for these calculations are gathered in Table S3.
0 1 2 3 4 5 6 7 8 9 10 11 12 13 14 0.00 0.05 0.10 0.15 0.20 Con ce ntr ati on (mo l·L -1 ) Ce(OH)2+ Ce(OH) 3 precipitation Ce(OSi(OH)3)2+ Ce (total) Concentr ation (mol· L -1 ) pH Ce3+ 0 1 2 3 4 5 6 7 8 9 10 11 12 13 14 0.00 0.05 0.10 0.15 0.20 Ce(OH)3+ Ce(OH) 2 2+ Ce(OH)4 precipitation Ce(OSi(OH)3)3+ Ce(OH)3+ Ce (total) Con ce ntr ati on (mo l·L -1 ) pH Ce4+
Figure 12. SEM micrograph of CeSiO4 sample prepared under hydrothermal
conditions (T = 150°C, t = 20 days, Ar-atmosphere), in nitric medium, with CCe(III) CSi 1 mol·L-1 and pHinitial = 8.0 (36).
limited from a thermodynamic point of view, due to its instability compared to the mixture of CeO2 and SiO2.13
The formation of CeSiO4 from Ce(III) and silicate ions in
solution may result from the very slow in-situ oxidation of the suspected Ce(III)-silicate complex. Increasing temperature (i.e. increasing oxidation rate) induce the formation of SiO2 and
CeO2 (obtained by precipitation than ageing of Ce(OH)4). Thus,
it seems crucial to maintain Ce(IV) at a low concentration in solution in order to avoid the rapid establishment of oversaturation conditions regarding to Ce(OH)4. It is also the
reason why CeSiO4 was never prepared from Ce(IV), due to its
very strong tendency to hydrolysis. This also suggests that CeSiO4 could not be prepared as soon as CeO2 was formed. The
absence of evolution of PXRD diagrams when performing hydrothermal treatment of CeO2 + CeSiO4 mixtures at 250°C
and for large pH range support the fact that the conversion of CeO2 to CeSiO4 is unfavorable.
In order to support these observations, speciation simulations were performed using PHREEQC 2 software aiming at determining the conditions which may favor the formation of silicate-based precursor in the starting solution. Since no complexation constant was available for both Ce(III)- and Ce(IV)-silicate species, the respective constants have been extrapolated. These results were based on the apparent linear relationship reported by Thakur et al.67 between the first hydrolysis constant of a metal ion and its complexation by H3SiO4-. In order to be more representative, the constants
were calculated considering only elements showing the same oxidation state than cerium (Table S4 and Figure S8). Based on these hypotheses, the complexation constants were evaluated to logβ°(CeIII(OSi(OH)3)
2+
) = 7.8 and logβ°(CeIV(OSi(OH)3) 3+
) = 11.7.
PHREEQC 2 calculations were performed at CSi CCe =
0.21 mol·L-1 at room temperature considering the data reported in Table S2 and extrapolated for Ce(III)- and Ce(IV)-silicate species. Due to some lacks in the thermodynamic data associated to the temperatures considered for the hydrothermal treatment, simulation for higher temperatures was not possible.
The results of these simulations showed that the formation of the CeIV(OSi(OH)3)
3+
complex in the reactive media is strongly limited for Ce(IV) due to its significant hydrolysis (Figure 13). Therefore, in these conditions, the formation of Ce-silicate species appears to be strongly limited because of the formation of Ce(IV) hydroxide species and their rapid evolution to CeO2.
Due to its lower tendency to hydrolyze, Ce(III)-based system does not follow the same behavior than Ce(IV). Consequently, CeIII(OSi(OH)3)2+ complex appears as a predominant specie on a
wide pH range in reductive conditions (Figure 13). It could then be inferred that this silicate specie evolved by in situ oxidation leading to the formation of CeSiO4 while the
formation of cerium oxide is disadvantaged.
Same simulations performed in the presence of carbonate ions confirmed that the formation of CeIII(OSi(OH)3)2+ is strongly
limited by the existence of Ce(III)-carbonate complexes (Figure S9). This can explain why CeSiO4 is not formed in such
experimental conditions.
Therefore, all the speciation calculations support the key role played by Ce(III)-silicate complex during the formation of CeSiO4. However, the results have to be considered with
caution because of the poor knowledge of experimental data associated to cerium silicate complexes. This highlights the necessity of studying the aqueous chemistry of cerium in order
to thoroughly understand the mechanism of CeSiO4 formation.
Conclusions
The formation of CeSiO4 was successfully achieved from
cerium(III) precursor under inert atmosphere. The yield of CeSiO4 synthesis was found to be strongly dependent on the
concentration of the reactants and of the pH of the reactive media. The formation of CeSiO4 may also require the
formation of cerium-silicate complexes in solution. Also, temperature plays an important role in the preparation of CeSiO4, which is formed between 40°C and 150°C. The
oxidation state of cerium has a huge impact, supported by kinetic and thermodynamic considerations. Indeed, Ce(IV) concentration has to be maintained to low level in order to avoid the formation of Ce(OH)4 thus of CeO2 by ageing.
Furthermore, these observations shed new light on the reactivity of cerium(III) in the presence of silicate species in solution. With this aim, the identification of potential cerium(III) silicate species in solution, the determination of associated complexation constants and their role in the CeSiO4
synthesis, constitute key issues. Since silicate ions are abundant in environmental conditions representative of underground repository (either in granite and clay environments), such information are important to consider in order to better understand the potential reactivity of actinide in silicate rich environments, especially for plutonium.
Supporting information
Table S1 reporting the synthesis parameters for all the CeSiO4
hydrothermal syntheses presented here. Table S2 gathering the thermodynamic constants used for PHREEQC simulation.35,
54, 68
Table S3 gathering the unit-cell parameters of CeSiO4
obtained for hydrothermally synthesized samples and after 1000°C heat treatment. Table S4 gathering the M(III) and M(IV) complexation constants with hydroxide and o-silicate used to determine logβ(Ce(OSi(OH)3)2+) and
logβ(Ce(OSi(OH)3)3+).15, 35, 53, 54, 67, 69-72
Figure S1 representing the infrared spectra obtained for
samples prepared under hydrothermal conditions with starting silicate and cerium(IV) at different pH. Figure S2 representing the infrared spectra obtained for CeSiO4 samples synthesized
under hydrothermal conditions at different pH. Figure S3 representing the infrared spectra obtained for CeSiO4 samples
synthesized under hydrothermal conditions at various temperature. Figure S4 representing the infrared spectrum of CeSiO4 pure sample synthesized in optimized conditions.
Figure S5 representing the Raman spectrum of CeSiO4 pure
sample synthesized in optimized conditions. Figure S6 representing the Rietveld refinement of CeSiO4 sample
synthesized in hydrochloric acid media. Figure S7 representing the Rietveld refinement of PXRD diagram obtained after heating CeSiO4 sample above 1000°C. Figure S8 representing
the linear relationship between logβ(M(OSi(OH)3)) and
logβ(M(OH)) according to the data gathered in Table S4.
Figure S9 representing Ce(III) speciation diagram in carbonate
ions rich reactive media.
Conflicts of interest
There are no conflicts to declare.
Acknowledgements
The authors would like to thank R. Podor, J. Lautru and V. Trillaud (from ICSM) for supporting SEM experiments.
Notes and references
1. J. Felsche, Die Naturwissenschaften, 1969, 56, 325-326. 2. A. C. Tas and M. Akinc, Powder diffraction, 1992, 7, 219-222. 3. H. A. M. van Hal and H. T. Hintzen, Journal of Alloys and
Compounds, 1992, 179, 77-85.
4. A. C. Tas and M. Akinc, Journal of the American Ceramic
Society, 1994, 77, 2968-2970.
5. A. C. Tas and M. Akinc, Journal of the American Ceramic
Society, 1994, 77, 2953-2960.
6. M. Ghannadi Marageh, S. Waqif Husain, A. R. Khanchi and S. J. Ahmady, Applied Radiation and Isotopes, 1996, 47, 501-505.
7. L. Kȩpiński, D. Hreniak and W. Strȩk, Journal of Alloys and
Compounds, 2002, 341, 203-207.
8. L. Kępiński, M. Wołcyrz and M. Marchewka, Journal of Solid
State Chemistry, 2002, 168, 110-118.
9. S. Zec and S. Boskovic, Journal of Materials Science, 2004, 39, 5283-5286.
10. S. Zec, S. Bošković, Ž. Bogdanov and N. Popović, Materials
Chemistry and Physics, 2006, 95, 150-153.
11. S. Zec, S. Bošković, M. Hrovat and M. Kosec, Journal of the
European Ceramic Society, 2007, 27, 523-526.
12. C. Lopez, Ph.D. Thesis. Université de Paris XI, 2002.
13. E. D. A. Ferriss, R. C. Ewing and U. Becker, American
Mineralogist, 2010, 95, 229-241.
14. R. K. Iler, The chemistry of silica: solubility, polymerization,
colloid and surface properties, and biochemistry, John Wiley
& Sons: Hoboken, NJ, 1979.
15. V. Neck and J. I. Kim, Radiochimica Acta, 2001, 89, 1-16. 16. C. Frondel, Geological Survey Bulletin, 1958, 1064.
17. L. R. Stieff, T. W. Stern and A. M. Sherwood, Science, 1955,
121, 608-609.
18. C. Frondel and R. L. Collette, The American Mineralogist, 1957, 42, 759-765.
19. H. R. Hoekstra and L. H. Fuchs, Science, 1956, 123, 105. 20. J. Janeczek and R. C. Ewing, Materials Research Society,
Symposium Proceedings, 1992, 257, 497-504.
21. C. Hennig, S. Weiss, D. Banerjee, E. Brendler, V. Honkimäki, G. Cuello, A. Ikeda-Ohno, A. C. Scheinost and H. Zänker,
Geochimica et Cosmochimica Acta, 2013, 103, 197-212.
22. I. Dreissig, S. Weiss, C. Hennig, G. Bernhard and H. Zänker,
23. R. Husar, S. Weiss, C. Hennig, R. Hübner, A. Ikeda-ohno and H. Zänker, Environmental Science & Technology, 2015, 49, 665-671.
24. H. Zänker and C. Hennig, Journal of Contaminant Hydrology, 2014, 157, 87-105.
25. H. Zänker, S. Weiss, C. Hennig, V. Brendler and A. Ikeda-Ohno, Chemistry Open, 2016, 5, 174-182.
26. A. B. Kersting, D. W. Efurd, D. L. Finnegan, D. J. Rokop, D. K. Smith and J. L. Thompson, Nature, 1999, 397, 56-59.
27. C. Keller, Nukleonik, 1963, 5, 41-48.
28. R. J. Finch and J. M. Hanchar, Reviews in Mineralogy and
Geochemistry, 2003, 53, 1-25.
29. J. A. Speer, Reviews in Mineralogy and Geochemistry, 1980,
5, 113-135.
30. J. M. S. Skakle, C. L. Dickson and F. P. Glasser, Powder
diffraction, 2000, 15, 234-238.
31. J. Schlüter, T. Malcherek and T. A. Husdal, Neues Jahrbuch
für Mineralogie - Abhandlungen, 2009, 186, 195-200.
32. C. L. Dickson and F. P. Glasser, Cement and Concrete
Research, 2000, 30, 1619-1623.
33. C. Frontera and J. Rodriguez-Carvajal, Physica B: Condensed
Matter, 2003, 335, 219-222.
34. D. L. Parkhurst and C. A. J. Appelo, U.S. Department of
Interior; U.S. Geological Survey, 1999, Water-Resources
Investigations Report 99-4259.
35. E. Giffaut, M. Grivé, P. Blanc, P. Vieillard, E. Colàs, H. Gailhanou, S. Gaboreau, N. Marty, B. Madé and L. Duro,
Applied Geochemistry, 2014 49, 225-236.
36. A. Mesbah, S. Szenknect, N. Clavier, J. Lozano-Rodriguez, C. Poinssot, C. Den Auwer, R. C. Ewing and N. Dacheux,
Inorganic Chemistry, 2015, 54, 6687-6696.
37. P. Estevenon, E. Welcomme, S. Szenknect, A. Mesbah, P. Moisy, C. Poinssot and N. Dacheux, Inorganic Chemistry, 2018, 57, 12398-12408.
38. P. Estevenon, E. Welcomme, S. Szenknect, A. Mesbah, P. Moisy, C. Poinssot and N. Dacheux, Inorganic Chemistry, 2018, 57, 9393-9402.
39. N. Clavier, S. Szenknect, D. T. Costin, A. Mesbah, C. Poinssot and N. Dacheux, Spectrochimica Acta Part A: Molecular and
Biomolecular Spectroscopy 118, 2014, 118, 302-307.
40. N. Clavier, S. Szenknect, D. T. Costin, A. Mesbah, J. Ravaux, C. Poinssot and N. Dacheux, Journal of Nuclear Materials, 2013,
441, 73-83.
41. D. T. Costin, Ph.D. Thesis. Université de Montpellier 2, 2012. 42. D. T. Costin, A. Mesbah, N. Clavier, N. Dacheux, C. Poinssot,
S. Szenknect and J. Ravaux, Inorganic Chemistry, 2011, 50, 11117-11126.
43. D. T. Costin, A. Mesbah, N. Clavier, S. Szenknect, N. Dacheux, C. Poinssot, J. Ravaux and H. P. Brau, Progress in Nuclear
Energy, 2012, 57, 155-160.
44. S. Szenknect, D. T. Costin, N. Clavier, A. Mesbah, C. Poinssot, P. Vitorge and N. Dacheux, Inorganic Chemistry, 2013, 52, 6957-6968.
45. C. Artini, M. Pani, M. M. Carnasciali, M. T. Buscaglia, J. R. Plaisier and G. A. Costa, Inorganic Chemistry, 2015, 15, 4126– 4137.
46. B. Bouchaud, J. Balmain, G. Bonnet and F. Pedraza, Journal of
Rare Earths, 2012, 30, 559-562.
47. D. Rai, M. Yui, D. A. Moore, G. J. Lumetta, K. M. Rosso, Y. Xia, A. R. Felmy and F. N. Skomurski, Journal of Solution
Chemistry, 2008, 37, 1725-1746.
48. T. S. Neill, K. Morris, C. I. Pearce, N. K. Sherriff, M. G. Burke, P. A. Chater, A. Janssen, L. S. Natrajan and S. Shaw,
Environmental Science & Technology, 2018, 52, 9118–9127.
49. S. Szenknect, A. Mesbah, T. Cordara, N. Clavier, H. P. Brau, X. Le Goff, C. Poinssot, R. C. Ewing and N. Dacheux, Geochimica
et Cosmochimica Acta, 2016, 181, 36-53.
50. C. Riglet-Martial, P. Vitorge and V. Calmon, Radiochimica
Acta, 1998, 82, 69-76.
51. P. Vitorge, H. Capdevila and L. Delmau, L'Aquila (Italia), 1995. 52. M. H. Rand, J. Fuger, I. Grenthe, V. Neck and D. Rai, Chemical
thermodynamics of thorium, Issy-les-Moulineaux, France,
2009.
53. R. Guillaumont, T. Fanghänel, V. Neck, J. Fuger, D. A. Palmer, I. Grenthe and M. H. Rand, Update on the chemical
thermodynamics of uranium, neptunium, plutonium, americium and technetium, Elsevier, Issy-les-Moulineaux,
France, 2003.
54. S. A. Hayes, P. Yu, T. J. O'Keefe, M. J. O'Keefe and J. O. Stoffer, Journal of The Electrochemical Society, 2006, 149, C623-C630.
55. C. Frondel, United State Departement of the Interior
Geological Survey, 1953, Trace Elements Investigation
Report 327.
56. T. N. Tarkhova, N. N. Mironov and I. A. Grishin, Journal of
Structural Chemistry, 1970, 11, 515–516.
57. P. V. Klevtsov, V. M. Bembel' and Z. A. Grankina, Journal of
Structural Chemistry, 1969, 10, 543-547.
58. R. A. Zehnder, D. L. Clark, B. L. Scott, R. J. Donohoe, P. D. Palmer, W. H. Runde and D. E. Hobart, Inorganic Chemistry, 2010, 49, 4781–4790.
59. Z. Guo, F. Du, G. Li and Z. Cui, Inorganic Chemistry, 2006, 45, 4167-4169.
60. Y. V. Belovitskaya, I. V. Pekov and Y. K. Kabalov,
Crystallography Reports, 2000, 45, 26-29.
61. J. Bentzen, P. Husum and O. Soerensen, High Tech Ceramics.
Proceedings, 1987, 38, 385-398.
62. P. Dawson, M. M. Hargreave and G. R. Wilkinson, Journal of
Physics C: Solid State Physics, 1971, 4, 240-256.
63. R. W. G. Syme, D. J. Lockwood and H. J. Kerr, Journal of
Physics C: Solid State Physics, 1977, 10, 1335-1348.
64. P. W. O. Hoskin and K. A. Rodgers, European Journal of Solid
State and Inorganic Chemistry, 1996, 33, 1111-1121.
65. J. H. Nicola and H. N. Rutt, Journal of Physics C: Solid State
Physics, 1974, 7, 1381-1386.
66. R. Caruba, A. Baumer and G. Turco, Geochimica et
Cosmochimica Acta, 1975, 39, 11-26.
67. P. Thakur, D. K. Singh and G. R. Choppin, Inorganica Chimica
Acta, 2007, 360, 3705-3711.
68. D. Ferri, I. Grenthe, S. Hietanen and F. Salvatore, Acta
Chemica Scandinavica, 1983, A37, 359-365.
69. K. Spahiu and J. Bruno, SKB, 1995, SKB Technical Report
70. M. P. Jensen, Ph.D. Thesis. Florida State University, 1994. 71. R. A. Porter and W. J. J. Weber, Journal of Inorganic and
Nuclear Chemistry, 1971, 33, 2443-2449.
72. A. B. Yusov, A. M. Fedosseev and C. H. Delegard,