HAL Id: hal-01338400
https://hal.sorbonne-universite.fr/hal-01338400
Submitted on 28 Jun 2016
HAL is a multi-disciplinary open access
archive for the deposit and dissemination of sci-entific research documents, whether they are pub-lished or not. The documents may come from teaching and research institutions in France or abroad, or from public or private research centers.
L’archive ouverte pluridisciplinaire HAL, est destinée au dépôt et à la diffusion de documents scientifiques de niveau recherche, publiés ou non, émanant des établissements d’enseignement et de recherche français ou étrangers, des laboratoires publics ou privés.
Thymic Germinal Centers and Corticosteroids in
Myasthenia Gravis: an Immunopathological Study in
1035 Cases and a Critical Review
Frédérique Truffault, Vincent de Montpreville, Bruno Eymard, Tarek
Sharshar, Rozen Le Panse, Sonia Berrih-Aknin
To cite this version:
Frédérique Truffault, Vincent de Montpreville, Bruno Eymard, Tarek Sharshar, Rozen Le Panse, et al.. Thymic Germinal Centers and Corticosteroids in Myasthenia Gravis: an Immunopathological Study in 1035 Cases and a Critical Review. Clinical Reviews in Allergy and Immunology, Humana Press, 2016, pp.1-17. �10.1007/s12016-016-8558-3�. �hal-01338400�
Thymic Germinal Centers and Corticosteroids in Myasthenia Gravis:
an Immunopathological Study in 1035 Cases and a Critical Review
Frédérique Truffault 1,2,3,4 Vincent de Montpreville 5 Bruno Eymard 6 Tarek Sharshar 7
Rozen Le Panse 1,2,3,4 Sonia Berrih-Aknin1,2,3,4,8 Email: sonia.berrih-aknin@upmc.fr 1INSERM U974 PARIS France 2CNRS FRE3617 Paris France 3Sorbonne Universités, UPMC Univ Paris 06 Paris France 4AIM, Institut de Myologie Paris France 5Department of Pathology Marie Lannelongue Hospital Le Plessis Robinson 92350 France 6Department of Neuromuscular Disorders, CHU Salpêtrière Paris France 7General Intensive Care Medicine, Assistance Publique Hôpitaux de Paris, Raymond Poincaré Hospital University of Versailles Saint-Quentin en Yvelines 92380 Garches France 8UMRS 974 UPMC, INSERM, FRE 3617 CNRS, AIM, Center of Research in Myology, 105 Boulevard de l’Hôpital, Paris 75013,France
Abstract The most common form of Myasthenia gravis (MG) is due to anti-acetylcholine receptor (AChR) antibodies and is frequently associated with thymic pathology. In this review, we discuss the immunopathological characteristics and molecular mechanisms of thymic follicular hyperplasia, the effects of corticosteroids on this thymic pathology, and the role of thymic epithelial cells (TEC), a key player in the inflammatory thymic mechanisms. This review is based not only on the literature data but also on thymic transcriptome results and analyses of pathological and immunological correlations in a vast cohort of 1035 MG patients without thymoma. We show that among patients presenting a thymic hyperplasia with germinal centers (GC), 80 % are females, indicating that thymic follicular hyperplasia is mainly a disease of women. The presence of anti-AChR antibodies is correlated with the degree of follicular hyperplasia, suggesting that the thymus is a source of anti-AChR antibodies. The degree of hyperplasia is not dependent upon the time from the onset, implying that either the antigen is chronically expressed and/or that the mechanisms of the resolution of the GC are not efficiently controlled. Glucocorticoids, a conventional therapy in MG, induce a significant reduction in the GC number, together with changes in the expression of chemokines and angiogenesis. These changes are likely related to the acetylation molecular process, overrepresented in corticosteroid-treated patients, and essential for gene regulation. Altogether, based on the pathological and molecular thymic abnormalities found in MG patients, this review provides some explanations for the benefit of thymectomy in early-onset MG patients. Keywords: Autoimmune diseases, Chronic inflammation, Transcriptome, Thymic epithelial cells, Thymus, Genetic associations
Abbreviations AChR Acetylcholine receptor AIRE Autoimmune regulator BAFF B cell-activating factor BCR B cell receptor EOMG Early-onset MG ER Estrogen receptor FDC Follicular dendritic cells GC Germinal center HEV High endothelial venules IFN Interferon IL Interleukin IRF IFN-regulatory factor KO Knock-out MG Myasthenia gravis MS Multiple sclerosis PBMCs Peripheral blood mononuclear cells PLP Proteolipid protein PTPN22 Protein tyrosine phosphatase, non-receptor type 22 TCR T cell receptor TEC Thymic epithelial cell Tfh T follicular helper TLR3 Toll-like receptor 3 TREC T cell receptor excision circles Treg Regulatory T cells
Introduction Myasthenia gravis (MG) is a rare neuromuscular disorder due to antibodies directed against molecules of the neuromuscular junction. If antibodies against the acetylcholine receptor (AChR) are found in about 85 % of MG patients, there are other minor forms of MG with other autoantibodies. In approximately 5 % of MG patients, the autoreactive antibodies are directed against a protein called muscle-specific kinase (MuSK), which plays a central role in the clustering of AChRs and other postsynaptic components at the neuromuscular junction (NMJ) [1]. Recently, autoantibodies against the agrin receptor LRP4 (low-density lipoprotein receptor-related protein 4), a molecule that forms a complex with MuSK, have been detected in a small proportion of MG patients without anti-AChR or anti-MuSK antibodies [2, 3]. The development of autoantibodies in autoimmune disorders is due to a breakdown of the mechanism of tolerance associated with defects in the regulation of the immune system. However, each autoimmune pathology has specific features [4]. In MG, the best-known and more common form is the one with anti-AChR antibodies. This disease is frequently associated with thymic pathology. In young patients, thymic pathology is quite often expressed as follicular hyperplasia whereas, in older patients, the presence of thymoma is common [5]. The thymus is the site of central tolerance, the exclusive producer of T cells, and undergoes involution with aging. Thus, it remains quite intriguing that this organ could be in adults, the site of inflammation, B cell recruitment, germinal center (GC) generation, and neoangiogenesis [5].
Although it is accepted that thymic follicular hyperplasia is preferentially found in young female MG patients, very few data in the literature have analyzed the thymic pathology in a large cohort of MG patients. In this review, we will discuss the immunopathological characteristics and molecular mechanisms of thymic hyperplasia pathology, the effects of corticosteroids, and the role of thymic epithelial cells. This review is based not only on the literature data but also on pathological and immunological correlations analyzed in a cohort of 1035 MG patients without thymoma included in a French database.
Physiological Role of the Thymus
Role in Central Tolerance and Generation of T Cell Repertoire The thymus is an organ dedicated to the differentiation of T cells and the establishment of central tolerance [6]. The thymus is the primary organ responsible for the maturation of immunocompetent T cells with a diverse repertoire of antigen recognition [7]. In physiological conditions, the immune cells can raise an immune response against foreign antigens while holding immune tolerance toward self-antigens. Two principal mechanisms of tolerance have been deciphered: the central tolerance occurring in the thymus and peripheral tolerance in the secondary lymphoid tissues [8]. Central thymic tolerance is accomplished by a two-stage process. During the first stage, naive CD4 + CD8+ interact with MHC class I and II molecules displayed on thymic cortical epithelial cells. This step called positive selection leads to the protection from apoptosis of naive thymocytes whose T cell receptors (TCRs) interact with MHC molecules. The second phase is the negative selection in which thymocytes that display high-affinity receptors for self-MHC molecules expressed on antigen-presenting cells(APCs) will be deleted by apoptosis [9]. The medullary thymic epithelial cells (TEC) play an important role in this process through the expression of self-antigens that are mainly under the control of the autoimmune regulator (AIRE) [10]. Changes of the Thymus During Aging One of the most striking features of thymic physiology is its age-related involution characterized by the progressive replacement of thymic lymphoid tissue by adipocytic tissue [11, 12] and with a decrease in the size and cellularity of the organ. The thymic epithelium starts to decrease as early as the first year of human life at a rate of 3 % per year during adulthood, in parallel with an expansion of perivascular space that progressively fills with adipocytes and peripheral lymphocytes [13, 14]. It has been suggested that thymic involution is a regulated process controlled by sex hormones and thymic peptides [13, 15]. Although the thymus has been considered to be inactive during adult human life, several works tend to show that this is not the case. First of all, lymphoid areas could be found in elderly thymuses [14, 15]. Second, the human thymus can sustain T cell differentiation during adult life. Indeed, the reconstitution of a lympho-epithelial framework was demonstrated in the young and adult thymus up to 36 years old, at various times after bone marrow transplantation [16]. Third, although the cellular density decreases significantly with age, it remains meaningful in post-puberty thymuses. A detailed phenotypic analysis of thymuses at various ages (from 1 week to 49 years) has shown no significant variation according to the age of donors in the distribution of the main thymocyte subsets in both precursors and more mature T cells. Also, the percentage of B cells determined by the expression of CD19 is very low (mean
value 1.3 ± 0.6 %), and no correlation between the percentage of B lymphocytes and the age of donors is observed [11]. Another way to measure thymic activity is the measurement of T cell receptor (TCR) excision circles (TREC) in the periphery. During T cell development, recombination of gene segments encoding the variable parts of the TCR-α and -β chains generates the TCR diversity. During this process, the TRECs are produced. As these molecules are lost upon further cell divisions, the quantification of TRECs in the blood reflects the proliferative history of T cells at the population level [17]. Several studies have shown that the TREC number decreases with age [18], and even at the age of 100 years, there is still a significant number of TRECs, suggesting a significant thymic activity [19]. Age-related thymic involution directly correlates with the decrease in thymopoiesis and with that of TREC number measured in the periphery. The number of TRECs has been shown to display a sexual dimorphism. In humans, females have significantly higher sjTREC levels than age-matched males aged between 20 and 60 years old, with a maintained but less significant difference after the age of 60 [20] [18]. Together, these data indicate that in adults, the thymus is still active, as shown by the number of lymphocytes it contains, as well as by the presence of recent thymic emigrants assessed by TREC level in the peripheral blood lymphocytes.
Thymic Follicular Hyperplasia: Clinical and Immunological
Associations
As indicated above, the thymus in adults is generally involuted and contains a limited number of cells, even if some areas of thymopoiesis are detectable [21]. Why and how aninvoluted thymic tissue becomes the site of hyperplasia and allows the development of lymphoid follicles including a large number of B cells is still a mystery. Also, the incidence of thymic hyperplasia in MG is still confusing. In the literature, the percentage of patients with thymic hyperplasia varies from 28 [22] to 92 % [23]. This high variability is probably due to clinical and epidemiological features that could influence the degree of follicular hyperplasia. These parameters likely include the age, the sex, corticosteroid treatment, and the extent of involution of the thymus. In this review, we have performed a study of MG patients who have undergone thymectomy in the Marie Lannelongue Hospital between 1980 and 2015, but without thymoma. Altogether, the whole group of patients includes 1035 MG patients (780 F, 255 M). Since we previously showed that corticosteroids can reduce the number of GCs [24], we first analyzed the immunopathological data, after excluding patients treated with corticosteroids. A particular chapter on the effects of corticosteroids is included in a later section. The degree of follicular hyperplasia was graded as follows: zero (no GCs), one (few GCs), two (many GCs), and three (numerous GCs). A clear association between the thymic follicular development and the age of the patients is shown in Fig. 1a: the youngest patients display the highest degree of follicular hyperplasia while the older patients (over 50) display a low degree of hyperplasia. Similar observation was done when analyzing the lymphocyte/adipous (L/A) ratio (Fig. 1b). This ratio evaluated by the pathologists of the Marie Lannelongue Hospital signifies the degree of involution of the thymus. A high ratio (superior to 0.7) indicates an abundant lympho-epithelial thymus while a low ratio (inferior to 0.4) indicates a poverty of lymphocytes and the replacement by adipose and connective tissue. Thus, there is a strong correlation
between the follicular hyperplasia and the L/A ratio (r = 0.3334, p < 0.0001). The representation of the L/A ratio according to GC number suggests that GCs need a favorable lympho-epithelial-rich environment to develop as the mean value of the L/A ratio (±SD) varied from 0.50 ± 0.26 in the group GC0 to 0.73 ± 0.15 in the group GC3. The groups GC1 and GC2 had intermediate L/A values (Fig. 1c). Fig. 1 Degree of thymic hyperplasia and L/A ratio in relation to age. a A total of 789 corticoid-untreated MG patients were divided in five groups, according to the age <20 years, n = 143; 21–30 years, n = 259; 31–40 years, n = 195; 41–50 years, n = 100; and >50 years, n = 92. The degree of hyperplasia was graded as follows: no GC = O; few GCs = 1; many GCs = 2; numerous GCs = 3. A clear correlation between the grade of hyperplasia and the age could be observed. b A similar analysis was done on the L/A (lymphocytic/adipous) ratio that is determined by the surface occupied by the lympho- epithelial area among the total tissue. This value is between 100 % (only lympho-epithelial tissue) and 0 (only adipous and connective tissue). Because of missing data, the number of cases here is 419 corticoid-untreated MG patients (<20 years, n = 78; 21– 30 years, n = 140; 31–40 years, n = 119; 41–50 years, n = 49; and >50 years, n = 33). The data are represented as the mean value ± SEM. A clear correlation between the L/A ratio and the age could be observed (p < 0.0001). c Correlation between the L/A ratio and the degree of hyperplasia. The mean value of L/A ratio was calculated for each subgroup of patients according to the GC number. The number of patients in each age group is as follows: GC0, n = 123, GC1 n = 130, GC2 n = 104, GC3 n = 46. The group GC0 is significantly different from the other groups. d Analysis of GC0 as a function of age. The percentage of GC0 was calculated from the 789 corticoid-untreated MG patients. Confirming the data shown in Fig. 1a, most patients older than 50 years do not display any GC while this percentage is much lower in the other age categories. The data are
represented as the mean value ± SEM. The non-parametric Kruskal-Wallis ANOVA test followed by Dunn’s multiple comparisons tests was used for figures a, b, and c These data suggest that patients over 50 (with a very low L/A ratio) are at lower risk of developing follicular hyperplasia. Indeed, in the group of patients over 50 (n = 68), 74 % do not have any GC detectable in their thymus, while in the younger groups, the percentage of GC0 is much lower. It is around 20 % in the three groups before 40 years, and 44 % in the group from 40 to 50 years. There is a clear break after 50 years (Fig. 1d).
Thus, this analysis emphasizes the links between the grade of the follicular hyperplasia, the L/A ratio, and the age of the patients. Thymic Hyperplasia Is Mainly a Disease of Young Women We then analyzed the strength of the interactions between thymic follicular hyperplasia, gender, and age. In this investigation, we excluded patients without GC to focus the analysis in patients presenting an abnormal follicular hyperplasia (GC1, GC2, and GC3). Figure 2 shows striking differences between the curve of females and males. Males display more or less a flat curve according to age while females have a clear peak between 20 and 40 years. The female to male ratio is around 4 below the age of 30; it peaks at the age of 40 years, with a ratio of 8.7, and decreases to a ratio lower than two after the age of 50 years. Fig. 2 Frequency of males and females with follicular hyperplasia (GC1, GC2, GC3) according to age. The distribution of male and female patients according to age shows a much higher number of females particularly until the age of 40. The ratio F/M is 3.5 around the age of 20, about 5 between the age 30–40, and decreases to less than 2 after the age of 50. As a result, a clear peak around 20–40 years is observed in females, while the curve in males is rather flat. Of note, this analysis excludes the patients with GC0. A total of 557 MG patients is included here.
Altogether among patients presenting a thymic follicular hyperplasia, 80 % are women, which strengthens the notion that thymic follicular hyperplasia is mainly a disease of females, but our data highlight that the sexual dimorphism is age-dependent since the female/male ratio is reduced after the age of 50. This sexual dimorphism is possibly related to sexual hormones since the gender bias is reduced at the postmenopausal years (after the age of 50), where the hormonal impregnation is very much reduced. The relationship between the hormonal status and B cell development and function has already been underlined. First, females produce elevated levels of antibodies in both physiological and autoimmune conditions [25]. This observation was confirmed in this study where the amount of anti-AChR antibodies was significantly higher in females than males (not shown). Second, the production of naive B lymphocytes in bone marrow is reduced during pregnancy or after experimental elevation of estrogen [26]. Third, BAFF that increases the survival of plasmablasts, stimulates peripheral B cell proliferation, antibody production, and isotype class
switching [27] has a greater expression in immune cells isolated from C57BL/6 females compared with male mice [28]. Estrogens appear to be involved in this gender bias. Indeed, estrogens have a stimulatory and protective effect on B cells [29] and immunoglobulin production [30]. They also modulate antigen presentation and enhance B cell responses by increasing survival of autoreactive B cells [30, 31]. In mice, estrogens increase the survival of autoreactive B cells, thus contributing to disease severity in the model of arthritis [32, 33]. Also, a link among autoimmunity, the formation of GCs, and estrogen receptors (ERs) has been previously reported. Indeed, ER-α KO mice display severe infiltration of B lymphocytes into the kidney and spontaneous formation of GCs in the spleen [34]. Another actor that could contribute to the sexual dimorphism is the subpopulation of suppressor myeloid Gr-1(high)CD11b + cells that is testosterone regulated. The deletion of this cell subset in male (NZBxNZW)F1 mice induces increased levels of antibodies and development of GCs [35], suggesting that this cell subset does not have the same functions in male and female (NZBxNZW)F1 models. Altogether, the female bias observed for thymic follicular hyperplasia is likely due to the balance between estrogen and testosterone and their effects on immune cells and molecules. Thymic Follicular Hyperplasia: a Source of Anti-AChR Antibodies One of the major still unanswered questions in MG disease is the potential link between the thymic pathology and the antibodies to AChR.
The anti-AChR antibodies are a crucial element of diagnosis, as false positive are very uncommon [1]. Also, anti-AChR antibodies play a major role in the pathogenic mechanisms in both passive and active models of EAMG [36]. In this study, we have evaluated the levels of antibodies to AChR according to the degree of thymic hyperplasia. First, we compared the level of hyperplasia in the seropositive and seronegative MG patients, by dividing the patients into five groups: (1) seronegative (<0.5 nM), seropositive/low (0.5 to 5 nM), seropositive/intermediate (5 to 20 and 20– 50 nM), and seropositive/high (>50 nM) (Fig. 3a). The mean value of GC grade is very low in the seronegative and seropositive/low groups, but it reaches a plateau as early as the serum titer is higher than 5 nM. The percentage of GC0 was less than 10 % for the seropositive/intermediate and high groups, about 30 % for the seropositive/low and 52 % for the seronegative group. Fig. 3. Anti-AChR antibody titer and time from onset as a function of follicular hyperplasia (a). When the seropositive patients were divided according to the level of anti-AChR antibodies (<0.5 nM, n = 155; 0.5–5 nM, n = 188; 5–20 nM, n = 166; 20– 50, n = 100; >50, n = 173), a clear positive correlation could be observed. The level of anti-AChR antibodies was correlated to the degree of hyperplasia (p < 0.0001) (b). Conversely, when the seropositive patients (>0.5 nM) were divided into several groups, according to the grade of follicular hyperplasia, the level of antibodies was much lower in the GC0 group compared to the other ones. GC1 group had intermediate level of anti-AChR antibodies. Of note, the patients with titers lower than 0.5 nM were excluded, as they could have represented a cofounding factor (c). The time between the onset of the disease and thymectomy was evaluated in most patients, and the mean value was calculated for each group of patients according to the degree of follicular hyperplasia.
The time from onset is not correlated with the GC grade. The data are represented as the mean value ± SEM. The non-parametric Kruskal-Wallis ANOVA test followed by Dunn’s multiple comparison tests was used for figures a, b, and c.
To go further in the correlation between GC grade and anti-AChR antibodies, we performed the reciprocal analysis in the seropositive group of MG patients (higher than 0.5 nM). A correlation was found between the level of antibodies and the grade of the follicular hyperplasia. The p value was <10-20 in the group of seropositive MG patients (n = 555) (non-parametric Spearman correlation test). Accordingly, when the group of patients was divided into four categories according to the grade of GCs, it appears that patients with GC0 have significantly lower titer than the other groups (p < 0.0001 versus GC1, GC2, or GC3). The GC1 group has an intermediate level of antibodies compared to the GC2 and GC3 groups that had similar levels of anti-AChR antibodies (Fig. 3b). These results confirm a correlation between the level of anti-AChR antibodies in the sera and the degree of follicular hyperplasia. The links of thymic hyperplasia with anti-AChR antibodies have been suggested by several arguments from the literature: (1) Our previous analysis of clinical links between thymus pathologies and anti-AChR antibodies has shown that patients with thymic hyperplasia have higher titer than thymoma or involuted thymuses [37], but in that study, the degree of hyperplasia was not analyzed, and the number of patients was limited; (2) thymic B cells produce anti-AChR antibodies in vitro [38, 39]. Besides, thymic B cells are activated and do not require additional activation to produce anti-AChR antibodies [40]; (3) specific activity (anti-AChR/total IgG) is higher in the thymus compared to the other immune organs [41, 42]; (4) finally, immunodeficient mice grafted with MG thymic tissue or dissociated thymic cells have anti-AChR antibodies in the serum [43, 44]. The current analysis strengthens and extends these studies by showing a link between the degree of follicular hyperplasia and the serum level of anti-AChR antibodies. This
correlation strongly suggests that the anti-AChR antibodies are at least partially produced by the thymus, and this hypothesis is also supported by the observation that most seronegative MG patients do not have any GCs. However, the reduction in the anti-AChR antibody titer after thymectomy is not striking [45, 46], possibly because, plasma cells and memory B cells are not only located in the thymus but also in the other immune organs, including peripheral blood, lymph nodes, and bone marrow. Chronic Development of Ectopic GCs in MG Patients Another question that is still unanswered is the relationship between the degree of hyperplasia and the duration of the symptoms; in other words, we wondered whether the thymic GCs are developed at the beginning of the disease or if they accumulate with the duration of the disease. The analysis of the correlation between the duration of the signs and the GC number did not show any significant correlation (Fig. 3c). There was a tendency for a longer duration in the groups with no and few GC while the groups GC2 and GC3 had a slightly shorter duration. These results suggest that GC formation is rather an early event and that the chronicity of the disease reduces slightly but not significantly the GC number. In physiological conditions, the development of GCs is induced within 3 days after T cell-dependent antigen immunization. Then, B cells form foci of antibody-producing cells in the T cell zone or move to a network of follicular dendritic cells (FDC) in primary follicles where they proliferate. After a few weeks, GC reactions disappear, and the involved FDC remain within the primary follicles [47]. The high level of follicular hyperplasia in AChR-MG patients, whatever the duration of the disease, assumes that B cells migrate to the thymus continuously and suggests that the resolution of GCs in the MG human thymus is not correctly controlled. Several hypotheses could explain the
chronic maintenance of the GCs: (1) the permanent presence of the antigen. Indeed, it was shown that the persistence of an antigen contributes to the maintenance of the interactions between T follicular helper (Tfh) and B cells in the GC structures [48]. The antigen (AChR) is known to be present in the thymus [49, 50]. (2) A defect in apoptosis within the GC is also a possibility. The phase of resolution of the GCs is associated with higher apoptosis and with big macrophages engulfing B cells [51]. Bcl-2 is not expressed in GCs of control tonsil but is highly expressed in thymic GCs of MG patients, suggesting a protection toward apoptosis of these cells [52]. (3) Finally, a defect in Treg cells could also contribute to the maintenance of the GCs. It was previously shown that disruption of Treg cells has a significant impact on the development of the GCs [53]. Since Treg cells in MG thymus are severely defective, they may be unable to control the resolution of the B cell immune reaction and the disappearance of the GCs. Altogether, our data show that the extent of the GC development is not dependent upon the duration of the disease, highlighting the chronicity of the process. Patients with an onset of 20 years could still have a significant number of GCs, suggesting that either the antigen is chronically expressed and/or that the resolution of the autoimmune response is not efficiently controlled. Thymic Follicular Hyperplasia: Molecular Mechanisms The presence of ectopic or tertiary lymphoid follicles in MG is highly reminiscent of what is observed in the target organ of other inflammatory autoimmune diseases. Indeed, B cell expansion or lymphoid structures resembling secondary lymphoid organs develop in many AIDs [54]. They can be found in the thyroid in Hashimoto’s thyroiditis patients [55], in salivary glands in SS patients [56], in synovium in RA patients [57], in cerebrospinal fluid in MS patients [58], in the liver in PBC patients [59], in the muscle in
dermatomyositis and polymyositis patients [60], and in the blood in SLE patients [61]. These structures promote antigen-specific humoral responses during chronic inflammation in the diseased organ. In MG, there is no evidence of a B cell response in the muscle considered as the target organ, but the increased B cell number and the lymphoid follicles are found in the thymus in early onset MG patients [62] (Fig. 2). It is, therefore, tempting to speculate that the thymus is the main pathogenic organ in MG-AChR. Highly Active Antigen Presentation in MG Thymus To approach the molecular mechanisms occurring in the thymus of MG patients, we used the DNA microarray approach, a technology that represents a powerful tool to compare genome features among individuals at the tissue and cell levels [63, 64]. In a transcriptome analysis, we investigated the molecular processes overrepresented in MG follicular thymic hyperplasia compared with age- and sex-matched control thymus. The methods used for the analysis have been previously detailed [65, 66]. By combining the list of molecular processes with that of cellular components (Tables 1 and 2), it appears that the genes involved in the process of antigen presentation via MHC antigens class II molecules (Table 1) combined with genes related to lysosome and Golgi apparatus (Table2) are particularly over-represented in MG thymus compared to normal thymic samples. Presumably, a response to external stimulation will cause a sustained antigen presentation process and lead to an antigenic response including the production of anti-AChR antibodies. The autoantigen (AChR) is expressed in different thymic cell types, namely myoid and epithelial cells. Myoid cells located in the medullary thymic areas have characteristics of precursors of muscle cells, contribute to T cell maturation and survival [67], and express muscle genes including the different AChR subunits [68].
However, myoid cells are not the unique cells to express AChR. We have previously described that medullary TECs (mTECs) express some of the AChR subunits [49].
Table 1. Main biological processes modified in the thymus of MG patients
Term Gene
number Fold enrichment p value Antigen processing and presentation of peptide or polysaccharide antigen via MHC class II 9 5.12 0.000074 Lymphocyte activation 37 1.86 0.00021 Antigen processing and presentation 15 2.77 0.00047 Leukocyte activation 40 1.67 0.0011 Immune response 81 1.38 0.0016 Negative regulation of cell adhesion 11 2.71 0.0045
Table 2. Main cellular components altered in the thymus of MG patients Term Gene number Fold enrichment p value Golgi membrane 34 2.16 0.000016 Golgi apparatus part 45 1.89 0.000024 MHC class II protein complex 7 5.11 0.00082 Melanosome 20 2.06 0.0025 Lysosome 31 1.68 0.0041 MHC protein complex 9 2.99 0.0064 The external stimulation that could occur in MG patients is not yet defined, but it has been shown that the thymus is the potential site of various infections [69]. We have previously observed that the agonist of TLR3 has striking effects in TECs. It induces an increased cytokine and chemokine production together with a huge augmentation of α-AChR expression [70]. Therefore, an external stimulation such as a viral infection could favor the overexpression of AChR and its processing and presentation. Several cathepsins are involved in antigen processing and degradation of the invariant chain and thereby in antigen presentation by HLA class II molecules [71]. Interestingly, Tolosa et al. observed a higher expression of cathepsin V in thymuses from MG patients compared with controls [72], thus supporting a highly active process of antigenic presentation in the thymus of MG patients. This hypothesis is also strengthened by
recent findings showing the recruitment of antigen-presenting cells (APCs) inside and around thymic high endothelial venules (HEVs) located in proximity to GCs and that are in high numbers in the thymus of MG patients [73]. Links with Other AIDs The transcriptome analysis also shows an interesting similarity between the thymic pathology of MG and other autoimmune diseases (Table 3). This similarity was found in the category of “Genetic Association Database” that includes genetic association data from complex disorders. This analysis indicates that many genes of predisposition are common for MG and other autoimmune diseases such as SLE, Sjogren’s syndrome, thyroiditis, or multiple sclerosis, although the immunological mechanisms involved in these diseases are dissimilar. A detailed analysis of the genes involved in these diseases identified 16 genes deregulated in the thymus of patients, known to be genetically associated with at least three other different autoimmune pathologies. Table 4 lists these genes. They are basically genes involved in the immune response (HLA-DR and DQ, CD14, CD19), a costimulatory gene (CD80), cytokine (IL-1B), and chemokine (CCL-5), but also a gene involved in oxidative stress (NOS) and the protein tyrosine phosphatase, non-receptor type 22 (PTPN22). Most of these genes are genetically associated with MG [74]. However, the finding here that the level of expression of these genes was deregulated in MG thymus suggests a link between the genotype and the functional phenotype. We will focus more particularly on the potential role of PTPN22 as this gene is genetically associated with more than 20 autoimmune diseases [75, 76, 77].
Table 3. Genetic association pathways shared with MG
Term Gene
number Fold enrichment p value
Systemic lupus erythematosus 24 2.04 0.00071 Graves’ disease 11 2.84 0.0027 Crohn’s disease 14 2.22 0.0065 Multiple sclerosis 30 1.58 0.0092 Celiac disease 14 2.03 0.014 Cirrhosis. biliary primary 7 2.87 0.025 Sarcoidosis 11 2.07 0.030 Sclerosis. systemic 10 2.18 0.030 Crohn’s disease ulcerative colitis 10 2.11 0.037 Sjogren’s syndrome 7 2.57 0.043 A similarity was found in the category of “Genetic Association Database” that is a database of genetic association data from complex diseases and disorders. Diseases that show significant association with MG are listed
Table 4. List of the genes deregulated in MG as well as in other autoimmune diseases
Entrez-Id Name Number
ofdisease s Change inMG 929 CD14 molecule 3 UP 930 CD19 molecule 3 UP 941 CD80 molecule 4 DOWN 6352 Chemokine (C-C motif) ligand 5 4 UP 356 Fas ligand (TNF superfamily, member 6) 4 UP 3383 Intercellular adhesion molecule 1 5 DOWN 3659 Interferon regulatory factor 1 4 DOWN 3553 Interleukin 1, beta 6 UP 3117 Major histocompatibility complex, class II, DQ alpha 1 6 UP 3119 Major histocompatibility complex, class II, DQ beta 1 9 UP 3122 Major histocompatibility complex, class II, DR alpha 5 UP 3123 Major histocompatibility complex, class II, DR beta 1 10 UP 4846 Nitric oxide synthase 3 (endothelial cell) 4 UP 4790 Nuclear factor of kappa light polypeptide gene enhancer in B-cells 1 4 DOWN 26191 Protein tyrosine phosphatase, non-receptor type 22 (lymphoid) 9 DOWN 7421 Vitamin D (1,25- dihydroxyvitamin D3) receptor 3 UP The number of diseases presenting the deregulated genes is shown. Whether the expression of gene is upregulated or downregulated in MG is indicated in the last column
PTPN22 known as LYP in humans and PEP in mice is a powerful inhibitor of the T cell receptor signaling pathway [78]. PTPN22 encodes for the lymphoid protein tyrosine phosphatase (Lyp) which is expressed exclusively in immune cells. PTPN22 is a negative regulator of T cell activation via its dephosphorylation of the activating tyrosines of Lck, Fyn, and ZAP-70 and of phosphorylation sites on TCRζ, CD3ε, Vav, and Valosin-containing protein [79]. The importance of PTPN22 in lymphocyte activation has been confirmed in the PTPN22-deficient mice. These mice accumulate effector-memory T cells in peripheral lymphoid tissues, which cause lymphadenopathy and splenomegaly. Furthermore, T cells from these deficient mice have increased TCR-induced phosphorylation of tyrosine residues and cellular activation. Also, while no intrinsic B cell abnormality was observed, these mice develop more germinal centers and high serum concentrations of antibodies [80]. In humans, a single base change in the coding region of this gene (C1858T) resulting in an arginine to tryptophan amino acid substitution at position 620 (R620W) is observed at a high frequency in patients affected by autoimmune diseases [75]. The disease incidence is up to 2.5-fold higher in carriers of the C1858T mutation compared to those without the mutation. Disease susceptibility affects humans homozygous for this mutation but also heterozygous carriers albeit at a lower extent. This mutation leads to a decrease in TCR and BCR signaling [76]. Also, carriers of this PTPN22 risk allele display high frequencies of autoreactive B cell clones compared with those from non-carriers, suggesting defective central and peripheral B cell tolerance checkpoints [76]. In MG patients, the W620 allele was found associated with the disease, and the W620 carriers showed a significantly higher number of autoantibody-producing cells than non-carriers when incubated with the AChR autoantigens [78]. In the current
transcriptome study, the expression of PTPN22 was found to be decreased in the MG thymus compared with age- and gender-matched controls (Table 4). Interestingly, humans carrying the PTPN22 R620W polymorphism have been suggested to have a greater proportion of PTPN22lo T and B cells than those carrying wild-type PTPN22 [81]. This observation suggests that the R620W substitution might affect human PTPN22 expression. It is tempting to speculate that the decreased expression of PTPN22 in the thymus of MG patients is related to the increased B cell number and GCs, resembling the data observed in PTPN22 KO mice. Besides, in these KO mice, T follicular helper cells proliferate and accumulate to a greater extent and display increased production of IL-21 compared with WT mice [82]. These features are analogous to the ones observed in MG thymus that shows in addition to ectopic GCs, an increased number of Tfh and higher production of IL-21 [83, 84].
Effects of Corticoids on Follicular Hyperplasia
Natural and synthetic glucocorticoids remain major anti-inflammatory and immunosuppressive therapies. Corticosteroid, especially prednisolone, is the treatment of choice for many MG patients [85, 86]. However, its clinical efficacy is limited by its severe side effects, particularly during long-term treatments, including osteoporosis, increased risk of infections as well as triggering or worsening of diabetes. Corticosteroids Reduce the Degree of Follicular Hyperplasia, Together with Reduction of the Lympho-epithelial Parenchyma We have previously demonstrated that corticosteroids reduce the surface and the number of GCs, by using immunofluorescence on sections of MG thymus in a small number of female patients [24]. Extending that study, we compared here in our largecohort of patients the degree of hyperplasia in corticosteroid-treated (n = 125) and untreated patients (n = 638). Since seronegative patients could induce a bias in the analysis, they were excluded in the current analysis. Figure 4a shows the mean values of the grade of hyperplasia in all patients or divided according to the sex. In the whole group of patients, the decrease by corticoids of the GC grade was highly significant (p < 0.0001), but that was principally due to the female group. Indeed in females, the decrease in the number of GCs in corticoid-treated patients was very marked (p < 0.0001) from 1.28 ± 0.91 to 0.70 ± 0.86 (mean ± SD), while in males, there was only a trend (from 0.97 ± 1.0 to 0.62 ± 0.94) that was not significant (p = 0.10). Analysis according to the different grades of hyperplasia shows that when treated with corticosteroid, most patients had a GC0 grade (X2 = 20.1, p < 0.0003) (Fig. 4b). Fig. 4. Effects of corticosteroids on follicular hyperplasia and L/A Ratio (a). The GC grade is clearly lower in corticosteroid-treated patients compared with untreated patients (p < 0.0001). This effect is clearly due to females. The effect is slight and not significant in males (b). The distribution of the patients according to the degree of the follicular hyperplasia shows that the number of patients with GC0 is increased, while the number of patients with GC2 or GC3 is decreased in patients treated with corticosteroids compared to untreated patients (p < 0.0003, X2 test) (c). The corticosteroids have a significant effect on the L/A ratio (p < 0.0001). The effect is highly significant in females but not in males. The data are represented as the mean value ± SEM (in a and c). The non-parametric Kruskal-Wallis ANOVA test followed by Dunn’s multiple comparison tests was used for figures a and c. The X2 test was used for figure b
Very few articles have analyzed the effects of corticosteroid on the development of GCs, and they were performed in animal models or in vitro. Rescue of GC cells from human
tonsils was shown to be blocked in vitro by the glucocorticoid prednisolone at pharmacological concentrations [87]. A transgenic mouse model of chronic stress in which corticotropin-releasing hormone (CRH) is overexpressed in the central nervous system has been created to mimic patients treated with chronic systemic glucocorticoids [88]. These mice have severe perturbations in leukocyte populations, with a predominant decrease in B cell populations [89]. Interestingly, they display standard pre-immune antibody titers and primary IgM responses to immunization but have a poor isotype switching and an altered antibody repertoire upon secondary immunization. Also, in these CRH-transgenic mice as well as in mice treated with exogenous corticosterone, their GC formation after immunization was compromised, and follicular dendritic cell networks were altered. These data indicate that corticosterone treatment alters antigen–antibody complex trapping ability during an immune response [90]. We showed (Fig. 3a, b) a relationship between the degree of hyperplasia and the serum level of anti-AChR antibodies, and yet, although corticosteroids reduce the grade of thymic follicular hyperplasia, it has no significant effect on anti-AChR antibodies (not shown). In support of these results, our previous transcriptome analysis revealed that the expression of the Ig genes spotted on the arrays was not reduced upon corticotherapy [66]. Thus, at the cell level, it is likely that corticosteroids prevent the formation of GCs but do not prevent the thymic B cells from producing antibodies. Since the GC is the site of isotype switching, we assume that the inhibition of GC formation will have an impact on this process, resulting in the production of less pathogenic antibodies. The pathogenic antibodies in AChR-MG are of IgG1 and IgG3 subclasses and can bind the complement [91]. It is, therefore, possible that corticosteroid therapy reduces the
production of these specific IgG subclasses, but this hypothesis deserves to be investigated. Also, corticosteroids have a strong effect on the L/A ratio in the thymus (p < 0.0001) (Fig. 4c). In the whole group of patients, the mean ratio decreases from 61.3 ± 22.0 to 47.6 ± 24.6 % (mean ± SD), although the age was similar (28.9 versus 28.2 years), suggesting that the corticosteroid-induced changes were not limited to the GCs but also includes the lympho-epithelial tissue. Again, the effect was highly significant in females (p < 0.0002), but not in males (p = 0.12). This effect on thymic parenchyma is supported by data showing that corticosteroids profoundly alter human thymocyte subsets [92], as well as thymocytes in mice [93]. These data indicate that corticosteroids reduce the number of GCs together with a reduction of the L/A ratio, although they do not have a direct effect on the whole level of the anti-AChR antibody production. Molecular Mechanisms of Action of Corticosteroids Glucocorticoids are known to inhibit the expression of multiple activated inflammatory genes that encode for cytokines, chemokines, adhesion molecules, inflammatory enzymes, and receptors [94]. Glucocorticoids regulate many physiological processes through genomic and non-genomic effects. To approach the molecular mechanisms of action of corticosteroids, we used the DNA microarray approach as described above, by comparing thymuses from untreated patients with patients treated with corticosteroids. Effects on Inflammation and Angiogenesis Our transcriptome analysis of the human thymus allowed us to discover potential signaling pathways targeted by glucocorticoids. Indeed, we showed that while type I and
type II IFN-induced genes were increased in MG thymuses [66, 95], glucocorticoid-treated patients showed a normalization of the expression of type I IFN-induced genes, but not of type II IFN-induced genes. Since type I IFN can reduce the threshold for B cell induction [96,97], the reduction in type I IFN by glucocorticoid could limit the effects on B cells although our transcriptome analysis did not detect changes in the level of expression of IgG production [66]. By contrast to untreated MG patients, glucocorticoid-treated patients were shown to display normalized levels of the chemokines known to orchestrate GC formation in secondary lymphoid organs, namely CXCL13, CCL21, and CCL19 [24, 66]. Also, we demonstrated that corticosteroid treatment tended to normalize the number of high endothelial venules (HEVs) in correlation with decreased number of GCs [73]. Thus, by reducing the number of HEVs and production of chemokines that are able to attract T and B cells in the thymus, corticosteroids probably limit the entry in the thymus by activated cells and prevent the formation of novel GCs. However, it is possible that the GCs already present pursue their life and disappear after several weeks. Principal biological Processes Altered by Corticoids Completing the microarray analysis, we summarize in Table 5 the main biological processes overrepresented in the corticosteroid-treated group compared to the untreated patients. As expected, several categories linked to response to several types of stimulus (protein, organic, inorganic), cell proliferation and metabolism were overrepresented, but other sets such as skeletal system development and regulation of epithelial cell proliferation were observed. The significance of the skeletal muscle development category is unclear, but the effects of glucocorticoids on regulation of
protein metabolism in skeletal muscle are well known [98]. Myoid cells that are similar to myoblasts are present in the medullary area of the thymus and express high levels of AChR [68]. It is, therefore, possible that glucocorticoids also act on these cells, in addition to their effects on T, B, and epithelial cells. Table 5. Main biological processes modified by corticotherapy in the thymus of MG patients Term Gene number Fold enrichment p value Response to protein stimulus 27 2.56 0.000007 Macromolecular complex assembly 76 1.49 0.00028 Energy derivation by oxidation of organic compounds 26 2.12 0.00031 Cellular respiration 19 2.38 0.00062 Response to inorganic substance 34 1.80 0.00084 Response to organic substance 92 1.38 0.00092 Skeletal system development 43 1.66 0.0010 Regulation of cell proliferation 94 1.37 0.0010 Immune system development 39 1.69 0.0011 Actin filament organization 15 2.53 0.0015 Regulation of epithelial cell proliferation 15 2.43 0.0023 By analyzing in detail the list of genes deregulated in corticosteroid-treated and -untreated MG patients, we showed that only 5 % of the glucocorticoid-modulated genes were overlapping with the genes dysregulated in MG [66]. This observation indicates
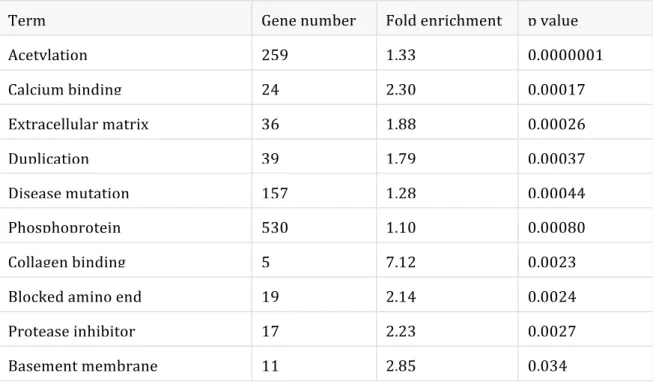
that glucocorticoid treatment alters the expression of a large number of genes that have never been shown to be involved in MG thymus defects. Whether the deregulation of some of these genes justifies the broad adverse effects of glucocorticoid treatment or contributes to the therapeutic effects is not known. Evidence of Acetylation Process Our transcriptome analysis also revealed that acetylation is the molecular process that underwent the most significant changes in the group of corticosteroid-treated patients (pvalue <10−7) (Table 6). Although, in our study, we have not directly validated the biological significance of this process, literature data support it strongly. Indeed, it was shown that histone acetylation is an important mechanism of action of glucocorticoids on inflammatory genes. Table 6. Main keywords associated with the effects of corticotherapy in the thymus of MG patients
Term Gene number Fold enrichment p value
Acetylation 259 1.33 0.0000001 Calcium binding 24 2.30 0.00017 Extracellular matrix 36 1.88 0.00026 Duplication 39 1.79 0.00037 Disease mutation 157 1.28 0.00044 Phosphoprotein 530 1.10 0.00080 Collagen binding 5 7.12 0.0023 Blocked amino end 19 2.14 0.0024 Protease inhibitor 17 2.23 0.0027 Basement membrane 11 2.85 0.034
Glucocorticoids act through the glucocorticoid receptor, a member of the steroid receptor superfamily of ligand-activated transcription factors. Upon binding to glucocorticoid, glucocorticoid receptors located in the cytosol are translocated to the nucleus where they exert transcriptional effects. Activation of glucocorticoid-responsive genes involves recruitment of co-activator proteins that acetylate core histones, resulting in chromatin remodeling and initiation of transcription by RNA polymerase II resulting in gene activation [99]. Acetylation of glucocorticoid receptors occurs before nuclear translocation. The acetylated glucocorticoid receptors are deacetylated by histone deacetylase 2 (HDAC 2), which is necessary for glucocorticoid receptors to be able to inhibit NF-kB activation of inflammatory genes, hence promoting its anti-inflammatory actions [100]. Reduced HDAC2 activity and expression are reduced in some diseases where patients respond poorly to corticosteroids [101]. Glucocorticoid receptors are expressed in thymic T cells, at higher levels than T cells isolated from the spleen [102]. Our data indicate that the effects of glucocorticoids were more striking in females than in males, for both the follicular hyperplasia and the L/A ratio. A potential explanation is a difference in the amounts of glucocorticoid receptors in the thymus of male and female that has been investigated in rats [103]. The concentrations of glucocorticoid receptors are lower in females. As a result, it is possible that these receptors are more easily saturated in females than in males. One can speculate that higher doses of corticosteroids are necessary for males to obtain similar effects as in females. Also, women have higher corticosterone–cortisol concentrations compared to men [104], which could also explain the higher sensitivity of females to corticoid therapy. However, corticosteroids can also affect TEC as suggested by the “regulation of epithelial cell proliferation” category listed in Table 5. Also, mTECs expressing Aire are highly sensitive to corticosteroids [105]. Thus, the differential
expression of Aire in males and females [106] could also contribute to the sexual dimorphism observed for the effects of corticosteroids.
Role of Thymic Epithelial Cells in MG Thymus
The epithelial cells of the thymus play a key role in thymic selection mechanisms. The precursor cells reaching the thymus interact with cortical and then medullary epithelial cells to end their differentiation. As a result, the differentiated thymocyte can recognize a full panel of antigens and distinguish self and non-self antigens [107]. Since lymphocytes in development interact continuously with the epithelial network, we assume that TECs in MG thymus contribute to the thymic pathology. The thymic medullary epithelium is altered in MG patients, with very dense areas, around the GCs, which expectedly offer an abnormal environment to the developing thymocytes during the negative selection. The number of Hassal Corpuscles per unit area of the thymic medulla is significantly elevated in the thymus of MG patients with thymic hyperplasia [108], highlighting the alteration of the medullary epithelial network. We will discuss here the potential roles of TECs in MG thymic pathology, including the production of cytokines and chemokines, the role of AIRE, and their function in Treg generation. Production of Cytokines and Chemokines Several studies have demonstrated that medullary TECs from MG patients, when cultured in vitro, overproduce pro-inflammatory cytokines. TECs from hyperplastic thymuses spontaneously produce high amounts of interleukin-1 (IL-1) compared to controls. Also, the level of follicular hyperplasia is correlated to in vitro IL-1 production by TECs, suggesting a role for IL-1 in the expansion of thymic lymphoid follicles [109].TECs from MG patients also present an IL-6 hyperproduction phenotype as compared to controls when stimulated by exogenous signals such as LPS and pro-inflammatory cytokines [110]. Since IL-6 contributes to the generation of Th17 cells, this environment could alter the balance between functional Treg cells and inflammatory cells, particularly Th17 cells that are indeed increased in MG patients [83]. Several chemokines are also overproduced in mTEC from MG patients. CCL5 that plays an active role in recruiting leukocytes into inflammatory sites is increased in the hyperplastic thymus of MG patients, and CCL5 levels are abnormally augmented in TECs from MG compared to non-MG patients upon induction by adhesion-related stimuli [111]. One of its receptor CCR1 is significantly increased on CD4+ and CD8+ T cells in MG and reduced after therapy suggesting an involvement of the CCL5/CCR1 signaling pathway in the migration of peripheral T cells to the thymus [111]. In MG patients, CXCL13 was also demonstrated to be overexpressed in the thymus, and mTECs were shown to overproduce CXL13 [24]. This chemokine is selectively chemotactic for B cells and elicits its effects by interacting with the chemokine receptor CXCR5. In secondary lymphoid organs, CXCL13 is known to participate in GC formation [83]. The number of CXCR5+ follicular helper T cells is increased in the thymus and peripheral blood of MG patients [86]. These cells play a pivotal role in antibody production by B cells in secondary lymphoid organs [87]. These cytokines and chemokines could alter intrinsic leukocyte attraction and differentiation but also promote an inflammatory environment suitable for the development of the autoimmune response toward AChR. Role of mTECs in the Generation of Treg Cells
Thymic Treg (tTreg) cells are generated in the thymus medulla, mainly from CD4 single positive precursors. Different subsets of stromal cells have been shown to favor tTreg cell development. In a mouse model, it was shown that cortical TECs (cTECs) can be sufficient for tTreg cell differentiation [112]. In humans, plasmacytoid DCs can support tTreg cell differentiation under CD40L and IL-3 activation [113]. Dendritic cells (DCs) also promote tTreg cell differentiation after activation by the thymus stromal lymphopoietin produced by medullary TECs (mTECs) from Hassall’s corpuscles [114, 115]. Also, mTECs contribute to the selection of tTreg cells via T cell receptor (TCR) activation and MHC class II presentation [116]. One can wonder how the major histological changes and remodeling of MG thymus could affect the development of Treg cells in MG thymus. In humans, we previously showed that cultured mTECs promote the generation of tTreg cells and favor their function via soluble factors [117]. This effect involves the proliferation of newly generated CD4 + CD25+ cells from CD4 + CD25− cells and protection of Treg cells from cell death, via Bcl-2 and mitochondrial membrane potential changes. The mechanisms implicate ICOSL production by mTECS, which activate CD25− cells, to overproduce IL-2, resulting in the expansion of tTreg cells [117]. In MG, the number of Treg is normal, but their function is defective. The transcriptome analysis of these cells demonstrates a shift of these cells toward a Th17 phenotype [83]. Whether the functional and anatomical changes of mTEC in MG thymus could influence thymic Treg generation needs to be investigated. Potential Defect in Negative Selection and Role of AIRE Medullary TECs play a fundamental role in the self-tolerance education of thymocytes through their expression of tissue-specific antigens (TSA). The level of expression of
these TSA in the thymus seems to be a key factor for tolerization. The expression of TSA is frequently controlled by the autoimmune regulator (AIRE) that is a transcription factor expressed in the medulla of the thymus and controls the mechanism of central tolerance. In mice, thymic Aire expression levels correlate with the expression of TSA genes [118], and thymic deletion induced by antigen is absent in Aire homozygotes and less efficient in heterozygotes [119]. Susceptibility to autoimmune models is increased in mice deficient in AIRE [120, 121, 122]. The expression of the α-AChR, the principal autoantigen in MG, is controlled by AIRE [123], and at the age of 6 months, AIRE KO mice are more susceptible to MG than WT controls [123]. Also, a link between the level of AIRE and susceptibility to AIDs has been demonstrated in humans. In several pathophysiological situations, it was shown that a decreased level in AIRE is associated with increased autoimmune manifestation. For example, reduction in AIRE expression in thymoma is more striking in thymoma patients associated with AIDs than in thymoma patients without AIDs [124]. In down syndrome (DS) patients who are highly susceptible to AIDs [125], the number of AIRE+ cells in the thymus is lower (about half number of cells) compared to controls [126]. Whether a reduced level of AIRE contributes to a defective negative selection process in MG is unknown. Expression of AIRE is not defective in MG hyperplasia (not shown), but since the thymus is the site of inflammation, expression of AIRE could have been altered in the inflammatory environment. It would be very interesting to determine the level of AIRE before the onset of the disease, but this is difficult to assess, as thymic samples are available only when diagnosed MG patients are thymectomized. We recently showed that AIRE is differentially expressed in men and women. This factor is less expressed in adult females, due to the effects of estrogens that increase the
methylation status of AIRE promoter [106]. The reduced expression of AIRE in females could lead to a less efficient process of negative selection compared with males. In support of this hypothesis, data from over 500 individuals showed that females displayed a higher frequency of increased T cell reactivity to immunodominant myelin proteolipid protein (PLP) peptides compared with males, particularly in people who do not have multiple sclerosis [127]. In conclusion, mTEC may contribute to the inflammatory environment of the thymic hyperplasia, by the overproductions of cytokines and chemokines leading to the recruitment of B cells, and to the autoimmune response by an incomplete negative selection process and inefficient Treg generation. Concluding Remarks This review summarizes data on thymic pathology in MG patients and provides some explanations about the positive effects of thymectomy in some subgroups of patients [128]. Thymectomy is a common therapy for MG patients, namely those with thymic abnormalities including thymoma, and follicular hyperplasia. Whether thymectomy in non-thymomatous MG patients has any benefit has been asked, and a randomized trial comparing the clinical outcomes of non-thymomatous MG patients who underwent a thymectomy or not should be published soon. However, many articles have described the clinical outcome of thymectomy and have been recently summarized [129]. Overall, the remission rate for non-thymomatous MG patients is between 38 and 72 % up to 10 years of follow-up. Patients with thymic hyperplasia show the best complete stable remission rates in most studies. Also, age lower than 45 years showed a higher probability of achieving complete stable remission during follow-up [128], compatible
with our data showing that thymic abnormalities are mainly found in patients before the age of 45 years. Our major conclusions are as follows: 1. The development of hyperplasia is linked to the high production of antibodies to AChR. The thymic environment is favorable for the development of follicular hyperplasia typically in females before the age of 50. The role of the hormones including estrogens is very likely. 2. The patients present a chronicity of the GCs. Even patients with a disease onset 20 years before thymectomy could show a significant follicular hyperplasia. This chronicity could be due to the persistence of the antigen, the defect of Treg cells, or resistance to apoptosis. 3. Patients treated with prednisolone show a significantly reduced number of GCs and L/A ratio, compared to untreated ones. This therapy is associated with decreased expression of chemokines (CXCL13, CCL21, CCL19) and reduced number of HEV. At the molecular level, acetylation appears to be highly involved; one can assume that histone acetylation is one important mechanism of the corticosteroids to reduce the production of chemokines and cytokines, which subsequently limit the entry of the B cells in the thymus and lessen the development of the GCs. However, these molecular effects are not limited to chemokines since the effects of corticosteroids appear to alter the different thymic cell types including T cells, epithelial cells, and myoid cells. 4. TEC contribute to the pathology of the MG thymus by several mechanisms. Among them, there is the production of inflammatory cytokines and chemokines contributing to
the attraction of a high number of B cells, the regulation of Treg cells, and their fundamental role in central tolerance via the expression of AIRE. The links between the potential positive outcome of thymectomy and the thymus pathology are quite clear. Many patients have highly abnormal hyperplasia (especially the young females) that is directly related to the anti-AChR antibodies level. It is rather reasonable that removing the thymus that is a source of inflammation and antibody-producing B cells should have a benefit for MG patients displaying these immunological features. Whether it could also have a benefit in patients who do not exhibit changes in their thymus should be asked. An important remark is that corticosteroids evidently reduce the extent of the follicular hyperplasia by mechanisms described in this review, and therefore, thymic pathology should be interpreted with cautious in patients treated with steroids. However, the clinical effects of thymectomy are not observed in all patients, likely because antibody-producing B cells could also develop in the periphery. This could explain why thymectomy after a short duration of symptoms is a favorable prognostic factor [130]. Finally, corticosteroids represent a sort of a chemical thymectomy as it affects all the thymic subsets. However, what happens after stopping this therapy in the thymus is not known, and a rebound effect could be questioned as it was shown in mouse thymus [93].
Compliance with Ethical Standards Funding This work was supported by the FIGHT-MG (Heath-2009-242-210) grant from the European Community and a grant from the “Association Francaise contre les Myopathies” obtained by Dr S. Berrih-Aknin. References 1. Berrih-Aknin S, Frenkian-Cuvelier M, Eymard B (2014) Diagnostic and clinical classification of autoimmune myasthenia gravis. J Autoimmun 48–49: 143–148. 2. Higuchi O, Hamuro J, Motomura M, Yamanashi Y (2011) Autoantibodies to low-density lipoprotein receptor-related protein 4 in myasthenia gravis. Ann Neurol 69:418–422 3. Zisimopoulou P, Evangelakou P, Tzartos J, Lazaridis K, Zouvelou V et al (2014) A comprehensive analysis of the epidemiology and clinical characteristics of anti-LRP4 in myasthenia gravis. J Autoimmun 52:139–145 4. Berrih-Aknin S (2014) Myasthenia Gravis: paradox versus paradigm in autoimmunity. J Autoimmun 52:1–28 5. Berrih-Aknin S, Le Panse R (2014) Myasthenia gravis: a comprehensive review of immune dysregulation and etiological mechanisms. J Autoimmun 52:90–100 6. Hogquist KA, Baldwin TA, Jameson SC (2005) Central tolerance: learning self-control in the thymus. Nat Rev Immunol 5:772–782 7. Lopes N, Serge A, Ferrier P, Irla M (2015) Thymic Crosstalk Coordinates Medulla Organization and T-Cell Tolerance Induction. Front Immunol 6:365 8. Gupta S, Louis AG (2013) Tolerance and autoimmunity in primary immunodeficiency disease: a comprehensive review. Clin Rev Allergy Immunol 45:162–169 9. Klein L, Kyewski B, Allen PM, Hogquist KA (2014) Positive and negative selection of the T cell repertoire: what thymocytes see (and don’t see). Nat Rev Immunol 14:377–391 10. Laan M, Peterson P (2013) The many faces of aire in central tolerance. Front Immunol 4:326 11. Bertho JM, Demarquay C, Moulian N, Van Der Meeren A, Berrih-Aknin S et al (1997) Phenotypic and immunohistological analyses of the human adult thymus: evidence for an active thymus during adult life. Cell Immunol 179:30–40 12. Kendall MD, Johnson HR, Singh J (1980) The weight of the human thymus gland at necropsy. J Anat 131:483–497 13. Clarke AG, Kendall MD (1994) The thymus in pregnancy: the interplay of neural, endocrine and immune influences. Immunol Today 15:545–551 14. George AJ, Ritter MA (1996) Thymic involution with ageing: obsolescence or good housekeeping? Immunol Today 17:267–272 15. Steinmann GG, Klaus B, Muller-Hermelink HK (1985) The involution of the ageing human thymic epithelium is independent of puberty. A morphometric study. Scand J Immunol 22:563–575 16. Thomas JA, Sloane JP, Imrie SF, Ritter MA, Schuurman HJ et al (1986) Immunohistology of the thymus in bone marrow transplant recipients. Am J Pathol 122:531–540 17. Douek DC, McFarland RD, Keiser PH, Gage EA, Massey JM et al (1998) Changes in thymic function with age and during the treatment of HIV infection. Nature 396:690–695
18. Pido-Lopez J, Imami N, Aspinall R (2001) Both age and gender affect thymic output: more recent thymic migrants in females than males as they age. Clin Exp Immunol 125:409–413 19. Mitchell WA, Lang PO, Aspinall R (2010) Tracing thymic output in older individuals. Clin Exp Immunol 161:497– 503 20. Gui J, Mustachio LM, Su DM, Craig RW (2012) Thymus Size and Age-related Thymic Involution: Early Programming, Sexual Dimorphism, Progenitors and Stroma. Aging Dis 3:280–290 21. Flores KG, Li J, Sempowski GD, Haynes BF, Hale LP (1999) Analysis of the human thymic perivascular space during aging. J Clin Invest 104:1031–1039 22. Zairat’iants OV, Vetshev PS, Ippolitov I, Shkrob LO, Belokrinitskii DV et al (1991) The morphological and clinico-immunological characteristics of 2 types of myasthenia. Arkh Patol 53:22–27 23. Liu Z, Feng H, Yeung SC, Zheng Z, Liu W et al (2011) Extended transsternal thymectomy for the treatment of ocular myasthenia gravis. Ann Thorac Surg 92:1993–1999 24. Meraouna A, Cizeron-Clairac G, Panse RL, Bismuth J, Truffault F et al (2006) The chemokine CXCL13 is a key molecule in autoimmune myasthenia gravis. Blood 108:432–440 25. Kanda N, Tamaki K (1999) Estrogen enhances immunoglobulin production by human PBMCs. J Allergy Clin Immunol 103:282–288 26. Medina KL, Kincade PW (1994) Pregnancy-related steroids are potential negative regulators of B lymphopoiesis. Proc Natl Acad Sci U S A 91:5382–5386 27. Mackay F, Schneider P (2009) Cracking the BAFF code. Nat Rev Immunol 9:491–502 28. Panchanathan R, Choubey D (2013) Murine BAFF expression is up-regulated by estrogen and interferons: implications for sex bias in the development of autoimmunity. Mol Immunol 53:15–23 29. Straub RH (2007) The complex role of estrogens in inflammation. Endocr Rev 28:521–574 30. Whitacre CC, Reingold SC, O’Looney PA (1999) A gender gap in autoimmunity. Science 283:1277–1278 31. Grimaldi CM, Cleary J, Dagtas AS, Moussai D, Diamond B (2002) Estrogen alters thresholds for B cell apoptosis and activation. J Clin Invest 109:1625–1633 32. Medina KL, Strasser A, Kincade PW (2000) Estrogen influences the differentiation, proliferation, and survival of early B-lineage precursors. Blood 95:2059–2067 33. Luckey D, Medina K, Taneja V (2012) B cells as effectors and regulators of sex-biased arthritis. Autoimmunity 45:364–376 34. Shim GJ, Kis LL, Warner M, Gustafsson JA (2004) Autoimmune glomerulonephritis with spontaneous formation of splenic germinal centers in mice lacking the estrogen receptor alpha gene. Proc Natl Acad Sci U S A 101:1720–1724 35. Trigunaite A, Khan A, Der E, Song A, Varikuti S et al (2013) Gr-1(high) CD11b + cells suppress B cell differentiation and lupus-like disease in lupus-prone male mice. Arthritis Rheum 65:2392–2402 36. Baggi F, Antozzi C, Toscani C, Cordiglieri C (2012) Acetylcholine receptor-induced experimental myasthenia gravis: what have we learned from animal models after three decades? Arch Immunol Ther Exp (Warsz) 60:19–30 37. Berrih S, Morel E, Gaud C, Raimond F, Le Brigand H et al (1984) Anti-AChR antibodies, thymic histology, and T cell subsets in myasthenia gravis. Neurology 34:66–71 38. Willcox HN, Newsom-Davis J, Calder LR (1983) Greatly increased autoantibody production in myasthenia gravis by thymocyte suspensions prepared with proteolytic enzymes. Clin Exp Immunol 54:378–386 39. Lisak RP, Levinson AI, Zweiman B, Kornstein MJ (1986) Antibodies to acetylcholine receptor and tetanus toxoid: in vitro synthesis by thymic lymphocytes. J Immunol 137:1221–1225 40. Leprince C, Cohen-Kaminsky S, Berrih-Aknin S, Vernet-Der Garabedian B, Treton D et al (1990) Thymic B cells from myasthenia gravis patients are activated B cells. Phenotypic and functional analysis. J Immunol 145:2115–2122 41. Fujii Y, Hashimoto J, Monden Y, Ito T, Nakahara K et al (1986) Specific activation of lymphocytes against acetylcholine receptor in the thymus in myasthenia gravis. J Immunol 136:887–891