HAL Id: cea-02359282
https://hal-cea.archives-ouvertes.fr/cea-02359282
Submitted on 12 Nov 2019HAL is a multi-disciplinary open access archive for the deposit and dissemination of sci-entific research documents, whether they are pub-lished or not. The documents may come from teaching and research institutions in France or abroad, or from public or private research centers.
L’archive ouverte pluridisciplinaire HAL, est destinée au dépôt et à la diffusion de documents scientifiques de niveau recherche, publiés ou non, émanant des établissements d’enseignement et de recherche français ou étrangers, des laboratoires publics ou privés.
Release of clay particles from an unconsolidated
clay-sand core experiments and modelling
M. Faure, M. Sardin, P. Vitorge
To cite this version:
M. Faure, M. Sardin, P. Vitorge. Release of clay particles from an unconsolidated clay-sand core experiments and modelling. Journal of Contaminant Hydrology, Elsevier, 1997, 26 (1-4), pp.169-178. �10.1016/S0169-7722(96)00066-6�. �cea-02359282�
Release of clay particles from an unconsolidated clay-sand
core: experiments and modelling
Marie-Hélène Fauré*, Michel Sardin** and Pierre Vitorge*.
*CEA Saclay DCC/DESD/SESD 91191 Gif-sur-Yvette Cedex FRANCE.
**Laboratoire des Sciences du Génie Chimique, CNRS-ENSIC, BP 451, 54001 Nancy, FRANCE
Abstract
This work identifies the main phenomena that control the peptisation and transport of clay particles in a sand core. Clay can be dispersed into small particles in an aqueous solution of low ionic strength. This property is used to generate clay particles with NaCl concentration varying from 0.5 M to 0.015 M. For this purpose, a chromatographic column is initially packed with a 5 % clay-sand mixture. The monitored decrease of the NaCl concentration of the feed solution allows the control of transport of the particles without plugging the porous medium. In this conditions, it is shown that, in a column of a given length, the amount of clay particles, released into solution and available to transport, depends only on NaCl concentration. Some clay particles are available to migration when the NaCl concentration of the feed concentration is between 0.16 M and 0.05 M (first domain) or between 0.035 M and 0.019 M (second domain). An empirical function, Pd([NaCl]), accounts for this particle
generation. Transport is mainly dependent on the hydrodynamic characteristics of the porous medium that vary during the elution, probably due to the particle motion inside the column. A phenomenological modelling is derived from these results, coupling the particle generation term, Pd([NaCl]), with an adapted nonequilibrium
transport solute model. Similarly to the solute, particles were attributed a characteristic time of mass transfer between mobile and immobile water zones. This is sufficient to take into account the kinetic limitations of particles transport. The values of the parameters are determined by independent experiments. Finally, breakthrough curves of clay particles are predicted when a column of a given length is flushed by a salinity gradient of NaCl in various conditions.
Introduction
Particles are suspected to be involved in the transport of pollutants in soils (Avogadro and De Marsily, 1984). The possible phenomena involved in the control of particle transport are linked to the physical properties of the particles in solution (flocculation or dispersion according to the solution), the interaction between the particles and the porous medium (mechanical retention (filtration), adsorption (DLVO theory or sorption reaction)) and of course, the hydrodynamic properties of the porous medium ( porosity, permeability, dispersion…).
It is well known that, exchanging the salt water present in a sand core with a fresh water, reduces the permeability of the core due to clay particles migration (Van Olphen, 1977). This problem is of interest for petroleum engineers and agricultural researchers. They usually focus their studies on the evolution of the permeability of the sand core until plugging occurs. Few quantitative studies exist on the clay
core is dependant on the type of clay, and on the nature of the salt. They show that release of particles occurs below a Critical Salt Concentration, CSC (Khilar and Fogler, 1984).
Here, rather than decreasing salinity to reach fresh water and clogging the porous medium by a release of a large amount of particles, the salinity decrease is stopped just below the CSC. This decrease must be large enough to generate particles, but avoids the plugging of the column. One of preliminary work has been to perform well controlled and reproducible experiments. It is needed to develop a phenomenological modelling and to test numerical code predictions. The modelling approach is to first establish, from experiments, a relationship between the salinity in the porous medium and the amount of particles released then, to develop a transport model taking into account the observed behaviours (released amount, kinetic effects) and finally, to compare the simulated and experimental results and to test the limits of the model (flow rate, pH, % of clay, column length).
This work is part of a study (Fauré, 1994) on the modelling and experimental investigation of the coupled transport of radionuclides and particles. A general article has been presented earlier (Fauré et al., 1994), in which a particle transport model is used to simulate the coupled transport of caesium and particles in a salinity gradient. In the present contribution, we want to focus the methodology and the experimental results which have led to this model of particle transport.
Experimental set-up and method
We use a standard liquid chromatographic system. Two pumps, one fed by distilled water and the other by a NaCl solution, monitored by means of a gradient performer, allow us to feed the column at constant flow rate (usually 1ml/min) with a linearly decreasing NaCl concentration with time. At the outlet of the column, we monitor the variations of NaCl concentration with a conductimetric cell. An U.V. (280 nm) continuous detector measures the particle concentration in the effluent. On a large range of particle concentrations, the response of U.V. detector is linear. The porous medium consists in a mixture of 5% weight Foca3 bentonite clay and sand (99% SiO2). A 16 mm diameter column is packed with 8 g of the mixture. The column
is purged of air with CO2 and then saturated with an upward flow of sodium chloride
(0.5 M) at pH= 6.5.
Reproducible experiments: The NaCl concentration of the feed solution of the column is decreased from the initial NaCl concentration, Ci, to the final, Cf, then
increased to Ci. This cycle is repeated several times to observe the influence of
these signals on the particle breakthrough curves. Progressively, the amount of particles eluted during a cycle decreases to zero, though there is still clay in the column. For a given decrease of concentration from Ci to Cf, the amount of particles
capable of being released from the column is limited. The history of the column cannot be ignored and we will refer to reproducible experiments only for a fresh columns. Preliminary results showed that step changes in the NaCl concentration at the inlet of the column led to large perturbations (inducing possible clogging) in the column and non reproducible experiments from one fresh column to another. In a typical experiment, the NaCl concentration of the feed solution is decreased from Ci
to Cf within a volume, Vg, of solution, then the concentration of the feed solution is
maintained constant at Cf as long as some particles leave the column. This typical
experiment is reproducible from one fresh column to another with identical physical characteristics: length (≈ 3 cm), composition (5 % clay) of porous medium and flow
Table 1
: Empirical function Pd([NaCl]): amount of particles available to migrate as a function of NaCl concentration. Pd is in (D.O. unity)/(Kg of porous medium). Thisfunction is plotted with experimental points in Fauré and all. (1994).
[NaCl] domain Equation of Pd([NaCl])
[NaCl] > 0.16 M Pd([NaCl]) = 0
0.16 M ≥ [NaCl] ≥ 0.05 M Pd([NaCl]) = X1 (exp([NaCl]n) - exp(0.16n))
0.05 M ≥ [NaCl] ≥ 0.035 M Pd([NaCl]) = X1 (exp(0.05n)-exp(0.16n))
0.035 M ≥ [NaCl] ≥ 0.019 M Pd([NaCl]) = X2 (exp([NaCl]n) - exp(0.035n)) + Pd(0.05)
0.019 M ≥ [NaCl] Pd([NaCl]) = X2 (exp(0.019n) - exp(0.035n)) + Pd(0.05)
n=-0.6, X1=75 500 et X2=7 970
Table 2: Mass transfer equations of NaCl solute and of particles used in the model.
tracer in mobile fluid zone Q C Q C
V J dC dt m,k-1 m,k m p m,k e,k = +θ +Φ (1)
tracer in immobile fluid zone θim
p im,k e,k V J dC dt = Φ (2)
tracer flux between zones Φe,k
m p m,k im,k M V J C C t =θ − (3)
particles in mobile fluid zone Q P Q P
V J dP dt m,k-1 m,k m p m,k e,,P,k = +θ +Φ (4)
particles in immobile fluid zone θim p im,k s,P,k e,P,k V J dP dt +Φ =Φ (5)
particle flux between zones Φe,P,k
im p m,k im,k M,P V J P P t =θ − (6)
particle flux source Φs,P,k
d m J dP d[NaCl] d[NaCl] dt = − (7)
Table 3: Values of hydrodynamic parameters used to simulate particle release in the
two domains of NaCl concentration. Domain 1 [NaCl] 0.16 M to 0.05 M Domain 2 [NaCl] 0.035 M to 0.019 M J 51 15 θim 0.125 0.285 tM 0.05 τ 0.09 τ tMp 12 τ 20 τ
rate (1 ml/min). Important parameters are: Ci, Cf and Vg. We limit the study with
0.015 M<Cf<0.5 M to avoid plugging of the porous medium. In this case, the amount
of particles leaving the column is negligible compared to the amount of clay staying in it. We shall now vary them to characterise some aspects of the particle transport.
V/Vp
[NaCl] (M)
0
0.02
0.04
0.06
0.08
0.1
0
100
200
300
400
500
600
0
[Particles]
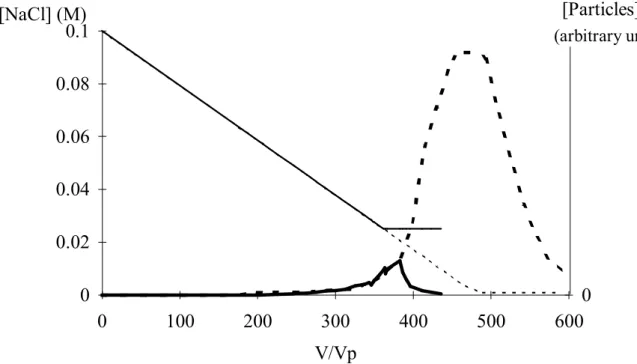
(arbitrary unit)Figure 1: Effect of the final concentration, Cf, on the amount of particles leaving the
column. The NaCl concentration of the feed solution is decreased to 0.001 M in column 1 ( ), while in column 2, the NaCl concentration is just decreased from 0.1 M to 0.025 M ( ). As long as the NaCl concentration is the same, the particle
breakthrough curves are identical (column 1 , column 2 ).
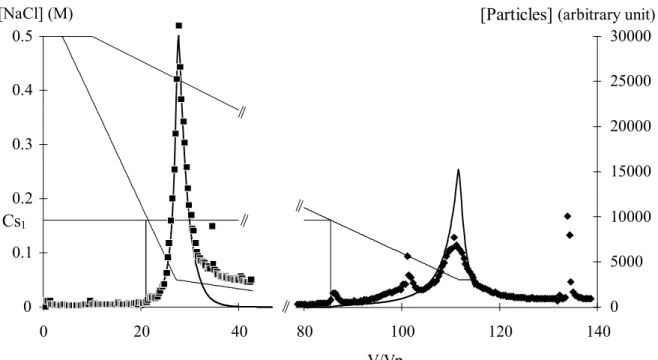
V/Vp [NaCl] (M) 0 0.1 0.2 0.3 0.4 0.5 0 50 100 150 200 250 300 350 0 20000 40000 60000 80000 100000 120000 140000 [Particles] (arbitrary unit)
1st peak
2nd peak
Figure 2: Particle elution profile ( ) from a column where the NaCl concentration of the feed solution ( ) is decreased from 0.2 M to 0.015 M with Vg =
Experimental results and interpretation
Typical experiment: (see for example Figures 3 and 4) At the beginning of the experiment, the salinity of the feed solution decreases and no particle are detected in the effluent. Then, the particles begin to leave the column and the concentration of particles in the effluent increases up to a maximum value and finally decreases. Let us focus on three points: the shape of the particle breakthrough curve, the time when particles begin to leave the column and the total amount of particles released.
Shape of the particle breakthrough curve: The amount of particles available for migration, during the decrease of the NaCl concentration of the feed solution, is clearly limited. However, even when the NaCl concentration decrease stops (the column is then fed with a solution at constant NaCl concentration), particles continue to leave the column. The system is not at equilibrium and we deduce that some kinetic limitations occur in the particle transport.
Measurement of the particle output threshold: We look for a NaCl critical salt concentration, CSC, below which the particles begin to be released. Several typical experiments are performed with the NaCl concentration decreasing from 0.5 M to 0.05 M and from 0.05 M to 0.015 M, and the effect of the parameter Vg is studied.
Finally, for each domain of NaCl concentration variation, a threshold concentration is obtained, independently of Vg: Cs1 = 0.16 M and Cs2 = 0.036 (Figures 3 and 4). For a
naturally consolidated sandstone (8%clay content, mainly kaolinite), Khilar and Fogler (1984) have determined a CSC equal to 0.07 M NaCl. This value is in the same order of magnitude as Cs1 and Cs2. The difference can be attributed to the fact
that particle release is dependant on clay type, the composition of sand and the structure of porous medium.
Amount of particles released: Two columns are fed with a NaCl solution, the concentration of which is decreased from Ci to Cf1. Then, we continue to decrease
the concentration to Cf2 in the first column, whereas we feed the second with a
constant NaCl concentration solution. The breakthrough particle curves are identical as long as the NaCl concentrations of the feed solution are the same (Figure1). The results of several typical experiments from Ci (Ci=0.5 M or 0.05 M) to Cf (0.05 M or
0.015 M) with different Vg values are considered. The plot of the amount of particles
that leave the column during an experiment, QP, shows that QP is only dependent on
Ci and Cf, but not on Vg. However, Vg has an effect upon the concentration of the
particles in the effluent of the column. Keeping Ci and Cf constant, the larger the
required volume Vg to elute the same amount of particles, the lower the
concentration of particles in the effluent.
Verification of the existence of several CSC: Cs1 and Cs2 have been
determined from distinct experiments, decreasing NaCl concentration from 0.5 M to 0.05 M, keeping the NaCl concentration constant as long as particles are eluted for the column, and decreasing it again from 0.05 to 0.015 M. To test if Cs2 is not a
kinetic effect due to the plateau at 0.05 M, a column is fed with a NaCl solution decreasing from 0.2 M to 0.015 M without the plateau at 0.05 M (Figure 2). We detect, as previously assumed, two peaks of particles. The particle release begins when the concentration reaches 0.16 M, then stops and resumes when the concentration drops below 0.036 M. This confirms the previous observations: two domains of NaCl concentration occur in which some particles are able to migrate in the column. The upper limits of these domains are the threshold concentrations. The
V/Vp [NaCl] (M) 0 0.1 0.2 0.3 0.4 0.5 0 20 40 80 100 120 140 0 5000 10000 15000 20000 25000 30000 Cs1
[Particles] (arbitrary unit)
Figure 3: Comparison of particle release between simulation ( ) and typical experiments with small and large Vg values. The NaCl concentration ( ) of the
feed solution is decreased from Ci = 0.5 M to Cf = 0.05 M with Vg = 23.3 Vp (■) or
with Vg = 107 Vp (
♦
).lower limits, Cls1 and Cls2, below which the particles are no longer released into
solution, are 0.05 M and 0.019 M respectively. These are determined from experiments with large Vg volumes to limit the kinetic effects. In each of these, it has
been checked that Qp is the same for experiments with Cf equal to Cls or slightly
lower than Cls. This experiment, revealing the two domains for particle release, is
very tricky. Indeed, we must choose a convenient intermediate value of the volume Vg. If Vg is too small, the two particle peaks of the two domains interfere. On the
other hand, if Vg is too large, the concentration of particles in the effluent will be
below the detection limit of the U.V cell. This means that some sub-domains of particle output, that we have not detected, could exist. The distinct threshold concentrations might be related to the size or to the nature of the clay.
In order to model the particle release, we need an equation to account for the amount of particles available for migration. An empirical function, Pd([NaCl]), is fitted
on previous experimental plots, Qp vs NaCl concentration. Pd(Cf)-Pd(Ci) is the amount
of particles that leave the column when decreasing the NaCl concentration of the feed solution from Ci to Cf. This relationship is given in table1.
Hydrodynamics: We have shown earlier (Fauré et al., 1994) that, initially, the water flow is near that of a piston flow. But immediately prior to the detection of the first eluted particles from the output of the column, preferential pathways and dead zones are created; their size increases as the NaCl concentration is decreased. This is attributed to particle transport and reordering inside the column.
V/Vp [NaCl] (M) 0 0.1 0.2 0.3 0.4 0.5 0 5 10 15 20 25 30 35 40 0 5000 10000 15000 20000 25000 30000 [Particles] (unité D.O.)
Cs1
3.a
V/Vp [NaCl] (M) 0 0.1 0.2 0.3 0.4 0.5 0 20 40 60 80 100 120 140 160 0 5000 10000 15000 20000 [Particles] (unité D.O.)CS1
3.b
Figure 3 (details): Comparison of particle release between simulation ( ) and typical experiments with small and large Vg values. The NaCl concentration ( )
of the feed solution is decreased from Ci = 0.5 M to Cf = 0.05 M with Vg = 23.3 Vp (■)
V/Vp [NaCl] (M) 0 0.01 0.02 0.03 0.04 0.05 0 20 40 80 100 120 140 160 0 10000 20000 30000 40000 50000 60000 [Particles] (arbitrary unit)
Cs2
Figure 4: Comparison of particle release between simulation ( ) and typical experiments with small and large Vg values. The NaCl concentration ( ) of the
feed solution is decreased from Ci = 0.05 M to Cf = 0.02 M and Vg = 37.5 Vp (■). In
the other experiment, the NaCl concentration of the feed solution is decreased from Ci = 0.05 M to Cf = 0.02 M with Vg = 80 Vp then NaCl is decreased to 0.01 M with Vg
= 254 Vp (
♦
).Modelling the transport of particles in a salinity gradient
Hydrodynamics modelling: To model the hydrodynamics of the porous medium in the different situations, we used the classical description of one-dimensional convective-dispersive solute transport with dead end pore volume (Coats and Smith, 1964). A mobile water zone, in which the transport is controlled by convection and dispersion, is assumed to diffuse through the immobile water zone located in dead end pore volume. This description is applied to the discrete model of mixing cells in series (Villermaux, 1974). The column, of porous volume Vp, is
represented by J identical cells in series. Equivalence between this discrete approach and the classical continuous model has been shown under these conditions (Sardin et al., 1991), the relationship between J and the axial dispersion coefficient, D, being Pe=uL/D=2(J-1) (Pe= Peclet number, L= length of column, u= interstitial velocity). Each cell contains a mobile fluid zone of volume θMVp/J and an
immobile fluid zone of volume θimVp/J. The mass balance equations in the k th
cell, for a tracer, are listed in table 3. Cm,k and Cim,k are the concentrations of the tracer in the
mobile and the immobile fluid zones. Φe,k is the flux between the mobile and the
immobile fluid zones. As a first approximation, this flux is assumed to be controlled by a linear first order kinetic law (table 2, equation (3)) and tM is a characteristic mass
transfer time. According to the nature of the mass transfer resistance (film model, internal diffusion in the aggregates…), the expression of tM can be calculated from
the main characteristics of the grain packing (Sardin et al., 1991).
Particle transport modelling: We apply the description of the tracer transport to the particles by adding a term for the generation of particles, Pd([NaCl]). As for the
solute, a characteristic mass transfer time for the particles, tMp, is introduced. No
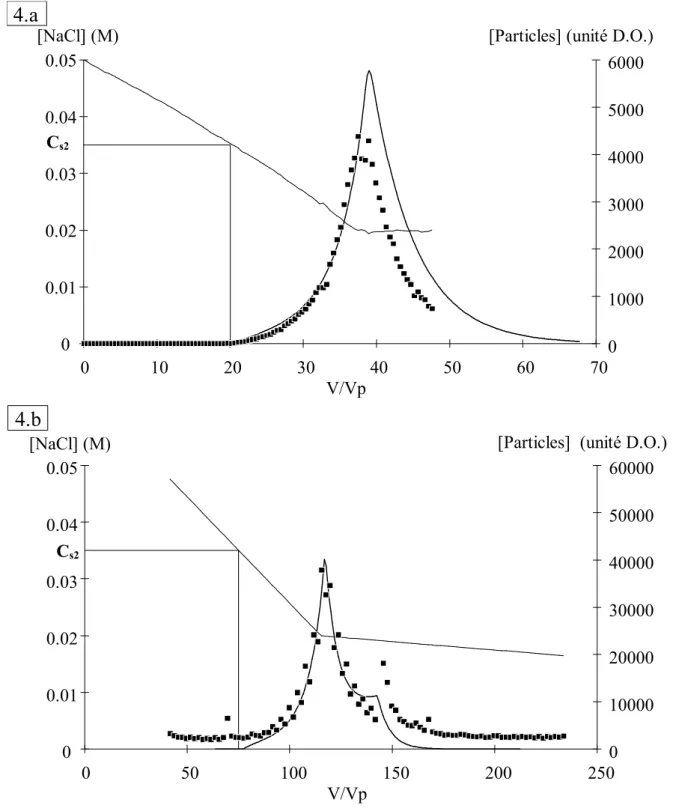
V/Vp [NaCl] (M) 0 0.01 0.02 0.03 0.04 0.05 0 10 20 30 40 50 60 70 0 1000 2000 3000 4000 5000 6000 [Particles] (unité D.O.)
Cs2
4.a
V/Vp [NaCl] (M) 0 0.01 0.02 0.03 0.04 0.05 0 50 100 150 200 250 0 10000 20000 30000 40000 50000 60000 [Particles] (unité D.O.)Cs2
4.b
Figure 4 (details): Comparison of particle release between simulation ( ) and typical experiments with small and large Vg values. The NaCl concentration ( )
of the feed solution is decreased from Ci = 0.05 M to Cf = 0.02 M and Vg = 37.5 Vp
(■). In the other experiment, the NaCl concentration of the feed solution is decreased from Ci = 0.05 M to Cf = 0.02 M with Vg = 80 Vp then NaCl is decreased to 0.01 M
with Vg = 254 Vp (
♦
).into account all the kinetic limitations found earlier in the experimental study of particle transport. We assume that the immobile fluid zone is in contact with the porous medium that produces particles according to the NaCl concentration. The
immobile fluid zones and the source term of particles from the porous medium to the immobile fluid zone are in table 2 (equation (4) to (7)).
Determination of the parameters and model verifications: Equations (1), (2) and (3) describe the NaCl transport, considered as a tracer, equations (4) to (7) describe the transport of particles. The parameters (Vp, J, θim, tM) are determined
from experimental measurements of Residence Time Distribution (Fauré, 1994). The hydrodynamic characteristics change continuously as NaCl concentration is decreased, but we only know these values for a few NaCl concentrations. So, during simulation, we keep these parameters constant. For each domain of destabilisation, the hydrodynamic characteristics of the porous medium used are in Table 3. To determine tMp (Table 3), we fit it with two breakthrough curves in each domain. Then,
the model is tested on a set of a dozen of experiments of clay destabilisation, of which four are shown here (Figures 3 and 4). These figures are representative of the two NaCl concentration domains studied and of the values of Vg used. For typical
experiments from 0.5 M to 0.05 M, or from 0.05 M to 0.015 M, the agreement between experiments and simulation is good when Vg is not too large (< 150 Vp).
When Vg increases, the simulation anticipates the particle breakthrough curve.
These differences are possibly due to the approximation on the invariance of the porous medium hydrodynamic characteristics. During the simulation, we keep θim, tM,
tMp constant, whereas actually, they increase. The increase of θim and tMp involves a
retardation of the particle migration. An other reason could be the insufficient knowledge of the Pd([NaCl]) function.
Meaning of the characteristic parameters for the particles: Pd, tMp
To simulate the transport of particles in a porous medium, a filtration term is often introduced. We do not use this approach. This term of filtration is implicitly enclosed in the Pd function. We have made typical experiments with a long column
(Vp=11.8 ml instead of 3 ml usually). The amount of particles (referred to the mass of
porous medium) that leave this column is less than that from a column of smaller length. It would be interesting to get a flocculation curve of clay particles, that is, for a given time, the rate of flocculation of the clay as a function of the NaCl concentration. tMp is the characteristic mass transfer time. Additional experiments with
different flow rates and a constant Vg, show that the particle concentration in the
effluent increases as flow rate decreases (the total amount of particles that leave the column being constant). The flux between the mobile and the immobile water zones in a mixing cell is then probably in diffusive mode.
Conclusion
The transport of clay particles, caused by a decrease of the salinity of the feed solution, in a unconsolidated sand core is modelled by coupling a non equilibrium transport model with a term of particles generation, Pd([NaCl]). The hydrodynamic
properties of the porous medium vary as soon as the particles are in movement inside the column. The kinetic limits of particle transport are simply taken into account by the hydrodynamic model. Pd([NaCl]) is linked to the properties of
flocculation of the clay particles and of the filtration in the porous medium. This model is tested on a set of a dozen of experiments.
REFERENCES
-Avogadro A, De Marsily G.: The role of colloids in nuclear waste disposal. Mat. Res. Soc. Symp. Proc., 26, 495-505, (1984).
-Coats K.R., Smith B.D.: Dead end pore volume and dispersion in porous media. Soc. Petrol. Eng. J., 4, 73-84, (1964).
-Fauré M-H., Sardin M., Vitorge P.: Transport of clay particles and radioelements in a salinity gradient: experiments and simulations. Fourth International Conference on the chemistry and migration behaviour of actinides and fission products in the geosphere. Charleston, SC USA, Dec12 17, 1993, 451-457, (1994).
-Fauré M-H.: Migration de particules et de solutés en milieu poreux. Modélisation du transport simultané de particules argileuses et de radionucléides sous l'effet d'un gradient de salinité. Thèse de l'INPL, Nancy (France), (1994)
-Khilar K. C. and Fogler S.: Colloidally induced fines migration in porous media. Rev. Chem. Eng., 4, 41, (1987)
-Khilar K. C. and Fogler S.: The existence of a critical salt concentration for particle release. J. Colloid and Interface Sci., 101, 1, (1984)
-Sardin M., Schweich D., Leij F.J., Van Genuchten M.T.: Modelling the nonequilibrium transport of linearly interacting solutes in porous media: a review. Water Resour. Res., 27, 9, 2287-2307, (1991)
-Van Olphen H.: An introduction to clay colloid chemistry. Wiley -Interscience Publication, 2nd edition, 318 pp. (1977)
-Villermaux J.: Deformation of chromatographic peaks under the influence of mass transfer phenomena. Journal of Chromatographic Science, vol.12, 822-831, (1974)
![Table 1 : Empirical function P d ([NaCl]): amount of particles available to migrate as a function of NaCl concentration](https://thumb-eu.123doks.com/thumbv2/123doknet/13254674.396292/4.892.137.785.386.733/table-empirical-function-particles-available-migrate-function-concentration.webp)