HAL Id: hal-03247903
https://hal.univ-grenoble-alpes.fr/hal-03247903
Submitted on 3 Jun 2021
HAL is a multi-disciplinary open access
archive for the deposit and dissemination of
sci-entific research documents, whether they are
pub-lished or not. The documents may come from
teaching and research institutions in France or
abroad, or from public or private research centers.
L’archive ouverte pluridisciplinaire HAL, est
destinée au dépôt et à la diffusion de documents
scientifiques de niveau recherche, publiés ou non,
émanant des établissements d’enseignement et de
recherche français ou étrangers, des laboratoires
publics ou privés.
Reconfiguration dynamics of a language-and-memory
network in healthy participants and patients with
temporal lobe epilepsy
Sonja Banjac, Elise Roger, Cédric Pichat, Emilie Cousin, Chrystèle Mosca,
Laurent Lamalle, Alexandre Krainik, Philippe Kahane, Monica Baciu
To cite this version:
Sonja Banjac, Elise Roger, Cédric Pichat, Emilie Cousin, Chrystèle Mosca, et al.. Reconfiguration
dynamics of a language-and-memory network in healthy participants and patients with temporal
lobe epilepsy. Neuroimage-Clinical, Elsevier, 2021, 31, pp.102702. �10.1016/j.nicl.2021.102702�.
�hal-03247903�
NeuroImage: Clinical 31 (2021) 102702
Available online 24 May 2021
2213-1582/© 2021 The Author(s). Published by Elsevier Inc. This is an open access article under the CC BY-NC-ND license
(http://creativecommons.org/licenses/by-nc-nd/4.0/).
Reconfiguration dynamics of a language-and-memory network in healthy
participants and patients with temporal lobe epilepsy
Sonja Banjac
a, Elise Roger
a, C´edric Pichat
a, Emilie Cousin
a,b, Chryst`ele Mosca
c,
Laurent Lamalle
b, Alexandre Krainik
b, Philippe Kahane
c, Monica Baciu
a,*aUniv. Grenoble Alpes, CNRS LPNC UMR 5105, 38000 Grenoble, France bUniv. Grenoble Alpes, UMS IRMaGe CHU Grenoble, 38000 Grenoble, France
cNeurology Department, Grenoble Hospital, Univ. Grenoble Alpes, 38000 Grenoble, France
A R T I C L E I N F O
Keywords:
Language Memory Connectivity Temporal lobe epilepsy Extrinsic
Intrinsic
A B S T R A C T
Current theoretical frameworks suggest that human behaviors are based on strong and complex interactions between cognitive processes such as those underlying language and memory functions in normal and neuro-logical populations. We were interested in assessing the dynamic cerebral substrate of such interaction between language and declarative memory, as the composite function, in healthy controls (HC, N = 19) and patients with temporal lobe epilepsy (TLE, N = 16). Our assumption was that the language and declarative memory integration is based on a language-and-memory network (LMN) that is dynamic and reconfigures according to task demands and brain status. Therefore, we explored two types of LMN dynamics, a state reconfiguration (intrinsic resting- state compared to extrinsic state assessed with a sentence recall task) and a reorganization of state reconfigu-ration (TLE compared to HC). The dynamics was evaluated in terms of segregation (community or module detection) and integration (connector hubs). In HC, the level of segregation was the same in both states and the mechanism of LMN state reconfiguration was shown through module change of key language and declarative memory regions with integrative roles. In TLE patients, the reorganization of LMN state reconfiguration was reflected in segregation increase and extrinsic modules that were based on shorter-distance connections. While lateral and mesial temporal regions enabled state reconfiguration in HC, these regions showed reduced flexibility in TLE. We discuss our results in a connectomic perspective and propose a dynamic model of language and declarative memory functioning. We claim that complex and interactive cognitive functions, such as language and declarative memory, should be investigated dynamically, considering the interaction between cognitive networks.
1. Introduction
Recent neurocognitive frameworks suggest that human behaviors are enabled by complex interactions between cognitive functions,
instead of isolated involvement of each of them (Kellermann et al., 2016;
Roger et al., 2020b; Van Der Maas et al., 2006). The evidence of inte-gration can be found in everyday life such as recalling an old episode (Larsen et al., 2002; Park et al., 2011) or maintaining a conversation by
relying on what is called the common ground (Clark & Marshall, 1981).
When formulating an utterance during a conversation, interlocutors are relying on background information that they believe is shared by the
participants in the conversation (Stalnaker, 2002). Hence, language
must rely on the declarative memory and previous studies described a
wide language-and-memory network (LMN) (Banjac et al., 2020; Roger
et al., 2020a, 2020b). This perspective is in line with the current tran-sition towards new integrative and dynamic neurocognitive and
con-nectomic models (Dick et al., 2014; Garcia-Ramos et al., 2016; Herbet &
Duffau, 2020; Kellermann et al., 2016; Zamora-Lopez et al., 2011; Zhou et al., 2020). The connectomic perspective assumes that complex cognitive systems are shaped by the interactions between processes (Meunier et al., 2010) and functional integration and specialization are
supported by the modular architecture (Bertolero et al., 2015; Fornito
et al., 2016; Meunier et al., 2010; Park & Friston, 2013; Zamora-Lopez et al., 2011). Modularity enables the adaptation of a global network to
environmental changes (Finc et al., 2017; Meunier et al., 2010) shaping
it into local modules or specialized communities, composed of densely
* Corresponding author at: LPNC, UMR CNRS 5105, BMD, BP 47, 38040 Grenoble Cedex 09, France.
E-mail address: monica.baciu@univ-grenoble-alpes.fr (M. Baciu).
Contents lists available at ScienceDirect
NeuroImage: Clinical
journal homepage: www.elsevier.com/locate/ynicl
https://doi.org/10.1016/j.nicl.2021.102702
intra-connected regions (nodes) that share common functions (segre-gation property). These modules are sparsely connected with other communities via inter-module connections that provide the integration
property (Fornito et al., 2016; Guimer`a & Amaral, 2005; Rubinov &
Sporns, 2010). Nodes that are highly interconnected within their com-munities, but not so strongly to other communities are called provincial
hubs and they support segregation (Bertolero et al., 2015; Meunier et al.,
2009; Schedlbauer & Ekstrom, 2019). The integration between modules is based on the connector nodes that are highly connected with other communities and can be divided into satellites and connector hubs
depending on their status within their own community (Bertolero et al.,
2015; Bullmore & Sporns, 2012; Fornito et al., 2016; Guimer`a & Amaral, 2005; Meunier et al., 2010). The difference is that connector hubs are, unlike satellites, also highly interconnected within their communities (Bertolero et al., 2015; Meunier et al., 2009; Schedlbauer & Ekstrom, 2019).
To understand composite functions such as the language and declarative memory and its cerebral substrate, the language-and- declarative memory network (LMN), it is mandatory to focus on the communication or the dynamics between the interactive functions, within a connectomic perspective. Traditionally, the connectomic approach is based on examining resting-state correlations between spontaneous BOLD signals of regions which are functionally or
anatomically connected (Bullmore & Sporns, 2012). This approach
re-veals large hierarchical and distributed brain networks related to
various functional domains (Power et al., 2011; Yeo et al., 2011),
reflecting “intrinsic” activity intervening in the absence of any
stimu-lation or task (Bolt et al., 2017; Fox & Raichle, 2007). Although these
resting-state networks (RSN) are robust (De Luca et al., 2006; Yeo et al.,
2011) and were found to be associated with behavior (e.g. Arnemann
et al., 2015; van den Heuvel et al., 2009), it is difficult to make comprehensive conclusions on network architecture and connectivity, without considering the brain activity during task (extrinsic brain ac-tivity). Studies exploring connectomic features of extrinsic or task- related networks have indeed found that they differ from intrinsic
resting-state networks (Bolt et al., 2017; Cohen & D’Esposito, 2016;
Keerativittayayut et al., 2018; Mennes et al., 2013; Spadone et al., 2015)
although others found significant similarities between them (Cole et al.,
2014; Krienen et al., 2014). Therefore, intrinsic brain architecture does not provide a complete repertoire of extrinsic functional properties, such as flexible reconfiguration when facing changing environment and task
demands (Mennes et al., 2013). The differences between intrinsic and
extrinsic networks were reported for the cognitive control (Mennes
et al., 2013; Tomasi et al., 2014), working memory (Rzucidlo et al., 2013; Stanley et al., 2015) and semantic memory (DeSalvo et al., 2014). Modern connectomic approaches allow to assess this state-dependent
reconfiguration of brain architecture (Cole et al., 2014; Fornito et al.,
2016; Sporns & Betzel, 2016) for specific cognitive functions and tasks
(e.g. He et al., 2018; Hearne et al., 2017; Schedlbauer & Ekstrom, 2019).
Task-induced changes of network modularity can predict behavioral
outcomes (Finc et al., 2017). Indeed, decreased modularity was
observed for high cognitive demands (Finc et al., 2017; Hearne et al.,
2017) and successful memory retrieval is associated with
reconfigura-tion of modular structure (Schedlbauer & Ekstrom, 2019; Westphal
et al., 2017). Overall, results suggest significant flexible reconfiguration of large-scale functional networks along rest and task-activity states for
different cognitive functions (Bassett et al., 2011; Hearne et al., 2017;
Yue et al., 2017). However, the majority of studies explored cognitive functions separately, without investigating possible interactions be-tween functions, such as a composite language and declarative memory function. A complete description of this composite function and under-lying LMN should thus be based on both extrinsic and intrinsic activities to capture flexibility and the dynamic architecture that underlies its complex links.
Moreover, a more comprehensive understanding of functional interaction based on a specific LMN network can be provided by
studying conditions showing the reorganization of language and
mem-ory functions, such as temporal lobe epilepsy (TLE) (Tracy & Boswell,
2008). This neurological condition is characterized by seizures induced
by an epileptogenic network centered on medial temporal structures (Barr, 2015), associated or not with hippocampal atrophy (Thom and Bertram, 2012). The cognitive deficits of TLE patients suggest dynamic
relationship between language and declarative memory (Alessio et al.,
2006; Bartha-Doering & Trinka, 2014; Zhao et al., 2014; Allone et al., 2017; Bell et al., 2011; Tramoni-Negre et al., 2017). This relationship also supports the necessity of evaluating this composite function within a connectomic perspective instead of language and declarative memory
separately (Waites et al., 2006). Significant reorganization of LMN
oc-curs in TLE (Liao et al., 2010; Richardson, 2012) and results from
complex interactions between neurophysiological activity (epileptic
activity) and neuroplasticity (Dinkelacker et al., 2016). By
neuro-cognitive plasticity we refer to reorganization of neurosynaptic maps
that is related to efficient cognitive functioning (Duffau, 2006).
Resting-state studies in TLE patients showed reduced functional
connectivity (Bettus et al., 2009) within “high-level” RSN such as default
mode network (DMN), dorsal attention network (DAN) and salience
network (SAL) (Burianov´a et al., 2017; Liao et al., 2010; Zhang et al.,
2009b), as well as within “low-level” RSN such as auditory and
senso-rimotor networks (Zhang et al., 2009a), and within language network
(Waites et al., 2006). In addition, TLE patients showed reduced
syn-chronization between multimodal “high-level” RSN (Burianov´a et al.,
2017), as well as between “high-level” and “low-level” RSN
(sensori-motor, Yang et al., 2018). Increased connectivity within medial
tem-poral lobes together with decreased connectivity between them and
distal networks (Englot et al., 2016; Haneef et al., 2014; Liao et al., 2010;
Roger et al., 2020a) were described in these patients and identified as dynamic diaschisis, a reorganization pattern based on hyper- and hypo-
connected remotely-located regions (Cataldi et al., 2013; Roger et al.,
2020a). Using resting-state Liao et al., (2010) found that global topo-logical measures of TLE functional networks are disrupted showing reduced clustering.
Similarly, studies focusing on extrinsic activity found global
reduc-tion in connectivity within language network (Pravat`a et al., 2011;
Vlooswijk et al., 2010) and recruitment of additional networks located
more posteriorly, due to anterior seizure activity (Protzner &
McAn-drews, 2011). Recently, He et al. (2018) reported that left temporal and right frontal regions in TLE patients showed reduced flexibility and ability to dynamically adapt to demands of a verb generation task. These regions also showed reduced communication with a core left frontal subnetwork. Overall, these authors suggested that the effect of pathol-ogy on network dynamics is more likely to manifest during language
operations than during resting-state (He et al., 2018).
Given that the majority of studies in healthy individuals and patients explored cerebral networks based on either intrinsic or extrinsic activity, it is difficult to understand how are brain networks dynamically reconfigured between resting-state and task-based activity. Addition-ally, the majority of studies did not address directly the question of interaction between language and declarative memory, as mentioned above. This fMRI study is set to bridge this gap by evaluating both intrinsic and extrinsic LMN functional connectivity (FC) in healthy controls (HC) and TLE patients and describe the network properties by
using a graph theory approach (Fornito, 2016; Rubinov & Sporns, 2010).
This allows to understand the mechanisms supporting the language and declarative memory interaction on the basis of LMN dynamic reconfi-guration according to brain activity state (intrinsic, extrinsic) and physiological (health, epilepsy) condition. The intrinsic connectivity was assessed with a resting-state protocol, while the extrinsic task-based was assessed with a language-and-memory fMRI protocol that recruits
LMN (Banjac et al., 2020). We first explored segregation property by
testing how LMN separates into modules for each state (LMN
configu-ration) using a data-driven community detection algorithm (Blondel
NeuroImage: Clinical 31 (2021) 102702
3
and then analyzing the state reconfiguration (i.e. how the configuration changes between intrinsic and extrinsic state) in healthy participants. Then we explored the integration of LMN modules based on connector hubs first within each configuration and then comparing them in order to evaluate state reconfiguration. The reorganization of LMN configu-rations and state reconfiguration in terms of segregation and integration was tested using the same approach in TLE patients and comparing the results between the groups. We evaluated cognitive efficiency of reor-ganization in TLE patients, as an indication of neuroplasticity, by asso-ciating cognitive scores with several segregation and integration parameters. We finally attempted to describe a neurocognitive integra-tive model of language and declaraintegra-tive memory interaction that is supported by a flexible LMN. Based on the previous research, we ex-pected that brain modular structure in HC shows less segregation during the task, due to a more complex cerebral activity required by the task. In addition, regions showing more flexibility between states should be the ones that allow for functional integration. Furthermore, TLE patients should show alterations of the modular structure due to disruption of functional connectivity and reduced flexibility of temporal regions. The potential difference between HC and TLE in “connector” regions should reflect compensatory mechanisms used by patients.
2. Material and methods
A schematic illustration of the study design is presented in Fig. 1.
2.1. Participants
Nineteen healthy volunteers (age 21.2 ± 2.97; 9 females; all self- reported right-handed) and 16 TLE patients (11 left TLE and 5 right TLE, age 33.8 ± 10.5; 9 females; 14 right-handed) were included in the study. The handedness was determined according to The Edinburgh
Handedness Inventory (Oldfield, 1971). The demographic and clinical
features are presented in Tables 1 and 2. Participants were native French
speakers and had normal or corrected-to-normal vision. Healthy par-ticipants received financial compensation for their participation. Pa-tients were diagnosed with drug-resistant temporal epilepsy between 2017 and 2019. The diagnoses were made by neurologists based on the recommendations of the ILAE (International League Against Epilepsy)
committee report (Wieser et al., 2001) and on a synthesis of several
evaluations (clinical, scalp/depth-EEG, MRI/PETscan). Patients were candidates for a curative surgery and the fMRI evaluations were per-formed as a part of their presurgical assessment. Patients as well as healthy participants provided written informed consent for the study that was approved by the local ethic committee (CPP: 09-CHUG-14, 04/ 06/2009 and 2017-A00384-49).
Fig. 1. Schematic representation of study pipeline. Panel A: Schematic representation of methodology. Subpanel 1. Two groups of participants, healthy participants (N = 19) and TLE patients (N = 16), performed resting-state and sentence recall task. Subpanel 2. We focused on the language-and-memory ROIs defined in previous work (Roger et al., 2019). Subpanel 3. ROIs were separated based on the resting-state network (RSN) they belonged to. Subpanel 4. We performed community detection in two groups and two tasks to explore LMN configurations, state reconfiguration and their reorganization. Subpanel 5. We determined the role (connector hub, provincial hub, satellite or peripheral node) of each LMN region based on its connectivity within module (intra-modular connectivity) and with other modules (inter-modular connectivity). In order to explore LMN integration and its state reconfiguration we focused on the connector hubs. The roles are schematically presented on Subpanel 4 with numbers corresponding the role in Subpanel 5. Panel B: Schematic representation of main terms and analyses. Both segregation and integration of LMN were explored for each state, extrinsic and intrinsic (state LMN configuration) as well as its reconfiguration between the sates in healthy par-ticipants (green). LMN configurations and state reconfiguration in terms of segregation and integration were tested using the same approach in TLE patients (pink), as well as the differences in LMN configurations and state reconfiguration between healthy controls and TLE patients (dashed lines). (For interpretation of the references to color in this figure legend, the reader is referred to the web version of this article.)
2.2. Neuropsychological data in patients
All patients underwent complete neuropsychological assessment including language and memory functions carried out by a neuropsy-chologist and a speech therapist. This general cognitive assessment was used in further analyses of the efficiency of LMN configurations and state reconfiguration in TLE patients. Specifically, the following cognitive scores were used in the analyses: (a) language scores: verbal
compre-hension index (VCI; WAIS IV, Wechsler, 2008), naming (DO80; Deloche
& Hannequin, 1997), semantic fluency (SFL) and phonological fluency
(PFL; Godefroy, 2008); and (b) memory scores: auditory memory index
(AMI), immediate memory index (IMI) and delayed memory index
(DMI; WMS IV, Wechsler, 2009). Test scores were standardized by
gender, age and sociocultural level. Detail data on patients’ cognitive
performance is presented in Table 2.
2.3. Experimental protocol
Participants first performed the GE2REC protocol for interactive
mapping of language and memory previously validated (Banjac et al.,
2020) that is composed of three runs, sentence generation (GE) and two
retrieval tasks (2REC), a recognition of stimuli presented in the first run and a sentence recall task. In order to access brain networks that reflect language and declarative memory interaction, we focused on the sen-tence recall task (abbreviated RA). During RA, participants received the auditory words previously presented GE and were asked to recall and covertly repeat the sentences that they have previously generated. The recall run was designed as a block paradigm with 5 task (8 stimuli/ condition, 40 words in total) and 5 control (fixation cross displayed for 10 s) conditions. The total duration of the run was 4.17 min (for other
details see Banjac et al., 2020). Following the recall run, each participant
underwent a resting-state for 13.20 min to measure cerebral intrinsic activity. Participants were required to lay down into the magnet, to rest with eyes open while fixating a cross centered on the screen during the entire duration of the acquisition period.
2.4. MR acquisition
Functional MRI experiments were performed at the MR facility. MR
images were acquired with a whole-body 3 T MR Philips imager (Ach-ieva 3.0 T TX Philips, Philips Medical Systems, Best, NL) with a 32-chan-nel head coil for all of the participants. During the recall task, the manufacturer-provided gradient-echo/T2* weighted EPI method was used. Forty-two adjacent axial slices parallel to the bicommissural plane were acquired in sequential mode (3 mm thickness, TR = 2.5 s, TE = 30
ms, flip angle = 82◦, in-plane voxel size = 3 × 3 mm; field of view = 240
×240 × 126 mm; data matrix = 80 × 80 pixels; reconstruction matrix =
80 × 80 pixels). During resting-state, four hundred cerebral rs-fMRI volumes were acquired using a gradient echo planar imaging sequence (FEEPI, 36 axial slices, 3.5 mm thickness, TR = 2.0 s, TE = 30 ms, flip
angle = 75◦, field of view = 192 × 192 mm, in-plane voxel size = 3 × 3
mm). In addition, a T1-weighted high-resolution three-dimensional anatomical volume (T1TFE, 128 sagittal slices, 1.37 mm thickness, field of view = 224x256 mm, in-plane voxel size = 0.89 × 0.89 mm) was acquired for each participant.
2.5. Prior data analysis and data preprocessing
2.5.1. Statistical analyses of demographic, clinical and neuropsychological characteristics
We included TLE patients with left (LTLE) and right (RTLE) origin of seizures. Since previous studies showed that these patients can differ
regarding cognitive functioning and neural organization (Besson et al.,
2014; de Campos et al., 2016; Phuong et al., 2021; Roger et al., 2020b), before conducting the main analyses planned in this study, we tested whether the LTLE and RTLE patients in our sample significantly differed regarding their clinical characteristics (age, epilepsy duration, number of AEDs, hippocampal atrophy and gender), hippocampal volume, neuropsychological performance. We did not flip the images of patients
in the L-R direction in line with recommendations (Lee et al., 2018) since
previous research found significant asymmetries in functional connec-tivity between two hemispheres mirrored over the longitudinal fissure (Raemaekers et al., 2018). Previous research showed that epilepsy pa-tients show more often atypical language lateralization than healthy
participants (Baciu & Perrone-Bertolotti, 2015; Berl et al., 2014). A
recent study also showed that language lateralization is related to functional connectivity of language system and whole-brain
organiza-tion (Wang et al., 2019). Due to this, we controlled language
laterali-zation by only including participants with left lateralilaterali-zation of language activation in frontal lobe and left to bilateral activation in temporal lobe. That way we wanted to exclude the possibility that the potential dif-ferences of LMN community structure between healthy participants and TLE patients are a result of differences in language lateralization. The lateralization indices (LI) were calculated on frontal activations during
GE task using the bootstrap method of the SPM LI toolbox (Wilke &
Lidzba, 2007). The differences between LTLE and RTLE patient groups on mentioned characteristics were tested using the Mann-Whitney U tests and Chi-square tests.
2.5.1.1. Functional MRI preprocessing. The preprocessing was
per-formed using SPM12 (Welcome Department of Imaging Neuroscience,
London, UK, http://www.fil.ion.ucl.ac.uk/spm/) running under Matlab
R2015b (Mathworks Inc., Sherborn, MA, USA) using the standard rou-tines. All images were realigned to correct the head motion, time- corrected with the mean image as the reference slice, spatially normalized to MNI (Montreal Neurological Institute) space and then spatially smoothed with an 8 mm FWHM (Full Width at Half Maximum) Gaussian kernel. The T1-weighted anatomical volume was co-registered to the mean image created by the realignment procedure and was normalized within the MNI (Montreal Neurological Institute) space. The anatomical normalization parameters were subsequently used for the normalization of functional volumes. Motion parameters from the realignment step were then analyzed using ART (Artifact Detection Tool, Gabrieli Lab, Massachusetts Institute of Technology, available at:
Table 1
Demographic and clinical data for healthy controls.
Demographic information Clinical data
Gender Age Handedness Vol hippo R Vol hippo L 1 F 19 R 3.38 3.19 2 M 19 R 3.61 3.42 3 F 19 R 3.45 3.52 4 M 21 R 3.78 3.53 5 F 18 R 3.56 3.5 6 F 18 R 3.59 3.8 7 M 20 R 3.8 3.66 8 M 23 R 3.99 3.93 9 M 23 R 4.46 3.92 10 F 19 R 3.67 3.47 11 F 18 R 3.84 3.93 12 F 29 R 3.9 3.79 13 M 21 R 4.82 4.64 14 F 25 R 3.55 3.63 15 M 19 R 3.64 3.59 16 M 21 R 4.44 4.44 17 M 23 R 3.74 3.9 18 M 25 R 4.22 4.28 19 M 23 R 4.54 4.14 Mean 8F/11 M 21 19R 3.89 3.80
Note: F – female; M – male; Age – age at the time of examination; Hand. – self- reported handedness; R – right; EZ lat. – laterality of epileptogenic zone; Vol hippo R – volume of the right hippocampus in cm3; Vol hippo L – volume of the
NeuroImage: Clinical 31 (2021) 102702 5 Table 2
Demographic, clinical and neuropsychological data for TLE patients.
Demographic information Clinical data Language and memory cognitive scores
Sex Age Hand. EZ lat. HA Vol hippo R Vol hippo L Age onset Epilepsy duration AED VCI DO80 SFL PFL AMI IMI DMI P1 F 54 R (+90%) Left No 3.41 3.11 52 2 2 0.00 0.67 1.39 −0.18 0.33 −0.99 − 0.28 P2 F 37 R (+100%) Left No 3.82 4.08 35 2 2 0.00 −0.30 0.34 −0.30 1.34 −0.47 − 0.74 P3 F 32 R (+90%) Left Yes 3.01 1.81 29 3 2 −1.08 −6.43 − 0.62 0.24 − 1.08 −1.56 − 1.41 P4 M 45 R (+20%) Left Yes 3.47 1.97 40 5 5 −0.28 −1.30 − 0.67 −1.28 − 0.52 −0.08 − 0.28 P5 M 24 R (+100%) Left Yes 4.16 2.98 17 7 3 / −1.30 − 0.34 −1.65 / / / P6 M 24 L (-80%) Left Yes 2.04 2.35 16 9 3 −0.41 −2.20 − 2.17 −0.97 − 2.33 −1.88 − 2.33 P7 M 27 R (+80%) Left No 3.99 4.19 21 6 3 0.00 −0.03 − 0.34 −0.34 1.34 0.13 0.00 P8 F 43 R (+100%) Left No 3.92 4.10 12 31 3 0.28 −1.30 − 1.65 −1.44 0.09 −0.08 − 1.13 P9 F 38 R (+100%) Left Yes 3.95 2.58 10 29 3 −1.56 −5.30 − 0.93 −0.32 0.47 0.41 0.08 P10 M 24 R (+40%) Left Yes 5.10 3.56 20 4 4 −0.13 −4.30 1.66 −0.17 0.61 0.47 − 0.08 P11 M 28 R (+100%) Left Yes 3.37 2.39 1 27 4 0.28 0.70 − 0.24 −1.03 0.67 1.08 1.34 P12 F 43 R (+100%) Right Yes 2.24 3.71 3 40 6 0.13 −2.30 − 1.51 −2.02 − 1.08 −2.33 − 2.05 P13 F 19 L (-100%) Right No 3.48 3.46 14 5 3 −1.28 −0.39 − 0.37 −0.40 0.67 0.08 − 0.61 P14 M 38 R (+100%) Right No 3.54 3.82 8 30 2 0.13 −4.30 − 1.65 −1.75 0.08 −0.08 − 0.28 P15 F 45 R (+100%) Right No 3.39 3.18 40 5 2 0.13 −0.30 0.34 −0.30 1.18 1.28 − 0.15 P16 M 20 R (+90%) Right Yes 4.72 4.80 16 4 3 0.00 −3.30 − 1.73 −1.82 0.33 1.08 0.33 Mean 8F/8M 34 14R/2L 11L/5R 9 3.60 3.26 20.88 13.06 3.13 −0.25 −1.98 − 0.53 −0.86 0.14 −0.19 − 0.51 Diff. 0.29 29.5 0.37 / 0.78 31 14 37 21.5 30 18.5 32 37 42.5 25.5 19.5 25 p 1 0.82 1 / 0.593 0.692 0.126 0.281 0.495 0.764 0.42 0.609 0.281 0.089 0.951 0.499 1
Note: F – female; M – male; Age – age at the time of examination; Hand. – handedness evaluated with Edinburgh quotient (Oldfield, 1971) ; L – left, R – right; EZ lat. – laterality of epileptogenic zone; HA – hippocampal atrophy; Vol hippo R – volume of the right hippocampus in cm3; Vol hippo L – volume of the left hippocampus in cm3; Age onset – age of onset of seizures; AED – number of epileptic drugs taken; VCI – standardized score of
verbal comprehension index for verbal semantic memory (Wechsler, 2008); DO80 - standardized score for French version of naming task (Deloche & Hannequin, 1997); SFL – semantic fluency, z core of performance on the task of categorical word generation (Godefroy et al., 2008), PFL – phonological fluency, z score of performance on the task of alphabetical word generation (Godefroy et al., 2008); AMI – standardized score of auditory memory (Wechsler, 2009); IMI - standardized score of immediate memory (Wechsler, 2009); DMI – standardized score for delayed memory (Wechsler, 2009). Diff – difference between LTLE and RTLE patients: for variables sex, handedness and HA values of χ2 are presented and for all the others values of Mann-Whitney U test are provided with corresponding p value.
S.
Banjac
et
https://www.nitrc.org/projects/artifact_detect). We considered as out-liers those volumes that had more than 3 mm interscan movement of in translation, 0.02 rad in rotation and 3 SD global interscan signal in-tensity relative to the session mean. Participants who had more than 15% of scans marked as outliers were excluded from the study. Healthy participants and TLE patients did not differ neither during the resting- state or sentence recall regarding the mean movement value nor
num-ber of outliers (Supplementary Material, Table S1).
2.5.1.2. Network analysis.
•Language-and-memory network: parcellation & node definition ROIs of LMN explored in this study were previously defined and
validated by Roger et al. (2020a) in the space of Atlas of Intrinsic
Con-nectivity of Homotopic Areas (AICHA, Joliot et al., 2015). Despite
standard left lateralization of language network, we tested the nodes across both hemispheres since language reorganization in TLE patients
can be interhemispheric (Baciu & Perrone-Bertolotti, 2015) and given
that language engages nondominant hemisphere in healthy subjects (Hickok & Poeppel, 2007; Vigneau et al., 2011). Additionally, we have separated the hippocampus into anterior and posterior parts since various reorganization patterns were found for the anterior and
poste-rior hippocampal networks (Li et al., 2017). We also used specific ROIs
for anterior and posterior hippocampi (left and right) for each partici-pant given that in patients, the hippocampal atrophy may have
signifi-cant effects (Roger et al., 2020a). However, in order to avoid any
artificial differences between two groups of participants subject-specific hippocampal ROIs for healthy participants were also used. Subject- specific hippocampal ROIs were generated from T1w anatomical
im-ages with Vol-Brain processing pipeline (http://volbrain.upv.es). This
pipeline provided subject-specific MNI registered hippocampal ROIs. The anterior and posterior parts of these subject-specific hippocampal ROIs were defined through their overlap with anterior and posterior
hippocampal masks of the AICHA atlas (Joliot et al., 2015). The final
LMN network comprised 74 ROIs (37 per hemisphere). Panel A,
Sub-panel 2 of Fig. 1 shows the LMN on a brain template and a detailed
description of ROIs is provided in the Table S2.
ROIs were also classified according to their membership to a specific resting-state network. For this purpose we used the 7 resting-state net-works (RSN) atlas defined by Yeo and colleagues (2011). To precisely determine which RSN network each LMN region belonged to, the LMN
was overlaid with the RSN map (Yeo et al., 2011). The number of
overlapping voxels with each network was calculated for each region. A ROI was determined to belong to the RSN with which it had the largest
percentage of overlapping voxels. Panel A, Subpanel 3 of Fig. 1 shows
LMN ROIs according to the RSN they belong to. •Connectivity analyses
The FC within the LMN was calculated based on the resting-state and
the recall activity using a Graph theory (GT) analysis (Fornito, 2016;
Rubinov & Sporns, 2010). The CONN toolbox (Functional Connectivity Toolbox, Gabrieli Lab, Massachusetts Institute of Technology) was used
to obtain FC matrices and the Brain Connectivity Toolbox (BCT, Rubinov
& Sporns, 2010, available at https://sites.google.com/site/bctnet/) and
GraphVar toolbox (Kruschwitz et al., 2015, available at https://www.
nitrc.org/projects/graphvar/) were used for graph theory analyses. The CONN Toolbox (Functional Connectivity Toolbox, Gabrieli Lab, Massachusetts Institute of Technology) provides ROI-to-ROI correlation analysis according to the temporal fluctuations of BOLD signals. The first step consisted of denoising the pre-processed unsmoothed data by regressing out the BOLD signal from the white matter, the CSF as well as outliers and movements obtained by ART and SPM. For the recall task, we also entered in the regression a separate regressor for the
experimental condition, according to other previous studies validating
this approach (Cao et al., 2014; Cole et al., 2014; Mohr et al., 2016). The
resulting residual time series were temporally filtered to remove low- frequency scanner drifts and/or high-frequency physiological noise using band-pass filtered (0.008–0.09 Hz) for the resting-state and high- pass filter (0.008 Hz) for the recall task. Resting-state data processed in this way reflected intrinsic network, while that resulting from the recall task, reflected extrinsic network. Then the Z score of r-Pearson corre-lation coefficient was calculated for each participant by CONN toolbox for every possible pair of residual time series (2701 pairs of 74 ROIs of
the LMN). In agreement with previous studies (Bolt et al., 2017; Cohen &
D’Esposito, 2016; Finc et al., 2020) especially the one using similar
community detection algorithm (Schedlbauer & Ekstrom, 2019), the
negative correlations were set to zero. However, for validation purposes the algorithm was also run with preserved negative correlations and the
main findings remained similar (see Figure S1). The resultant 74x74
matrices were then used in the statistical analyses described hereinafter.
2.6. Data analysis 2.6.1. LMN segregation
• LMN configurations and state reconfiguration
Modularity or community detection enables a data-driven partition
of a network into modules showing its segregation properties (Fornito
et al., 2012). Community detection algorithm was performed in healthy participants to analyze LMN state configurations. Data-driven commu-nity structure was assessed by applying modularity maximization
al-gorithm (Louvain greedy alal-gorithm, Blondel et al., 2008; Rubinov &
Sporns, 2010) to individual correlation matrices with positive, weighted edges, for each state separately. Given that the community partition can
vary with each run of the algorithm (Rubinov & Sporns, 2010), we
applied a consensus approach (Lancichinetti & Fortunato, 2012; Sporns
& Betzel, 2016) similarly to prior studies (Dwyer et al., 2014; Hearne et al., 2017; Schedlbauer & Ekstrom, 2019). The applied approach was meant to estimate the most stable network partitions within a group not only across algorithm iterations, but also across the thresholds as
pro-posed by Schedlbauer and Ekstrom (2019). The detailed explanation of
the procedure is provided in the Supplementary Material. The
commu-nity detection on group level provided the modular partition, or LMN configuration, for each state and its corresponding modularity index Q showing the degree to which the matrix was able to be subdivided into
nonoverlapping modules (Rubinov & Sporns, 2010, 2011). The modules
of the final network partitions were named based on the neuroana-tomical localization of regions that were forming them. To test state reconfiguration in terms of segregation we calculated the difference in the optimal group modular decomposition measured via the modularity index Q between states and the the variation of information (VIn) to see if the module partitions differ between the states. VIn quantifies the information that is intrinsic to the two partitions corrected by the
in-formation that they share (Meil˘a, 2007). To test the statistical
signifi-cance of index Q difference and VIn, we implemented repeated measure
permutation procedure (Dwyer et al., 2014; Hearne et al., 2017) that is
explained in detail in Supplementary Material. Using the group modular
partitions, we identified the regions that altered their module alliance
between the states, called “movers” (Schedlbauer & Ekstrom, 2019). The
modular reconfiguration of modules was quantified by a proportion of reconfiguration (pr) obtained by dividing the number of regions within a resting-state module that change the module during the task with the number of regions within that resting-state module.
• Reorganization of LMN configurations and state reconfiguration In order to test the reorganization of LMN configurations we per-formed the above-mentioned data-driven community detection
NeuroImage: Clinical 31 (2021) 102702
7
algorithm in TLE patients and we calculated the change of modularity index Q and VIn to explore the reorganization of state reconfiguration. Additionally, the community detection was performed on an individual- level for TLE patients providing for each patient the modular partition for each state and modularity index Q. Based on this, the state reconfi-guration on individual level was calculated as the difference between modularity index Q for two states and between the number of modules. The aim of these TLE individual-level analyses was to test the effec-tiveness of LMN configurations and state reconfiguration by relating them to clinical and neuropsychological characteristics of patients.
We tested the significance of the difference between LMN configu-rations and state reconfiguration observed in healthy participants and the reorganization observed in TLE patients in three ways. First, we tested the significance of the difference between groups in segregation and modular partition of LMN configurations during each state using mentioned repeated measure permutation procedure for difference of group-level modularity index Q and VIn of group partitions. Second, to test the group differences in the ways that modules were segregated in LMN configurations, we analyzed physical distances within and between observed modules. Euclidian distance was calculated between the re-gions that composed one module as well between rere-gions forming
different modules (Alexander-Bloch et al., 2013). We compared mean
within modules and between modules distances among groups for each state using the two-sample t-test. Third, since the epileptogenic zone of our patients is situated in temporal lobe we tested if TLE patients differed from healthy participants in terms of ability of these regions to change modules during state reconfiguration. This was done by comparing the number of “movers” in temporal and frontal lobe be-tween the groups using the Chi-square test.
2.6.2. LMN integration
•LMN configurations and state reconfiguration
In order to analyze the integration in the observed LMN community structures, we calculated the roles of the regions within each LMN configuration in healthy participants. Topological roles were assigned to each node based on its intra- and inter- modular connections. To that
end we calculated normalized intra-modular degree (z, Meunier et al.,
2009) whose value is higher if a node has a large number of intra-
modular connections in comparison to other nodes in the same mod-ule. We measured inter-modular connectivity with the participation
coefficient (Pc, Rubinov & Sporns, 2010). Due to the narrow distribution
(Schedlbauer & Ekstrom, 2019) and dependency on the number of
modules (Fornito et al., 2016), the Pc value was standardized within
given community partition (Pcs). As in previous studies, the intra- and inter-modular plane was divided into four domains due to the smaller
number of nodes within LMN (Meunier et al., 2009; Schedlbauer &
Ekstrom, 2019). Nodes were considered as connector hubs if they had both high z (≥0) and Pcs (≥0) and as provincial hubs if they had high intra-modular connectivity (z ≥ 0), but low Pcs (<0). Nodes that had low z (<0) were considered as satellite nodes if they had high Pcs (≥0), or as
peripheral nodes if their Pcs was low (<0) (Guimer`a & Amaral, 2005;
Meunier et al., 2009; Schedlbauer & Ekstrom, 2019). The roles were determined based on final group modular partition for each state and corresponding across-subjects mean FC matrices for group-level roles and corresponding individual FC matrices for individual-level roles. Nodes and their respective roles were grouped based on the RSN network nodes belonged to. State reconfiguration in terms of integration was tested by analyzing the number of connector hubs between two states in healthy participants using the Mann-Whitney for each network using the individual level data (i.e. number of connector hubs in each participant). We also analyzed the distribution of roles in the “mover” regions in each group using Chi-square Goodness of Fit test.
•Reorganization of LMN configurations and state reconfiguration
The same analysis was performed in TLE patients to test the reor-ganization of LMN configurations and state reconfiguration. Moreover, to test the difference between LMN state reconfiguration and its reor-ganization in terms of integration, we compared the change in the number of connector hubs within each RSN network between the groups. To this end, the change in the number of connector hubs was calculated as the difference between number of connector hubs during the rest and during the recall task for each network and each participant. Finally, the Mann–Whitney U test was used to test the differences in the connector hub change between the healthy participants and TLE pa-tients for each network separately. The results were FDR corrected for multiple comparisons.
For the purpose of analyzing in more details a possible disorgani-zation of LMN integration in patients, we calculated a specific graph theory parameter, the hub disruption index (HDI, for details on
calcu-lation of this index see Achard et al., 2012; Roger et al., 2020a) with Pcs
values for LMN configurations. The HDI can indicate whether the inte-gration property of a specific region or node is increased or decreased. The HDI was first calculated on a group level using in order to compare groups and check if there is a general reorganization or disruption of inter-modular integration in TLE patients. The groups were compared with a two-sample t-test. Additionally, we calculated the HDI on regional level in order to identify regions that show the highest increase/ decrease of inter-modular connectivity between the groups.
2.6.3. Efficiency of the reorganization of LMN configurations and state reconfiguration
The efficiency of the reorganization of LMN configurations and state reconfiguration observed in TLE patients was tested in two ways. First, the Spearman correlation was calculated between standardized
lan-guage and memory scores (Table 2) and a) individual modularity index
Q and the number of modules for each state and their change between states and b) HDI values. Second, for each neuropsychological test TLE patients were divided into high or low performance group depending on whether their score was above or below the group median. Then the Mann-Whitney U test was used to analyze the differences between high and low performers on FC parameters. For these analyses, both uncor-rected and FDR coruncor-rected values are reported. The results that do not pass FDR correction are regarded as only exploratory.
3. Results
3.1. Statistical analyses of demographic, clinical and neuropsychological characteristics
We first tested the similarity between left and right TLE patients before combining them in one group. There were no significant differ-ences in demographic and clinical data, and neuropsychological scores
between left and right TLE subgroups (Table 2). There was no intra-
group difference between left and right hippocampi in neither of the patient groups (LTLE: U = 39, p = .158; RTLE: U = 16, p = .465). When compared to healthy participants, the LTLE patients had smaller left hippocampus (U = 52, p = .024), while the volume of the right hippo-campus volume was not different (U = 86.5, p = .438). No significant differences were found between the RTLE patients and healthy partici-pants with respect to the volume of hippocampi (left: U = 41, p = .644; right: U = 23, p = .082). Activations during the language task were found to be consistently left lateralized (LI greater than 0.2) in the frontal lobe for all TLE patients (U = 39.5, p = .173) and they did not
differ from healthy participants (U = 196.5, p = .140, Table S3 provides
LIs of all participants). In addition, temporal lobe language activations were mostly left lateralized and there was no difference between TLE patients (U = 21.5, p = .496) or between patients and healthy (U = 158.5, p = .829).
Since no significant differences between left and right TLE patients were found, we finally combined them and analyzed them as a single
patient group. Nevertheless, the descriptive statistics of the main
network parameters for LTLE and RTLE are presented in Table S12.
3.2. LMN segregation
3.2.1. LMN configurations and state reconfiguration
Based on a data-driven community detection algorithm we identified state configurations which show how LMN splits into separate modules
(i.e. subset of highly interconnected regions) during each state (
Bull-more & Sporns, 2012; Fornito et al., 2016; Meunier et al., 2010). Our results showed that resting-state and task LMN configurations in healthy participants were composed of the same number of modules with no significant difference between the modularity indexes Q (ΔQ = 0.02, p
=.391). Although the number of modules was the same, their
compo-sition (i.e. partition) was different between the states (VIn = 0.34, p < .001). Module partitions and reconfigurations of resting-state modules
in healthy participants are shown in Panel A of Fig. 2 and module
affiliation of each region is provided in Table S4.
The proportion of reconfiguration (pr) used to quantify the extent to which the resting-state modules changed compared to task are presented
in the Panel A, Subpanel 1 of Fig. 2 and Table S4 provides details on
movement of each region. The most reconfigured modules in healthy participants were the second DMN-DAN fronto-temporo-parietal (pr = 1) and the temporo-limbic module (pr = 0.526).
3.2.2. Reorganization of LMN configurations and state reconfiguration
In TLE patients, the transition between the states was accompanied by a change of the number of modules, as indicated by a significant difference between the modularity indexes Q (ΔQ = 0.05, p < .05) and the module partitions were significantly different between two states (VIn = 0.22, p < .001). The extrinsic configuration of LMN in TLE pa-tients was found to be more modular and to be comprised of a higher number of modules in comparison to healthy participants (ΔQ = 0.07, p
< 0.01), while the difference was not significant between intrinsic
Fig. 2. Segregation of LMN in terms of community structures found in healthy participants (Panel A) and TLE patients (Panel B) during the two states. The alluvial diagrams present the dynamics of state reconfiguration of modules from resting-state (Subpanel 1) to sentence recall (Subpanel 2) in healthy participants (Panel A) and its reorganization it TLE patients (Panel B). For each module, the composition is indicated in percentages of networks that form a given module. For each resting- state module the proportion of reconfiguration (pr) is indicated. The architectures of modules are presented in the templates (Subpanels 3 and 4). Subpanels 5 shows the “core” regions of healthy participants and TLE patients that remain in the same module from rest to task (dark blue) and “movers” that change their module (light green). F-T-P = Fronto-temporo-parietal module, REST = resting-state, RECALL = sentence recall task. (For interpretation of the references to color in this figure legend, the reader is referred to the web version of this article.)
NeuroImage: Clinical 31 (2021) 102702
9
configurations (ΔQ = 0.004, p = 0.727). In addition, both resting-state (VIn = 0.31, p < .001) and task (VIn = 0.33, p < .001) modular parti-tions were significantly different between two groups. Module partiparti-tions and reconfigurations of resting-state modules in TLE patients are shown
in Panel B of Fig. 2 and module affiliation of each region is presented in
Table S4.
Additionally, our results indicated that the anatomical (i.e. Euclidean) distance of the regions within modules was significantly smaller in TLE patients than in healthy participants during the task (t = 2.562, p < 0.05). In other words, regions within modules of TLE patients
were anatomically closer to each other than in controls.
Furthermore, the temporo-limbic (pr = 0.071) and temporal lateral module (pr = 0.154) in TLE patients showed the smallest change. Consistent with this result, a Chi-square test showed that that mesial and lateral temporal regions were less flexible (i.e. having less “movers”) in
TLE patients compared to healthy participants (χ2(1, N = 56) = 7.29, p
<.01), while the flexibility of frontal regions was not different between
the groups (χ2(1, N = 48) = 0.1, p = .755).
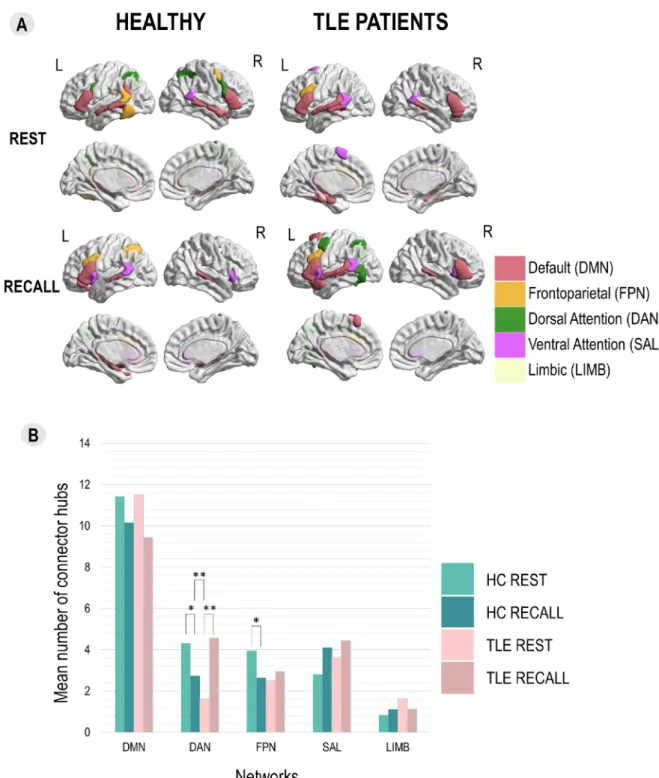
Fig. 3. The integration of LMN assessed via distribution of connector hubs between groups and tasks. Panel A: Topography of the most common connector hubs according to groups and tasks. We present the regions that were connector hubs in more than half of the group (10/19 in healthy and 9/16 in TLE patients). Colors of the regions represent their network affiliation. Panel B: Distribution of connector hubs according to groups and tasks for each network showing LMN state recon-figuration and LMN reorganization in terms of integration. Significant differences at p < 0.01 threshold with FDR correction are marked with ** and those at p < 0.05 are marked with *. HC = healthy controls, REST = resting-state, RECALL = sentence recall task.
3.3. LMN integration
3.3.1. LMN configurations and state reconfiguration
The integration properties were explored via connector hubs,
espe-cially their reconfiguration between the tasks. Panel A of Fig. 3 shows
the regions that were connector hubs in more than 50% of participants
of both groups across the states and Table S5 presents the roles of LMN
regions based on their normalized intra-modular degree and standard-ized participation coefficient obtained with the across-subjects mean FC
matrices. Our analyses showed that in healthy participants (Fig. 3, Panel
B), less regions belonging to DAN (U = 78.5, pFDR <0.05) and FPN (U =
99.5, pFDR <0.05) were connector hubs during recall compared to rest.
Additionally, to explore the regions that changed modules between the states (i.e. “movers”), we analyzed the distribution of their roles across states. Our analyses showed that “movers” were more often connector hubs and satellite nodes during both states in healthy
par-ticipants (REST: χ2(3, N = 532) = 116.72, pFDR <0.05; RA: χ2(3, N =
532) = 125.79, pFDR <0.05) having thus primarily the connecting roles.
Table S6 provides the role distribution of “movers” across states and groups.
3.3.2. Reorganization of LMN configurations and state reconfiguration
In TLE patients, higher number of DAN regions were connector hubs
during recall than during task (U = 227.5, pFDR <0.01). Interestingly
this variation was different between groups for DAN (U = 16.5, pFDR <
0.01). Detailed results are presented in Tables S7 and S8. Moreover, the
“movers” in TLE patients were also more often connector hubs and
satellite nodes during both states (REST: χ2(3, N = 400) = 14.12, pFDR <
0.05; RA: χ2(3, N = 400) = 147.02, pFDR =0.543).
Our HDI results (Fig. 4) indicated that TLE patients showed
signifi-cant disruption of inter-modular connectivity in both states compared to
healthy participants (REST: t = -11.65, pFDR <0.01; RA: t = -3.86, pFDR
<0.01). We further explored this inter-modular connectivity disruption
on a regional level. The biggest disruption of inter-modular connectivity in patients during resting-state was found within FPN and DAN (bilateral intraparietal sulci), while the increase was observed within DMN (bilateral hippocampal gyri, right fusiform, bilateral parahippocampus and left posterior cingulate gyrus). Conversely, the biggest disruption of inter-modular connectivity during the task in patients was identified within DMN (bilateral anterior hippocampus, left posterior hippocam-pus, bilateral amygdala and left parahippocampus). The HDI results are
presented in Fig. 4.
3.4. Efficiency of the reorganization of LMN configurations and state reconfiguration
The efficiency of the reorganization of LMN configurations and state reconfiguration found in TLE patients was tested using the Spearman rank correlation and the Mann-Whitney U test. The obtained results were not significant after FDR correction. The results are presented in
Tables S9 and S10.
Since there was a significant age difference between healthy partic-ipants and TLE patients (U = 269, p < .001), we tested if the main network parameters are age-related and for potential effect of age. No significant effect was obtained. Detailed results are presented in
Table S11.
4. Discussion
In the present study, we were interested to describe the LMN (see
Roger et al., 2020a) underlying the language and declarative memory composite function. Our hypotheses were that the LMN configuration is dynamic so that it reconfigures according to brain activity (intrinsic, resting-state; extrinsic, task-induced) and condition (normal, HC; neurological, TLE patients). LMN configurations, dynamics of state reconfiguration and their reorganization were assessed by measuring
the segregation (community detection) and the integration (connector hubs and inter-modular connectivity) properties. Our objective was to determine how LMN reconfigures across states (resting vs. task-induced) and groups (healthy vs. TLE patients) to support language and declar-ative memory interaction.
Analyses were first performed for HC to assess LMN configurations and state reconfiguration. Contrary to our expectations, the segregation did not vary across intrinsic and extrinsic states in terms of number of modules. However, rest and task differed in modular compositions of LMN configurations in line with the idea that task-related
reconfigura-tions are necessary to adapt to task-demands (Cohen & D’Esposito,
2016). More specifically, LMN-intrinsic configuration included the
following five modules (see Fig. 2, Panel A, Subpanel 1): fronto-parietal,
frontal, temporo-limbic and two fronto-temporo-parietal. The second fronto-temporo-parietal module includes language key regions (left tri-angularis and orbitalis, left superior and middle temporal, supra-marginal gyri) which is in agreement with previous results revealing
correlated activity of language systems during rest (Alavash et al., 2019;
Muller & Meyer, 2014). The segregation of LMN extrinsic configuration,
illustrated in in Fig. 2 (Panel A, Subpanel 2), shows five modules: fronto-
parietal, frontal, temporo-limbic, fronto-temporo-parietal and temporo- mesial. There were two main segregation changes in task compared to rest in HC: (a) language key–regions from second fronto-temporo- parietal module migrated to other modules; (b) the hippocampus and amygdalae of temporo-limbic module migrated into a separate temporo-
mesial module (Fig. 2, Panel A). The temporo-mesial module in sentence
recall task could be engaged in the episodic retrieval and simultaneous encoding processes, as well as in the binding of retrieved episodes and
lexico-semantic information into a coherent experience (Cooper &
Ritchey, 2020; Ranganath & Ritchey, 2012). Therefore, the temporo- mesial (hippocampo-amygdalar) module and its dynamics across states may serve as a specialized interface between language and
memory, as suggested by Duff & Brown-Schmidt (2012). This module
that emerges during the task, could be supporting language and declarative memory based on its flexible interactions with various
cortical networks enabling both episodic retrieval (Geib et al., 2017;
Westphal et al., 2017) and language processing (Covington & Duff, 2016; Piai et al., 2016). The composition of the first fronto-temporo- parietal module changed in task compared to rest by including supple-mentary lateral temporal regions required by lexico-semantic and syn-tactic processes typically recruited during a sentence recall task (Menenti et al., 2012; Price, 2012). In conclusion, regions showing
modular shift between states in HC (see Fig. 2, Panel A, Subpanel 5) were
those regions described as key either for language (Price, 2012) or for
memory (Duff & Brown-Schmidt, 2012; Ranganath & Ritchey, 2012).
The synthetic representation of these findings is presented in Fig. 5
through a model of language and declarative memory dynamic inter-action based on LMN. The more detailed description of the model is
provided in Supplementary material.
State reconfiguration of modular composition in HC concerned mainly regions having satellite or connector hub role (see Table 6S), as
previously suggested (Schedlbauer & Ekstrom, 2019). Additionally,
majority of “movers” that had connecting role (either as connector hub or satellite node) belonged to DMN such as the middle and posterior temporal, superior frontal and prefrontal regions that were proposed to connect DMN to other networks, especially language network, providing
thus DMN with linguistic information (Gordon et al., 2020). Globally,
the segregation and integration results suggest that LMN state reconfi-gurations described in HC are mainly based on modular flexibility of connector nodes when facing task requirement.
The further objective of this study was to understand LMN configu-rations and state reconfiguconfigu-rations in patients with TLE. The state reconfiguration of LMN showed increase in segregation and significant changes in modular composition. LMN was composed of four modules in its intrinsic configuration during rest: fronto-parietal, frontal, temporo-
NeuroImage: Clinical 31 (2021) 102702
11
Fig. 4. Reorganization of LMN state configurations in terms of integration (inter-modular connectivity) expressed via HDI (hub disruption index). Sub-panel A shows group differences between healthy participants and TLE pa-tients in terms of HDI for resting-state and sentence recall. Differences that are significant after the FDR correction on the p < 0.01 level are marked with **. Subpanel B shows the differences in inter-modular connectivity on regional level observed when comparing two groups for each state. Colors of the gions represent their network affiliation. Template representations show re-gions with the greatest differences between the groups. Blue rere-gions show the greatest decrease in inter-modular connectivity in patients compared to control and regions in red show the greatest increase. HC = healthy controls, REST = resting-state, RECALL = sentence recall task, HDI = hub disruption index. (For interpretation of the references to color in this figure legend, the reader is referred to the web version of this article.)
extrinsic configuration (Fig. 2, Panel B, Subpanel 2) during task: fronto- parietal, frontal, temporo-limbic, temporal lateral, insulo-cingulate and temporo-parietal. Compared to HC, TLE did not show specific modules composed of language key regions (second fronto-temporo-parietal in HC) during rest. Also, lateral superior and middle temporal regions merged into one specific temporal lateral module during both rest to task which was not the case for HC. Additionally, the temporo-limbic module composed of memory key regions was smaller and limited to antero-lateral temporal regions in patients compared to HC during rest, and temporal mesial module did not separate from temporo-limbic module during the task. Correspondingly, temporo-limbic and tempo-ral latetempo-ral modules showed reduced flexibility during state reconfigu-ration of LMN, as did temporal regions in general compared to HC (Fig. 2, Panel B). The reduced reconfiguration ability of these modules and regions in patients can be explained by the location of the
epilep-togenic zones in temporal regions (Barr, 2015; Thom and Bertram,
2012) so the epileptic discharges could be preventing normal
reconfi-gurations of these regions. Furthermore, the segregation of insulo- cingulate module in TLE during the task can be related to the task
de-mands for overt speech inhibition (Lœvenbruck et al., 2018; Oh et al.,
2014). Similarly, the temporo-parietal module composed exclusively of
DAN and FPN regions in TLE patients during task can be explained by a
supplementary requirement of control processes during the task (Dixon
et al., 2017). Overall, difficulties in episodic retrieval (Rzezak et al.,
2017) and naming (Allone et al., 2017) usually observed in TLE patients,
might be due to the absence of specialization of the hippocampo- amygdalar module and sharing of the already reduced resources with semantic memory. As a compensatory mechanism, insulo-cingulate and temporo-parietal segregate, suggesting that compared to HC, TLE need more effort to control covert speech and more cognitive control to perform the combined language-and-memory task. Furthermore, re-gions were grouped into modules more based on their physical prox-imity in TLE, contrary to what could be expected for complex cognitive tasks such as recall task, which generally rely on long-range integrative
connections (Cohen & D’Esposito, 2016). This can be explained by the
loss of distant connections as a result of epileptic discharges and their
high metabolic cost, as previously suggested (Cohen & D’Esposito, 2016;
Englot et al., 2016; Haneef et al., 2014; Lee et al., 2018; Liao et al., 2010; Roger et al., 2020a). The local organization of modules and their greater segregation, may be beneficial for patients since it can prevent from a
dysfunction or damage propagation throughout the network (Fornito
et al., 2016).
LMN integration and its change between states was assessed via connector hubs in HC and TLE patients and the two groups were compared. Patients showed increased number of DAN connector hubs
during task compared to rest (Fig. 3, Panel B), suggesting that patients
rely more on DAN regions for enabling the communication and the cooperation between language and memory processes and networks due
Fig. 5. Schematic representation of the model of language and declarative memory dynamic interaction based on LMN. Panel A shows state reconfiguration from intrinsic to extrinsic state during sentence recall. Only the regions that changed module (“movers”) are colored and the colors correspond to their modules for each state. Non-mobile regions (that remain in the same module) are presented in gray. Temporo-lateral module in rest divides into temporo-lateral and temporo-mesial modules in task that are engaged in semantic and episodic memory respectively. Fronto-temporo-parietal module found during rest includes language key-regions that separate during the task into modules that are engaged in lexico-semantic access, syntactic processing and sentence generation. Panel B shows cognitive processes recruited by the composite language and declarative memory function and the underlying LMN during the task. Within each subpanel we present language and declarative memory subprocesses and the corresponding modules presented in color. Fronto-temporo-parietal and temporo-limbic modules are engaged in lexico- semantic access while temporo-limbic module is also engaged in episodic retrieval (Subpanel 1). Hippocampo-amygdalar module is engaged in episodic retrieval and fronto-parietal module in concept access (Subpanel 2). Through the connection of hippocampo-amygdalar and fronto-parietal modules, the sentence is recalled and the information is transferred to working memory. Fronto-parietal and frontal modules are engaged in syntactic processing and sentence production (Subpanel 3). Hippocampo-amygdalar module can also access the information from all modules, combine it into a complete experience and perform encoding in parallel (Sub-panel 4).