HAL Id: hal-01448651
https://hal.univ-reunion.fr/hal-01448651
Submitted on 2 Feb 2017
HAL is a multi-disciplinary open access
archive for the deposit and dissemination of
sci-entific research documents, whether they are
pub-lished or not. The documents may come from
teaching and research institutions in France or
abroad, or from public or private research centers.
L’archive ouverte pluridisciplinaire HAL, est
destinée au dépôt et à la diffusion de documents
scientifiques de niveau recherche, publiés ou non,
émanant des établissements d’enseignement et de
recherche français ou étrangers, des laboratoires
publics ou privés.
Shear velocity structure of the crust and upper mantle
of Madagascar derived from surface wave tomography
Martin Pratt, Michael Wysession, Ghassan Aleqabi, Douglas Wiens, Andrew
Nyblade, Patrick Shore, Gérard Rambolamanana, Fenitra
Andriampenomanana, Tsiriandrimanana Rakotondraibe, Robert Tucker, et al.
To cite this version:
Martin Pratt, Michael Wysession, Ghassan Aleqabi, Douglas Wiens, Andrew Nyblade, et al.. Shear
velocity structure of the crust and upper mantle of Madagascar derived from surface wave tomography.
Earth and Planetary Science Letters, Elsevier, 2017, 458, pp.405-417. �10.1016/j.epsl.2016.10.041�.
�hal-01448651�
Shear
velocity
structure
of
the
crust
and
upper
mantle
of
Madagascar
derived
from
surface
wave
tomography
Martin
J. Pratt
a,
∗
,
Michael
E. Wysession
a,
Ghassan Aleqabi
a,
Douglas
A. Wiens
a,
Andrew A. Nyblade
b,
Patrick Shore
a,
Gérard Rambolamanana
c,
Fenitra Andriampenomanana
c,
Tsiriandrimanana Rakotondraibe
c,
Robert
D. Tucker
d,
Guilhem Barruol
e,
Elisa Rindraharisaona
faWashingtonUniversityinSt.Louis,MO,USA bPennsylvaniaStateUniversity,StateCollege,PA,USA
cInstitutObservatoireetGeophysiqued’Antananarivo,Madagascar dUniversityofMaryland,CollegePark,MD,USA
eLaboratoireGéoSciencesRéunion,UniversitédelaRéunion,InstitutdePhysiqueduGlobedeParis,UMRCNRS7154,UniversitéParisDiderot,
F-97744 Saint Denis,France
fDeutschesGeoForschungsZentrum(GFZ),Germany
a
r
t
i
c
l
e
i
n
f
o
a
b
s
t
r
a
c
t
Articlehistory: Received16July2016
Receivedinrevisedform15October2016 Accepted21October2016
Availableonline22November2016 Editor:P.Shearer Keywords: surfacewave ambientnoise tomography Madagascar intraplatevolcanism
Thecrustand uppermantleoftheMadagascarcontinentalfragmentremainedlargelyunexploreduntil a seriesof recent broadband seismicexperiments. An island-widedeployment of broadband seismic instrumentshasallowedthefirststudyofphasevelocityvariations,derivedfromsurfacewaves,across theentire island.LateCenozoicalkalineintraplatevolcanismhasoccurredinthreeseparateregionsof Madagascar(north, centraland southwest),withthe northandcentral volcanismactive until <1 Ma,
butthe sourcesofwhichremainsuncertain.Combinedanalysisofthree complementarysurfacewave methods (ambient noise, Rayleigh wavecross-correlations, and two-plane-wave) illuminatethe upper mantledowntodepthsof150 km.Thephase-velocitymeasurementsfromthethreemethodsforperiods of8–182 sarecombinedateachnodeandinterpolatedtogeneratethefirst3-Dshear-velocitymodelfor sub-Madagascarvelocitystructure.Shallow(upper10 km)low-shear-velocityregionscorrelatewellwith sedimentarybasinsalongthewestcoast.Uppermantlelow-shear-velocityzonesthatextendtoatleast 150 kmdeepunderliethenorthandcentralregionsofrecentalkalimagmatism.Theseanomaliesappear distinctatdepths<100 km,suggestingthatanyconnectionbetweenthezonesliesatdepthsgreaterthan
theresolutionofsurface-wavetomography.Anadditionallow-shearvelocityanomalyisalsoidentifiedat depths50–150 kmbeneaththesouthwestregionofintraplatevolcanism.Weinterpretthesethree low-velocityregionsasupwellingasthenospherebeneaththeisland,producinghigh-elevationtopographyand relativelylow-volumemagmatism.
1. Introduction
Though Madagascar is a large island with a geologic history extendingfar back intothe Archean (Collins, 2006; Tuckeret al., 2011),itscrustandmantlestructurehavebeenlargelyunexplored by seismic methods until now. Despite recent surface geologic mapping,culminating inthehigh-resolution geologicmapofRoig etal. (2012),thelackofsubsurfaceobservationshaspreventedan
accurateinterpretationofthegeologicandtectonichistoriesofthe region.Forexample,priortothecurrentstudies,thecrustal thick-ness of the island hadonly been inferred froma gravity survey (Fourno andRoussel, 1994) and more recently by receiver func-tion techniques applied at the few permanent seismic stations (Rindraharisaonaetal.,2013).
OneofthemoreunusualaspectsofMadagascangeologyisthe occurrenceofseveralepisodesofCenozoicvolcanisminthecentral (Itasy/Ankaratra) and northern regions (Nosy Be/Massif D’Ambre) of the island (Emerick and Duncan, 1982; Nougier et al., 1986; Tucker and Conrad, 2008) (Fig. 1). These two regions have been
Fig. 1. TopographicmapoftheMadagascar/Mozambiqueregion.SimplifiedgeologyforMadagascarisadaptedfromRoigetal. (2012),showingPrecambrianmetamorphic terranesconsistingofArchean cratonicfragments,theBemarivoGroup,andtheuntexturedAntananarivoGroup.Phanerozoicsedimentscovermuchofthewestof Madagas-car.Cenozoicvolcanicareasareasmarked,asarePrecambrianshearzonesandthepost-MioceneAlaotra–Ankaygrabenstructure.Initialsareplacenamesreferredtointhe text:A–Antananarivo,CM–CapMasoala,Mh–Mahanoro,Mn–Mananjary,Ta–Tamatave,To–Toliara.StationlocationsareshownfortheMACOMO,RHUM-RUM,and SELASOMAseismicprojectsusedinthisstudy.KnownactivehotspotscurrentlyliebeneathGrandeComoreandRéunion.TheDavieridgeisaninferredtransformfault con-trollingtherelativemovementofMadagascarwithrespecttoAfricaduringtheMesozoic.PlateboundariesareafterStampsetal. (2015).Elevationandbathymetryarefrom ETOPO1(AmanteandEakins,2009).(Forinterpretationofthecolorsinthisfigure,thereaderisreferredtothewebversionofthisarticle.)
referred to inthe literature astheNorthernMadagascar Alkaline Province (NMAP) and the Central Madagascar Alkaline Province (CMAP).AthirdoutcropoflateCenozoicvolcanismwasalso iden-tifiedin thesouthwestern part ofthe islandby Bardintzeffet al. (2010), which we will refer to as the SMAP. Several ideas have previouslybeenputforwardtoexplainthisanomalousvolcanic ac-tivity(EmerickandDuncan,1982; Nougieretal.,1986).However, withouttheimagingprovidedbybroadbandseismological investi-gations,hypothesesconcerningtheoriginofthismagmaticactivity couldnotbetested.Itwasinthecontextofthischallengethatthe seismicimagingpresentedherewascarriedoutthroughthe2-year deployment of an island-wide network of 26 broadband seis-mometerlocations, complemented by six seismometers deployed inneighboringMozambiqueaspartoftheMACOMO(MAdagascar COmoresMOzambique) experiment (Wysession etal., 2011). The experimentwas simultaneously accompaniedby theGerman SE-LASOMAseismic deploymentof twenty-sevenbroadband stations alongaSW–NEprofileinthesouthofMadagascar(Tilmannetal., 2012) andbyterrestrial deploymentsoftenbroadbandstationsin theframe oftheRHUM-RUMexperiment;fivealongthe SEcoast ofMadagascarandfiveinthesurroundingEparsesIslands(Barruol andSigloch,2012).
PreviousbroadbandseismologicalworkwithinMadagascarwas carried out using four permanent broadband seismometer sta-tions atABPO (GSN), FOMA(GEOSCOPE), SBVand VOI(GEOFON) (Rindraharisaona etal., 2013). Smalldeploymentsof short-period
seismometers were alsocarriedout by researchersfromthe Uni-versity of Antananarivo,through theseshort-period sensorswere onlysensitivetolocalseismicityintheItasyandAnkaratraregion (e.g. Rindraharisaona et al., 2013), and were not able to resolve deep andlarge-scalestructures. The globalmodelCrust1.0(Laske etal.,2013) includesarepresentationofMadagascarwitha1◦
pa-rameterization that variesbetweena maximumcrustal thickness of
∼
42 kmalongthebackboneoftheisland,wherethetopography is highest, to aminimum crustal thicknessof∼
30 km along the western coast. Thismodelimproved upon crustal-thickness mod-els that were based on gravity studies, which suggested crustal-thicknessvariationsof25–35 km(Rakotondraompianaetal.,1999). Upper mantle observations beneath Madagascar had previously onlybeenconstrainedbyreceiver-functionandteleseismic surface-wave shear-velocity inversions for each of the four permanent stations (Rindraharisaona etal.,2013), whichalsoconcludedthat the MadagascanlithosphereisrelativelythincomparedwithEast Africa, andthat thelowest asthenosphericshear velocitieslie be-neath some of the highest topography around the central Itasy region.In this study, we utilize an island-wide deployment of seis-mometers that is able to explore the crust and upper mantle seismic velocities of Madagascar using phase velocity measure-ments derived from both ambient noise and teleseismic surface wave analyses, providing good structural resolution to depths of up to 200 km. Resolving below thisdepth will requirea
subse-quentanalysisofteleseismic body wave tomography.We apply a linearizedshear-velocity inversion to the measured phase veloci-tiestoproducethefirstcompleteregionalshear-velocitymodelof Madagascar.
2. Geologicsetting
Madagascar has an unusual geologic historythat has primar-ilyshaped its crustal and lithospheric structuresthrough a Pan-African amalgamation of Precambrian terranes that were posi-tionedat the suture of Eastern and Western Gondwana (Collins, 2006,andthereferences therein). Thesetectonicterranesinclude a fragment of the Archean Western Dharwar craton (Antongil– MasaoraTerranealong theeastern coast)(Pacquetteetal., 2003), whichisaseriesofProterozoicterranescontainingremnantshear zones(Antananarivoterrane,throughouttheMadagascanhighland plateaus)(Fig. 1)(Tuckeretal.,2007,andthereferences therein).
Madagascar rifted away from Africa along with India
∼
165– 130 Ma, during the break-up of Gondwana (Rabinowitz et al., 1983; CoffinandRabinowitz,1987).Throughoutthistime,volcanic rockswere emplaced acrossmanyregions ofMadagascar(Fig. 1). This rifting thinned the crust along the west coast of Madagas-car, allowing syntectonic sedimentary basins to form there. The eastcoastofMadagascarwasshaped bythesubsequentriftingof theIndiansubcontinentthatmovednorthwardsalongatransform fault from 95 Ma to 84 Ma (e.g., Gibbons et al., 2013), and the wholeislandhasremainedtectonicallystablesincethen.Madagascarwassubjecttowidespreadfloodbasalts(nowfound atthe surface primarily around the periphery ofthe island) that eruptedvoluminouslybutbrieflyduringthistime,
∼
95–85 Ma ago, andmayhaveoncecoveredtheisland(Storeyetal.,1995).Thisis commonlylinked to the migration of Madagascar/India over the Marionhotspot(Storeyetal.,1995; Torsviketal., 1998), leading tofracturingoftheoverridingplate,rapidemplacementof mantle-derived tholeiitic basalt and crustal-derived dacite/alkali rhyolite magmas,andeventualfragmentationofIndiafromMadagascar.The enigmatic igneous provinces of much more recent alka-line intraplate volcanism, including the large NMAP (3800 km2)
and CMAP (6000 km2) areas, are shown in Fig. 1.
Radiomet-ric 40Ar/39Ar ages show that the igneous rocks are principally
25–1 Ma old (Emerick and Duncan, 1982; Nougier et al., 1986; Tucker andConrad, 2008), butbegan asearly as50 Ma. In cer-tainregionsofthenorth(aroundNosyBeandtheMassifd’Ambre) andinthecenteroftheisland(intheItasyandAnkaratraregions westofthecapital,Antananarivo)volcanismhasextendedintothe Holocene(Collins, 2006). The SMAP volcanic activity, found in a comparativelysmallregion ofsouthwestern Madagascar,near To-liara, has isotopic ages of
∼
9 Ma, similar to some of the CMAP volcanics(Bardintzeffetal.,2010).AfirsthypothesistoexplaintheMadagascanintraplate volcan-ism connects it to the more active Comoros volcanic alignment tothenorthwest(EmerickandDuncan,1982),whichextends SE-to-NWfromMayotteIslandtotheGrandeComoreIslandandthe activeKarthalavolcano. Asecond hypothesisrelatesboth the Co-morosandMadagascar volcanismto the southern terminationof theEastAfricanRiftandtotheeastward motionoftheSomalian platerelativetoNubia.Althoughthegeometryofthesouthern ter-minationoftheSomalianplateisstill debated(Sariaetal.,2014; Stamps et al., 2015), the diffuse termination of the East African RiftmayextendthroughtheComorosvolcanicalignmentandinto theintraplate Madagascar volcanism (Michon, 2016). A third hy-pothesiscouldinvolvedeepconnectionstoalowermantleAfrican superplume (Ebinger and Sleep, 1998), which would generate a large-scale mantleupwelling (Forte etal., 2010) thatspreads ra-diallyintheuppermantlebeneathSouthernAfrica.Thisupwelling couldbring hotasthenosphericmantleto theMozambique
Chan-nelregion, generatingvolcanismwithin Madagascar.A fourth hy-pothesis involves fracture zones created during continental sep-aration (Nougier et al., 1986). These bands of weakness may be reactivatedthrough periods ofregionallithosphericextension, al-lowing local asthenospheric upwelling and volcanic activity. The regionalfracturezoneshaveasimilarorientationtotheN–S trend-ingDavieRidge,believedtobethetransformfaultguiding Mada-gascar southwards during the Cretaceous(Coffin andRabinowitz, 1987) and whichhasbeen thesiteof recentseismicreactivation (Grimison and Chen, 1988). Similarly orientated remnant struc-tures from the amalgamationof Madagascar in the Precambrian, suchastheRanotsarashearzone,mayalsoprovideareasofcrustal and/or lithospheric weakness for tectonic extension to exploit. These four hypotheses are not completely independent and may interactconcurrentlytoproduceintraplatevolcanism.
Atregionalscales,seismicity isclearly alignedalong theDavie Ridge, along theComoros volcanicalignment andbeneath Mada-gascar.SeismicitywithinMadagascarshowshighestconcentrations in thecenter oftheisland (Rindraharisaonaetal., 2013,andthe references therein).Themajorityofthesesmall(
<
M4)eventshaveextensional focal mechanisms, reflecting a regional E–W exten-sionalstressregime(GrimisonandChen,1988; Rindraharisaonaet al., 2013), whichsuggeststhat the wholeregion maycorrespond to a diffuse, extensional plate boundary. The seismicity appears to align in bands approximately N140E that align with mapped normal fault structures andare oftenassociated with the occur-rence of hot springs, suggesting high regional heat-flow rates.
Rindraharisaonaetal. (2013)alsousedajointinversionofreceiver functionsandsurfacewavestostudytheuppermantleatthesites ofthefourpermanentstations.Theyfound thatthecenterofthe island, beneath the Global Seismic Network (GSN) station ABPO, isunderlain by relativelyseismicallyslowuppermantle material, whichmaysuggestanasthenosphericupwellinginthisregion, al-though both the spatial anddepth extentof thefeature was not wellresolved.
Tectonicstudies of the CMAPand Alaotra–Ankara graben sys-temhaveshownthat theseareasareactively extending,resulting inhigherosionalgulliesknownlocallyaslavakas.Inplaces,these features cut into Neogene rocks suggestingthat uplift may have beenoccurring forthepast 10–15 Ma(Cox et al.,2010). The to-pographyofMadagascarisunusuallyelevated forold, continental crust, with large areas of the central and northern parts of the island generally elevated
∼
1 kmabove sea level, but morethan 2 kminplaces.Thisis especiallyunusualconsideringthat Mada-gascarisunlikelytohaveexperiencedextensivecompressional tec-tonics since atleast∼
140 Maago, following its separation from Africa (e.g., Rabinowitz et al., 1983). Examinations of river pro-fileshavesuggestedthatMadagascarhasexperienced activeuplift sincetheearlyMiocene(Robertsetal.,2012).Comparisonscanbe madeto otheruplifted broadplateaus such astheMassifCentral inFrance(Chevrotetal., 2014), whichhasalsoundergone recent intraplatevolcanism,andtheHangayDomeofMongolia(e.g.,Petit etal., 2008), wherecrustal thicknessis40–50 kmandthe eleva-tionmaybeaccommodatedbyathinnerlithosphere.3. Dataandmethods
The MACOMO project deployed 36 broadband instruments (9 Guralp CMG-3Ts, 10 Trillium 120PAs, 17 Streckeisen STS-2s, each with a Quanterra Q330 datalogger) at 26 locations within Madagascar (including some repeat locations due to instrument failures) and at6 locations within Mozambique. Broadband seis-mometerswereoperatedfortwoyearsat10Madagascarlocations, startinginOctober2011,supplementedbyanadditional16 broad-band stationsthatoperatedforoneyear,starting inAugust2012. All stationswere removedin August 2013 anddataare available
attheIRISdatamanagement centerundercodeXV(Wysessionet al.,2011).ContemporaneouswiththeMACOMOdeploymentwere twootherregionalbroadbanddeployments.TheRHUM-RUM (Réu-nionHotspot andUpperMantle–RéunionsUntererMantel)project mainlydeployedoceanbottomseismographstotheeastandsouth of Madagascar, but also installed five land stations in southeast-ernMadagascarandfiveislandstationsontheIlesEparsesaround Madagascar. RHUM-RUM datais under theFDSN code YV atthe FrenchRESIFdataportalandwillbepublicallyavailableattheend of2017 (http://seismology.resif.fr) (Barruol andSigloch, 2012). In addition,theSeismologicalSignaturesinthe Lithosphere/Astheno-sphere system of Southern Madagascar (SELASOMA) experiment installed 25 broadband stations in a linear deployment across southern Madagascar to examine the crustal structure of Mada-gascar asit crosses the Ranotsara shear zone and other tectonic features(FDSNnetworkcodeZE2012–2014;Tilmannetal.,2012). Thesestationsfillthegapsinthe MACOMOstationcoverage.The present study uses the 10 RHUM-RUM land and island stations, 7 of the SELASOMA broadband stations and the 4 permanent broadbandstationsdeployedonMadagascar:ABPO(IUGSN,2007– present);VOI andSBV(GEGEOFON,2009–present; GEOFONData Center(1993));andFOMA(GGEOSCOPE,2008–present)(seeFig. 1
andSupplementaryTableS1).
Three complementary methods are used to analyze surface wavephasevelocities:
1) Ambient noisetomography, followingBensenet al. (2007),is used over relatively short periods (0–40 s) and is therefore bestforshallow(upper30 km)investigations.
2) A station-to-stationcross-correlationapproachrecently devel-oped by JinandGaherty (2015) is usedforthe intermediate periodrangeof20–100 s.
3) The two-plane-wave analysis of Yang and Forsyth (2006) is used over a period range of 18–182 s, which provides good resolutiontodepthsof150–200 km.
The phase-velocity dispersion observations from these three methods are combined at each nodal point of the model and inverted for a three-dimensional shear-velocity model using the methodologyofHerrmannandAmmon (2002).
3.1. Ambientnoisetomography
Nowastandardseismologicaltechnique,ambientnoise tomog-raphy (ANT)relies uponthe observationthat theaverageseismic noise field reveals surface-wave particle motions with propaga-tion velocities that are frequency-dependent (e.g., Larose et al., 2005). Seismic ground noise records from a station pair can be cross-correlated to furnish an approximation of the elastic im-pulse response (Green’s function) as if one of the stations is a virtualsource.Rayleighwavedispersivepropertiesoftheextracted Green’sfunctionsfromcross-correlationsofambient-noiserecords attwostations ormoreareused toproducetomographicimages (e.g.,ShapiroandCampillo,2004).
The method of Bensen et al. (2007) is followed here, using vertical-componenttimeseriesfrom1July2011to1August2013. Theinstrumentresponsesareremovedfromthetimeseries,which are then cut into 12-hr windows with an overlap of 8 hr. The timeserieswindowsarecross-correlatedamongallstationsusing a frequency-domain normalization, and then stacked to produce station-to-stationGreen’sfunctionsfromwhichRayleighwavesare extracted. The FTAN software package of Levshin etal. (1992) is used toanalyze the dispersion ofeach interstation Green’s func-tion.These functionsare then mapped overa 0.5◦ gridof nodes
usingthe tomographic inversionmethod ofBarmin et al. (2001),
producing1-Ddispersion curvesforphaseandgroupvelocitiesat periods8–40 s.
3.2. Cross-correlationofteleseismicsurfacewaves
Forteleseismicsurfacewavesfromearthquakesources,the Au-tomatedSurfaceWavePhaseVelocityMeasuringSystem(ASWMS) ofJinandGaherty (2015)usesacross-correlationof fundamental-modesurfacewavestocalculatestation-to-stationphasevelocities as
C
(
t)
=
S1⋆
WsS2 (1)where S1 istheseismogramataparticularstation, WS isa
win-dow function isolating the surface wave energy ata neighboring station S2, and C
(
t)
contains the lag information for allcoher-ent signals. C
(
t)
iswindowed andnarrow-band filtered;low andhigh cut-off frequencies are
±
10% of the center frequencies. The raw phase velocity is found by minimizing the misfitbetween a predictedwaveletandthenarrow-band-filteredcross-correlogram. For the detailed methodology see Jin and Gaherty (2015). This technique has hadlimitedapplicationsto temporaryregional de-ployments suchasthecombinedMadagascardeployment usedin this study, and is applied here to provide a test to its potential acrosssuchanetwork.ThedatainvolveRayleigh-waveobservationsfrom182 teleseis-mic eventsof Mw
>
6 (7 October 2011 to 30August 2013) thatare morethan 30◦ away fromMadagascar so that a plane wave
assumption isvalid (SupplementaryFig.S1). Station pairschosen forthecorrelationwerelimitedto50–500 kmindistanceto min-imize cycle skipping. We produce 2D phase-velocity maps using Eikonaltomography(followingreferencesinJinandGahery,2015) at 15 periodsbetween20 sand100 sfor aseries of0.5◦ nodes
acrossMadagascar.
3.3. Thetwo-plane-wavemethod
To extend the phase velocity range to longer periods (out to 182 s),andtherefore increasethe depthof themodelresolution, we applythetwo-plane-wave(TPW)methodofYangandForsyth (2006) to Rayleigh waves from 183 teleseismic events. For a re-gional surface-wave inversion, the incoming displacement (U ) of the Rayleighwavefieldatfrequency
ω
,recordedata seismic sta-tion,can berepresentedby thesumoftwo planewaves(Forsyth andLi,2005):Uz
(
ω
)
=
A1(
ω
)
e−i(k1·x−ωt)+
A2
(
ω
)
e−i(k2·x−ωt) (2)where Aandk aretheamplitudeandhorizontalwavenumber vec-torofeachoftheplanewavesandx isapositionvectorforeach stationrelativetothereferencestation.
Vertical components of Rayleigh waveforms are narrow-band Butterworth-filtered at twenty-five periods between 18 s and 182 s, in frequency bands of
±
10% of the center frequency. The observed fundamental-mode Rayleigh waves are identified and windowed usingthe3-DCUB2velocity modelofRitzwolleretal. (2003). The windows are tapered to minimize edge effects and we apply a quality-control signal-to-noise ratiocut-offof 5.Each window isconvertedinto thefrequencydomainto obtain ampli-tudeandphaseinformation.Themodelgridisparameterizedwith 437 grid nodeswitha node spacing of0.8◦ atthe centerof thegrid and1.2◦ atthe edgesin orderto allowthe estimatedphase
velocities to absorb effectsthat are not explained by the sumof twoplanewaves.
The parameters oftheincomingtwo plane wavesare first es-timated using a simulated annealing method based on the ini-tialphase-velocitymodel.Second,theplane-waveparametersand
phase-velocityparametersateachnode aresolvedsimultaneously withageneralizedlinearinversion.Themodelparametersare up-datedateachiterationandtheinversionstopswhenthemaximum number of iterations is reached or the convergence condition is achieved.FollowingasimilarproceduretoLiandBurke (2006),we iteratethemodelvaluesamaximumof10times,setthe charac-teristicwavelengthforaveragingandcalculatingspatialsensitivity tobe100 km,andassigntheapriorierrorforeach nodevelocity tobe 0.15 km/s. Thisallows the modelto minimize edge affects causedbyaheterogeneitythatcannotberepresentedbytwoplane waves.
3.4.Combinedshear-velocityinversion
The 1-D dispersion curves at each of the model nodes from each of the three differentmethods of analysis are combined to form a single model. For frequency bands that overlap between thedifferentmethods,theresultingmapsshowgeneralsimilarities intheoverallpatternsofphasevelocityvariations(Supplementary Fig. S2).Differencesinphasevelocitymapsbetweeneachmethod are likely due to ray coverage andinterpolation methods imple-mentedby eachapproach.ThemethodofHerrmannandAmmon (2002) is used to fit the combined dispersion with 1-D vertical velocity models by allowing thin (2–5 km) layers to change in velocity value but not thickness. For overlapping periods of the ASWMSandTPWmethodswe weighttheinversionbasedonthe standarddeviationoftheobservations.
The initial model is loosely based on AK135 (Kennett et al., 1995), with a constant shear velocity throughout the crust and upper mantle of 4.48 km/s and a set of twenty-five 2-km-thick layers.Aslittleknowledge ofcrustalstructureiscurrentlyknown inMadagascar,we smoothoverall layers.Thephase-velocity dis-persioncurvesthatarecalculatedforeach1-Dmodelarefoundto provideanexcellentfitafter50iterations.
A shear-velocity discontinuity is inserted in order to more realistically mimic a Moho velocity increase. We make the as-sumptionthattheMohoisconsistentthroughoutMadagascarand equal to 4.125 km/s. This value is based on the only previous studyofreceiverfunctionanalysisinMadagascarusingthe4 per-manent seismic stations in Madagascar (ABPO, SBV, VOI, FOMA) (Rindraharisaonaetal.,2013).We applya0.14 km/s jumpatthis assumeddepthoftheMoho,accommodatingthisoffsetby reduc-ingtheshearvelocityinthelowercrustby0.042 km/sandraising theuppermantlelayervelocitiesby0.098 km/s.
Theiterativeinversion processisrunagainusingthenew1-D modelswith a Moho velocity stepas a starting model.To retain theMoho in the final model, the inversion is run witha higher dampingparameterinthelayerjustbelowtheMoho.
4. Results
4.1.Ambientnoisetomography
The ANT spatial resolution tests are determined by forward-modeling a delta function using the process discussed in Sec-tion 3.1 (Barmin etal., 2001), and are influenced by the station spacing,withshorterperiodsrequiringacloserstationspacing. Re-sultsof the resolution testsare shown in Supplementary Fig. S3 andshow good spatial resolution of seismicfeatures of
<
50 kmwidthacrossMadagascaratallperiods.
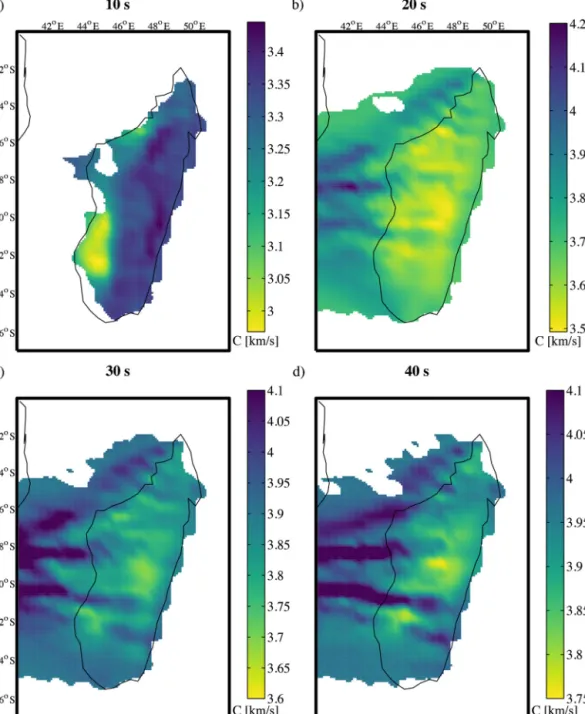
The resulting ANT Rayleigh wave velocities are a product of Earthstructureatrelativelyshallowdepths(
∼
10–50 km),and cor-relate well with the knownsurface geology. Fig. 2shows a sub-setof phase-velocity slices fromthe ANT results. At 10 s,which largelysamplesstructuresatdepthsof2–20 km,therearetwo no-tablelow-phase-velocityregions(<
3.15 km/s)onthewestcoastofMadagascar. Athird,smalllow-velocityregion canbeseen atthe very northend ofthe island.These threeseismic features corre-latewellwiththelocationsofthreesedimentarybasinsalongthe westcoast.Atperiods
>
30 s,lowphasevelocitiesbecomeconcen-tratedinthreeregions:thecentral(CMAP),northern(NMAP),and southwestern (SMAP) provinces.At 20–40 speriod,the 2D maps showsmearingofthephasevelocitiesovertheMozambique Chan-nel. Thisis dueto limited crossing rays inthe channel from the lackofavailablestations.Attheseperiods,relativelyfastvelocities are generally observedin the Mozambique Channel comparedto Madagascar, aswouldbe expectedfromthe differencesincrustal thicknessandcomposition.
4.2. Automatedsurfacewavephasevelocitymeasuringsystem
For each period band, the consistency of the phase-velocity measurement at each node can be characterized by a standard deviationandisshowninSupplementaryFig.S4.Thehighest vari-ationsin phase velocity occur atshorterperiods, suggestingthat thelimitofresolutionhasbeenreached,giventhestationspacing. Standarddeviationsof
<
0.1arefoundovermostofMadagascarforthemajorityofperiodbandswithin25–100 s.
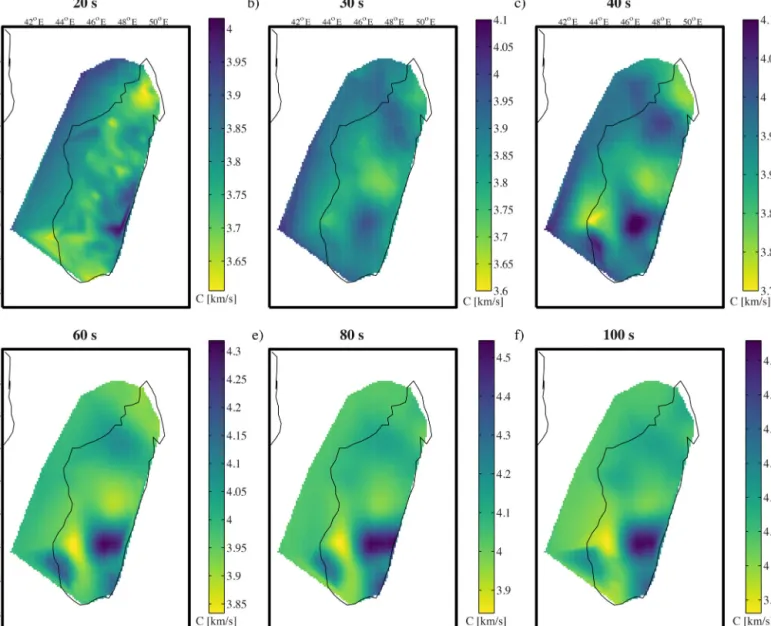
Asubset oftheASWMS phase velocitymapsatseveral differ-ent periods are shown in Fig. 3. In the 20 s map, the backbone of the island exhibits relatively low phase velocities when com-pared with the rest of Madagascar and the surrounding oceanic crustal regions. At phase-velocity periods of 30–40 s, significant low-velocity regions are observed beneath the CMAP andNMAP. Theselow-velocityregionsareseenthroughouttherestofthe pe-riod bandsup to 100 s. A relatively strong low-velocity band at periods of 40–100 s is also apparent in southwestern Madagas-carbeneaththeSMAPvolcanicregion.Thisanomalyappearstolie betweentwohigh-velocityzonesandhasasimilar orientationto boththeDavieRidgeandtheRanotsarashearzone.
4.3. Two-plane-wavetomography
Toprovideananalysisofthesize offeatures resolvableby the TPWtomographymethod,aresolutionmatrixiscalculatedateach period andconvolved witha checkerboard of positive and nega-tive anomalies (SupplementaryFig. S5).Foreach period,multiple testsallowthedeterminationofthesmallestcheckersizethatcan be recovered by the resolution matrix. The shortest periods can resolve features 177 km in width, increasing to 355 km at the longestperiods.
A subset of the resulting TPW 2D phase velocity maps are shown in Fig. 4. From 30 s to 77 s, two distinct relatively low-velocityzonesunderlietheCMAPandNMAPregions.Athird low-velocity region underlies theSMAP region atperiods of40–77 s. The northernlow-velocity regionappears toremain disconnected from the central andsouthern regions at periods
<
124 s. Theseresults show similar features to those of the ANT and ASWMS results:acentrallow-phase-velocityregioncorrelateswiththe sur-face CMAPvolcanics, a northernlow-phase-velocity region corre-lateswiththeNMAPvolcanics,andasouthernlow-phase-velocity regioncorrelateswiththeSMAPvolcanicregionatperiods
>
40 s.4.4. Shear-velocityinversion
Afteramalgamating all ofthe 1-D model nodes,a 3-D model fortheentireregionwitha0.5◦ nodespacingisobtainedthrough
interpolation(SupplementaryFig.S6).Depthslicesareplotted rel-ativeto the meanofthe slice to highlightthe variations ateach depth. In addition, slices relative to the Preliminary Reference Earthmodel(PREM)(DziewonskiandAnderson,1981) areshown inFig. 6(thereferencemodelisplottedinSupplementary Fig.S7
Fig. 2. Phase-velocitymapsproducedfromtheANTmethod.Valuesareomittedwherespatialresolutionexceeds200 km.Smearingbetweenstationsatlongerperiodsis seenbeneaththewestcoastduetoalackofcrossingpathstoislandstations.Lowphase-velocityregionsat10 scorrelatewithsedimentarybasins.Velocityvariationsat 40 salsomapwellwithrespecttoMadagascarvolcanism.(Forinterpretationofthecolorsinthisfigure,thereaderisreferredtothewebversionofthisarticle.)
andhas beenadapted within thetop 40 km to highlightcrustal variations).
Determiningashear-wavevelocitymodelthrougha1-D inver-sion atmodelnodeshaslimitations.Forexample,thevelocitiesat each node are not directly influenced by the neighboring nodes. However,thesmoothnessofthefinalmodelsuggeststhatthe ve-locityvariations observedarequalitativelyrobust.TheRMSofthe misfit betweenthe inverted model dispersion curvesand the fi-nal observed dispersion curves (Fig. 5) shows values less than 0.3 km/s across the majority of Madagascar rising to 0.6 km/s in the Mozambique Channel, where resolution is lost at shorter periods. The inclusion of an apriori Moho in the final round of inversionprovidesamorerealisticvelocitystepatthebaseofthe crust,andalsoshowsaslightdecreasewhenweincludethisMoho step(Fig. 5).TheinferredMohodepthisrelativelyconsistentwith thesurfacetopography:thickestthroughouttheAntananarivo ter-rane(
∼
40–50 km),andthinningtowardsthewestcoastandtothenorth(
∼
20–25 km)(SupplementaryFig.S8).However, alternative methodsfordeterminingcrustalthicknessotherthansurfacewave phasevelocitiesarebeyondthescopeofthispaper.Sedimentarybasinsareclearlyobservedasregionsofrelatively slowshearvelocitiesalongthewestcoastat10 kmindepth;the southern Morondava basin is the broadest and slowest (Supple-mentary Fig. S9).These shallowseismic structuresare most sen-sitive to the ANT-method results, as both the ASWMS and TPW methods cannot resolve such shortperiods. The surface geologic boundary ofsedimentary coverclearly separates theslow veloci-tiesofthesedimentarybasinsfromtherelativelyfastPrecambrian basementrockstotheeast.Incomparison,inthe30-km-deepmap the colorschemeinverts,showingrelativelyslow shearvelocities along the backbone of the island andfastvelocities to the west. This depth slice crossesan eastward-dipping Moho discontinuity, revealingthe slowcontinentalcrustal rootbeneaththe Madagas-canhighlandsandfastmantlevelocitiesbeneaththeMozambique
Fig. 3. Phase-velocitymapsproducedbytheASWMSmethod.Theseperiodsaremainlysensitivetothelower-crustandmantlevelocitystructureandshowlow-velocity regionsthatcorrelatewellwiththeintraplatevolcanism.At20 sthereisaclearvariationintheMozambiqueChannelvelocitiescomparedtothoseofMadagascardueto thefaster,moreoceanic-typecrust.Athirdlow-velocityregionisobservedinthesouthwestofMadagascaratlongerperiods.(Forinterpretationofthecolorsinthisfigure, thereaderisreferredtothewebversionofthisarticle.)
ChannelandshallowwesternMadagascarcrust.Intheupper man-tle(50–150 kmdepth),threedistinct low-velocityregionsare ob-served beneath the NMAP, CMAP, and SMAP volcanic regions of theisland. Theselow-shear-velocity regions are independentand unconnectedatdepths
<
100 km,althoughboththenorthernandcentralzonesappeartomigratewestandnorthwardswith increas-ingdepth.
5. Discussion
5.1.Thecrust
Shear-velocity variations across Madagascar show a variety of features that can be related to the surface geology. At shallow depths,thefeatures thatmoststandout arethethree west-coast sedimentarybasins.Theseappearasthelow-velocityanomaliesin
Fig. 2 and Fig. 5 at the shortest periods and shallowest depths. TheAntsirinanaBasinistheshallowestandnarrowestofthethree, andtheMahajangaBasinis deeperandbroader,though both are likelytoextendtolessthan5 kmindepth.TheMorondavabasin isby far the deepest andbroadest ofthe three, and maybe up
to
∼
10 km deep (SupplementaryFig. S9). Surface wavesare not the optimalmeans of measuring shallowbasin structures, which are better resolved with receiver functions from P and S body waves, as well as active-source seismic methods. Receiver func-tions have been analyzed from the MACOMO data (Fenitra An-driampenomanana, pers. comm.) andshow that the thickness of sedimentary rocks extends up to 8 km deep along the western edges ofMadagascar,thinning to3–6 kmattheir eastern bound-ary. The receiver functionssuggest that the thickest sedimentary sequencesarewiththeMorondavaandMahajangaBasins,butthat even for the Antsirinana Basin to the norththe sediment layers likelyexceed5 km.Nonetheless,thesurfacewaveinversionsshow thattheMorondavaandMahajangaBasins,andtoalesserdegree theAntsirinanaBasin,aremajor structuralfeaturesthat dominate theseismicstructuresoftheMadagascanwestcoast.Attheshortestperiods,thecentralmountainousspineof Mada-gascarisrelativelyfastincomparisontosurroundingvalleys. This is consistent with the crystalline Archaean rocks exposed there. Thepatternofseismicvelocitiesquicklyreverseswithdepth, how-ever, becauseof the slowerseismic velocities ofthe Madagascan
Fig. 4. Asubsetofphase-velocitymapsproducedbytheTPWmethod. Twolow-velocityzonesagainmap beneathregionsofintraplatevolcanism.A thirdlow-velocity regionisalsoshowninthesouthwestofMadagascarat40–70 s.Itisnotedthatlow-velocityregionsappeartoextendtowardstheComoros,althoughthecoverageinthe MozambiqueChannelislimited.(Forinterpretationofthecolorsinthisfigure,thereaderisreferredtothewebversionofthisarticle.)
Highlandscontinentalrootincomparisontothemantlevelocities beneaththethinned crustofthewest-coastbasins.Thisisclearly observedinthetransitionbetween10and50 km(Fig. 6and Sup-plementaryFig. S6):at10 kmdepth,theMorondavabasinappears asalargelow-velocityfeaturebecauseoftheverythick sedimen-tary basin that formed syntectonically asMadagascar was rifting awayfromAfrica.However,at30-km-depth,theseanomalieshave begun toreverse. TheN–S mountainsare still continentalcrustal material,whereasbeneaththeMorondavabasin,wherethecrustal thicknessislikelyaround23–33 km(FenitraAndriampenomanana, pers.comm.),thethincrustmayhavebeenreplacedbydenserand seismicallyfastermantlerock.
The Moho depths are estimatedby applyinga jump inshear velocity at4.125km/s. Thisapproach workswell inallowing the inversiontogenerateamorereasonablevelocitymodel.However, in the CMAP it is likely that the Moho depth is misplaced, as theinversionattemptstoreducethevelocityjumpappliedtothe smoothed model during the second round of iterations (Supple-mentaryFig.S8b). To thedegree that the1-D models withinthe CMAParea producealow-shear-velocityzone (
<
4.2 km/s)atup-per mantle depths, the depth range that a suitable Moho could existincreases.As such, caution isneededwhen interpretingthe
crustal thicknessmeasurements,particularlywithinthe CMAP re-gion.
5.2. Theuppermantle
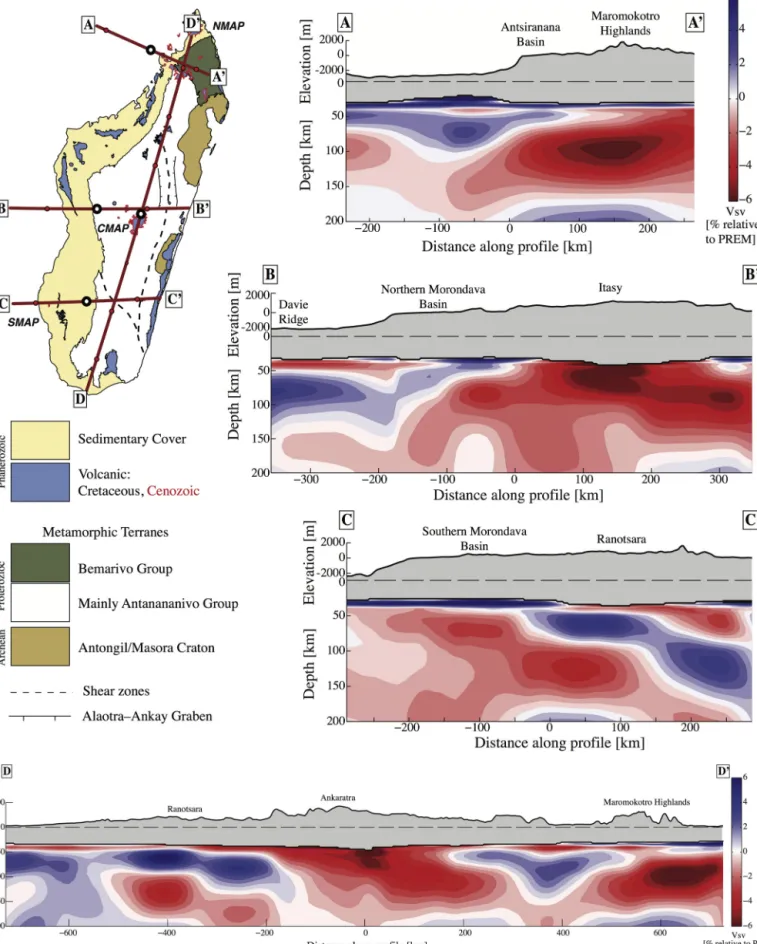
The dominantseismicanomalies justbelowthe crust aretwo regions of very slow seismic velocities at the top of the upper mantle.Theseanomaliesare bestseeninthedeepermapsofthe jointmodel (Fig. 5d and5e) andinthe cross-sectionsofthe rel-ativeshear-velocity model(Fig. 7), whichhasbeensaturatedata minimumof4.1 km/sinordertoobservethemuchsmaller man-tle anomalies.The two uppermantleslow-velocityanomalies are observed beneaththe central andnorthern regions ofthe island. These anomalies directly underlie the locations of known recent volcanic activity of the CMAP and the NMAPregions. At depths of 80–100 km a negative shear-velocity anomaly of around
−
4% isobservedrelativetoPREM(Fig. 6).Thisisconsistentwithother suchanomaliesatthesedepths,wherethereislittleornomantle lithosphere(e.g.,Petitetal.,2008).A thirdnotable low-velocity regionis situatedtothe southof the island at depths of 50–100 km (Fig. 7C–C’). This feature ap-pears separated fromthe CMAP low-velocity region at depths of
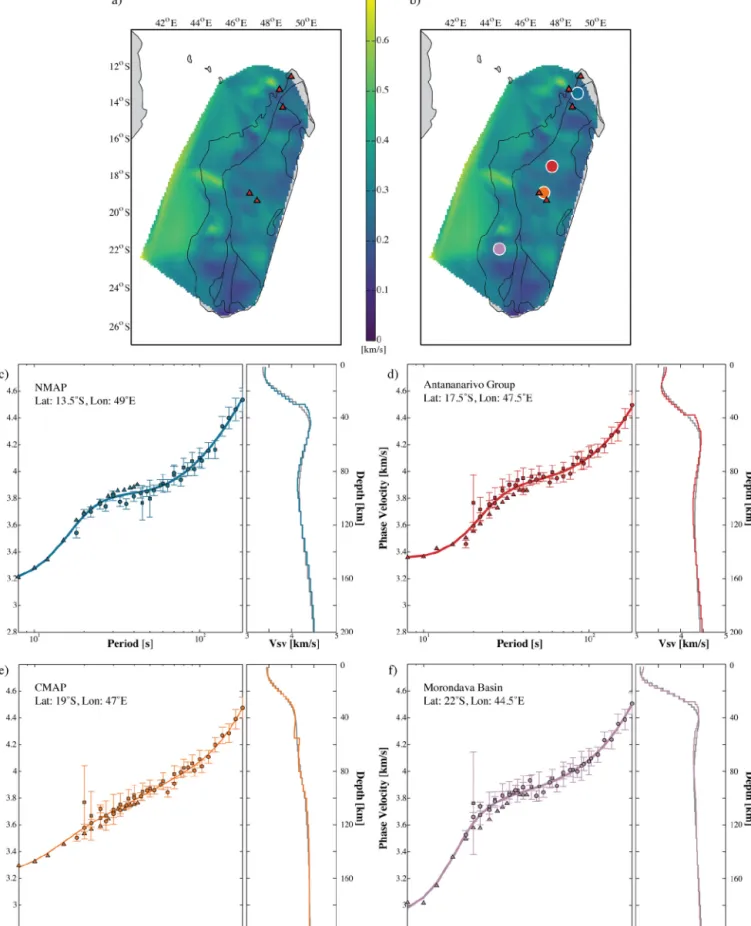
Fig. 5. MapsofRMSshear-velocitybetweenobservedandmodeled dispersionforboththeinitialsmoothinversion(a)andthesecondaryinversionthatincludesaMoho discontinuityat4.125 km/s(b).Selectedphase-velocitydispersionobservationsandmodeleddispersioncurvesandthecorresponding1-Dshear-velocityinversion(c–f)at locationsmarkedon (b).Graylinesdenotethesmoothmodelinversionandthecoloredlinesdisplaythesecondaryinversion.Markersymbolsdenotemethodusedforthe phase-velocitymeasurement:ANT(triangles),ASWMS(squares)andTPW(circles).Tectonicboundariesandrecentvolcanoesaremarkedasprevious.Locationsarechosen basedongeologicdiversity:AntananarivoGroup–Precambrianmetamorphicbasementshowingrelativefastphasevelocitiesatshortperiodsandthick(∼35–40 km)crust; MorondavaBasin–slowphasevelocitiesatshortperiodsduetosedimentarycover;NMAP–northernvolcanicregion;CMAP–centralvolcanicregionshowingsignificantly slowerphase-velocityobservationsatintermediateperiods.(Forinterpretationofthecolorsinthisfigure,thereaderisreferredtothewebversionofthisarticle.)
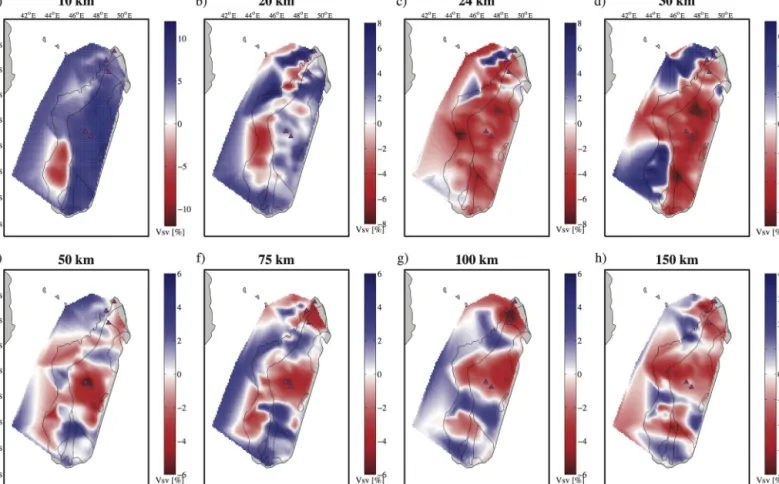
Fig. 6. RelativeshearvelocitieswithrespecttoPREM.Thereferencemodelhasbeenmodifiedinthetop40 km(SupplementaryFig.S7)inordertohighlightvelocity variationssuchassedimentarybasinsandMohotopography.TheabsolutevelocitymodelisshowninSupplementaryFig. S6.(Forinterpretationofthecolorsinthisfigure, thereaderisreferredtothewebversionofthisarticle.)
75–150 kmbyazone offastshearvelocity(
∼
4.5 km/s,Fig. 6f–h,7C–C’ andD–D’), although there maybe some low velocity con-nection to the western edge ofthe CMAP low-velocity region at
∼
50 km (Fig. 6e). It is also noted that this low-velocity region liesbeneaththeoutcropofCenozoicvolcanicrocks atAnkilioaka, whichhavebeendatedat∼
9 Ma(Bardintzeffetal.,2010).5.3. Regionalinterpretationofuppermantlelowvelocityzones
Theextensionoftheselow-velocityanomaliestodepthsgreater than 150 km requires additional techniques such as the inclu-sion of body-wavetomography, andit is thereforeunclear asto whethertheselow-velocityregionsaretheresultofactiveor pas-sive upwelling. Global models in this particular region are too course tosee anyfinedetail that isrequired tohelp resolve this issue.Nonetheless, thestructuresthat areresolvablecanbeginto allowsomeinferencesastothesourceorsourcesofMadagascar’s intraplatevolcanism.Forexample,fastphasevelocitiesatlong pe-riods(40–100 s,Fig. 3) andgreat depths (50–100 km; seeFig. 7
D–D’)beneaththeregionjusttothesouthoftheCMAPmay sug-gestthedelamination andremovalofmantlelithospherethrough negativebuoyancyforces.The removalofsub-CMAPmantle litho-spherewouldallowforthereplacementbyasthenosphericmantle rising beneaththe CMAP. Subsequent isostatic adjustment would resultinelevatedtopographythat isobservedalongthebackbone ofMadagascar. Analternativehypothesistotheexistenceofthese low shear velocities would be the presence of remnants of Cre-taceous hotspot activity from the Marion hotspot (Torsvik et al., 1998).However,currentactiveupliftratesinferredfromriver pro-files(Roberts etal., 2012) suggest that the hightopography is a recent feature, more likely resulting from the thermal uplift of
more recently emplaced sub-lithospheric low-density rocks. The presence of low velocity mantle beneath the SMAP region may provide an explanation to the relatively high topography of the Morondava basin (Fig. 1, Supplementary Fig. S9). Further model-ing of dynamic topography is required, and river profile records appeartoshowthattopographyintheMorondavabasinalsomay havedevelopedsince8 Ma.
Ifthereisaconnectionatdepthtoanactiveplumesource,the most likely direction is fromthe Comorosvolcanic alignment to thenorthwest.RecentanalysishassuggestedthattheComoros vol-canic alignmentis notrelatedtoa deepmantlehotspot(Michon, 2016). The emerging idea is that volcanism and areas of high heat flow in thisregion are strongly related to Africantectonics. The central and northern low-velocity anomalies are clearly dis-tinctfromeachotheratshallowdepths,separatedbyastrongand deep fast-velocity region. There does not appear to be any sub-lithosphericflowconnectingthesetworegions.Thevelocitymodel loses resolutiontothe eastofMadagascar, butatits deepest,the model displays a possible low-velocity region extending north-west from both the north and central regions, possibly connect-ing them withthe Comoros region.This would be in agreement with an African plume-source model (Ebinger and Sleep, 1998; Nyblade et al., 2000; Lin et al., 2005), which involves having a central plumebeneathEast-CentralAfricaspreadout beneaththe African lithosphere, supplying the magma for other shallow, re-gionalhotspotvolcanoes.IntheEbingerandSleep (1998)model, plumematerialflowsshallowlybeneaththelithosphereandcomes from the northwest, suggestingthat volcanism began in the Co-moros and the NMAP before the more southerly CMAP (as the leading edge of the plume material moved southeastward from Kenya/Tanzania). In the Forte et al. (2010) model, plume
mate-Fig. 7. Cross-sectionsthroughtheshear-velocitymodelwithrespecttoPREMshowninFig. 6to200 kmdepth.Sectionsareshownonthegeologicmap,whitecirclesmark the0 kmpositionoftheprofiles,andredcirclesareat200 kmintervals.VerticallyexaggeratedelevationprofilesareshownbasedonETOPO1(AmanteandEakins,2009), andthedashedlinemarksthechangeinscale.Thecolorscaleisconsistentforallcross-sections.Upper-mantlelow-velocityregionsareobservedbeneathhigher-elevated areasandspecificallybeneathregionsofCenozoicvolcanism(A–A’,B–B’).ProfileC–C’traversessouthernMadagascarwhere,atthesouthwesternendbeneaththeSMAP,lies anupper-mantlelow-velocityregionthatisobservableat50 kmindepth,butbecomesmuchstrongerwithgreaterdepth.(Forinterpretationofthecolorsinthisfigure,the readerisreferredtothewebversionofthisarticle.)
rial is proposed to rise frombeneath southAfrica and to spread towards theNEbeneath thewestern Indian Ocean.This suggests thattheMadagascarvolcanismisnotdirectlygeneratedbyan up-wellingsourcebeneaththeComorosentrainedbythemantleflow butinstead,thatbothvolcanismcouldrepresenttheeffectsofthe southernterminationofthe EastAfricanRift, asproposed by Mi-chon(2016).
An active upwelling source is not ruled out with the lim-itedgeochemicalstudiesonthevolcanicregions.Bardintzeffetal. (2010)concludethattheMadagascarvolcanicregionsmayindeed sharea similarsource butwithdifferinglevels ofcrustal mixing. Thenorthern volcanicrocksmayexhibit aslightlymoredepleted signaturethanthecentralvolcanics,butall couldbeattributedto an ocean island basalt source. The enrichment intrace elements fortherecentCMAPandNMAP,aswellasthesmallSMAPregion, isaboutdoublethatoftheolder,93.5 Mavolcanicrocksfromthe Morondavabasin,whicharefromtheMarionhotspot(Wen,2006). Inresponsetoinadequacies intheEmerickandDuncan (1982)
model,Nougieretal. (1986) proposeda fracture-zonemodelthat relied on the reactivation of remnant faults and shear zones formed by tectonic processes as Madagascar rifted away from Africa.Thismodelallowsforthepassageofalkali-enriched mate-rialtobeconcentratedalongzonesparalleltotheDavieRidge. Al-thoughthismodelallowsforaconnectiontotheComoreanplume, itdoesnot discounttheideathat thesourcecouldbe amore lo-calizedupwelling, possiblyin theform ofmetasomatizedmantle enrichedinincompatibleelements(e.g.,Piletetal.,2004).The re-sultsheredonot discountthishypothesis;however,itseemsthat currentextensionrateswithinMadagascarandthedeepnatureof thelow-velocityanomaliesmakesthismodellesslikely.
Fromtheshear-velocitymodelproposed here,weinterpretthe highelevationsoftheMadagascanhighlandsto beduetoa thin, andevenabsent,mantlelithospherebeneathanaverage-thickness (40 km) continental crust. The cause ofthis thinning appears to be muchmorethan thecurrentextensional stressregime allows. Thermo-mechanicalremovalofmantlelithospheremayprovidean alternativehypothesistoexplain ourshearvelocities,butalsothe recent dynamic uplift of topography, and the negative Bouguer gravity anomaly (Bonvalot et al., 2012). The presence of delami-nated,coldlithosphereatdepths below150 kmcould potentially beimagedusingreceiverfunctionsandregionalbodywave tomog-raphy.
6. Conclusions
Surface-wave-derived phase-velocity data have, for the first time, allowed a more detailed interpretation of shear velocities inthe crust and uppermantlebeneath Madagascar. Sedimentary basinsareobservedtoextendtodepths ofaround10 kmbeneath the west coast using these surface-wave methods, in agreement withotherbody-wavebasedstudies.Regionsoflowupper-mantle shear velocities are shown to lie beneath both the CMAP and NMAP, the locations of recent intraplatevolcanism. A third low-velocity regionliesatuppermantle depths beneaththeSMAP in the southwestern region of Madagascar and appears not to ex-tendupintothecrust.Anydeeperconnectionsamongthese low-velocity regions and their extensions into the mantle transition zonecannotbeinterpretedusingsurface-wavemethodsemployed here.TheelevatedtopographyoftheMadagascarhighlandsaround the CMAP may be explained by buoyant, low-velocity astheno-sphere.Thecauseofthisfeaturecanbeexplainedbythelocalized removal of mantle lithosphere beneath the CMAP allowing sub-lithosphericmantletoflowinfromthenorth,however,wedonot ruleout a deeper sourceof mantleheating. Body-wave tomogra-phyandanisotropystudieswilllend evidenceto helpexplainthe
occurrence oftheselow-velocity regions andthepotential foran active,deep-rootedsource.
Acknowledgements
WethankPeter Shearer,NathanSimmonsandoneanonymous reviewer forprovidingproductivecomments thathelpedimprove this manuscript. We would like to acknowledge the IRIS/PASS-CAL instrumentcenterforprovidinginstrumentationfor the MA-COMO project. The Missouri Botanical Gardens provided invalu-able guidance regarding site selection and security. Thanks also go toFrederik TilmannandKarinSiglochforprovidingadditional datasets and comments, and to Franklin Koch for help deploy-ing stations. Funding for the MACOMO project was provided by NSF awardEAR-0838426. RHUM-RUM seismological deployments were supported by the French CNRS-INSU (Institut National des Sciences de l’Univers), program SYSTER,by the CNRS-INEE (Insti-tut National Ecologie et Environnement), the TAAF (Terres Aus-tralesetAntarctiquesFrançaises),by theFrenchANR(Agence Na-tionale de la Recherche, project ANR-11-BS56-0013), and by the DFG (Deutsche Forschungsgemeinschaft)grant SI1538/2-1 RHUM-RUM inGermany. RHUM-RUMequipments were provided by the Alfred Wegener Institut (AWI) inBremerhaven, Germany, and by RESIF-SISMOBinGrenoble,France.
Appendix A. Supplementarymaterial
Supplementarymaterialrelatedtothisarticlecanbefound on-lineathttp://dx.doi.org/10.1016/j.epsl.2016.10.041.
References
Amante,C.,Eakins,B.W.,2009.ETOPO11Arc-MinuteGlobalReliefModel: Proce-dures,DataSourcesandAnalysis.NOAAtechnicalmemorandumNESDIS NGDC-24. NationalGeophysicalDataCenter,NOAA.
Bardintzeff,J-M.,Liegeois,J-P.,Bonin,B.,Bellon,H.,Rasamimanana,G.,2010. Mada-gascarvolcanicprovinceslinkedtotheGondwanabreak-up:geochemicaland isotopicevidencesforcontrastingmantlesources.GondwanaRes. 18,295–314. Barmin,M.P.,Ritzwoller,M.H.,Levshin,A.L.,2001.Afastandreliablemethodfor
surfacewavetomography.PureAppl.Geophys. 158,1351–1375.
Barruol, G., Sigloch, K. RHUM-RUM group 2012. RHUM-RUM experiment, 2011–2015, code YV (Réunion Hotspot and Upper Mantle – Réunion’s Un-terer Mantel) funded by ANR, DFG, CNRS-INSU, IPEV, TAAF, instrumented by DEPAS,INSU-OBS,AWI and the Universitiesof Muenster.Bonn, La Réu-nion; RESIF –RéseauSismologiqueet géodésique Français. http://dx.doi.org/ 10.15778/RESIF.YV2011.
Bensen,G.D.,Ritzwoller,M.H.,Barmin,M.P.,Levshin,A.L.,Lin,F-C.,Moschetti,M.P., Shapiro,N.M.,Yang,Y.,2007.Processingseismicambientnoisedatatoobtain reliablebroad-bandsurfacewavedispersionmeasurements.Geophys.J.Int. 169, 1239–1260.
Bonvalot,S.,Balmino,G.,Briais,A.,Kuhn,M.,Peyrefitte,A.,Vales,N.,Biancale,R., Gabalda,G.,Moreaux,G.,Reinquin,F.,Sarrailh,M., 2012.WorldGravityMap, 1:50000000map,Eds.:BGI-CGMW-CNES-IRD,Paris.©CGMW-BGI-CNES-IRD.
Chevrot,S.,etal.,2014.High-resolutionimagingofthePyreneesandMassif Cen-tralfromthedataofthePYROPEandIBERARRAYportablearraydeployments. J. Geophys.Res.,SolidEarth 119,6399–6420.
Coffin,M.F.,Rabinowitz,P.D.,1987.ReconstructionofMadagascarandAfrica: ev-idence fromthe DavieFractureZoneandWesternSomali Basin.J.Geophys. Res. 92.http://dx.doi.org/10.1029/JB092iB09p09385.
Collins,A.S.,2006.MadagascarandtheamalgamationofCentralGondwana. Gond-wanaRes. 9,3–16.
Cox,R., Zentner,D.B.,Rakotondrazafy,A.M.,Rasoazanamparany, C.F.,2010. Shake-downinMadagascar:occurrenceoflavakas(erosionalgullies)associatedwith seismicactivity.Geology 38(2),179–182.
Dziewonski, A.M.,Anderson, D.L.,1981. Preliminaryreference Earthmodel. Phys. EarthPlanet.Inter. 25,297–356.
Ebinger,C.J.,Sleep,N.H.,1998.CenozoicmagmatismthroughouteastAfricaresulting fromimpactofasingleplume.Nature 395,788–791.
Emerick, C.M., Duncan, R.A., 1982. Age progressive volcanism in the Comores Archipelago,westernIndianOceanandimplicationsforSomaliplatetectonics. EarthPlanet.Sci.Lett. 60,415–428.
Forsyth,D.W.,Li,A.,2005.Arrayanalysisoftwo-dimensionalvariationsinsurface wavephasevelocityandazimuthalanisotropyinthepresenceofmultipathing
interference.In:Levander,A.,Nolet,G.(Eds.),SeismicEarth:ArrayAnalysisof BroadbandSeismograms.AmericanGeophysicalUnion,Washington,D.C. Forte,A.M.,Quéré,S.,Moucha,R.,Simmons,N.A.,Grand,S.P.,Mitrovica,J.X.,
Row-ley,D.B.,2010.Jointseismic–geodynamic–mineralphysicalmodellingofAfrican geodynamics:areconciliationofdeep-mantleconvectionwithsurface geophys-icalconstraints.EarthPlanet.Sci.Lett. 295,329–341.
Fourno,J.-P.,Roussel,J.,1994.ImagingoftheMohodepthinMadagascarthrough theinversionofgravitydata:geodynamicimplications.TerraNova 6,512–519. Gibbons,A.D.,Whittaker,J.M.,Müller,R.D.,2013.ThebreakupofEastGondwana:
assimilatingconstraintsfromCretaceousoceanbasinsaroundIndiaintoa best-fittectonicmodel.J.Geophys.Res.,SolidEarth 118,808–822.
Grimison,N.L.,Chen,W-P.,1988.EarthquakesintheDavieRidge-Madagascarregion andthesouthernNubian–Somalianplateboundary.J.Geophys.Res. 93.http:// dx.doi.org/10.1029/JB093iB09p10439.
Herrmann,R.B.,Ammon,C.J.,2002.ComputerProgramsinSeismologyVersion3.20: SurfaceWaves,ReceiverFunctions,andCrustalStructure.St.LouisUniversity, Missouri.Availableathttp://mnw.eas.slu.edu/People/RBHerrmann.
Jin,G.,Gaherty,J.B.,2015.Surfacewavephase-velocitytomographybasedon multi-channelcross-correlation.Geophys.J.Int. 201,1383–1398.
Kennett,B.L.N.,Engdahl,E.R.,Buland,R.,1995.Constraintsonseismicvelocitiesin theEarthfromtraveltimes.Geophys.J.Int. 122,108–124.
Larose,E.,Derode,A.,Clorennec,D.,Margerin,L., Campillo,M.,2005.Passive re-trievalofRayleighwavesindisorderedelasticmedia.Phys.Rev.E 72,046607. Laske,G.,Masters,G.,Ma,Z.,Pasyanos,M.,2013.UpdateonCRUST1.0–A1-degree
globalmodelofEarth’scrust.In:EGUGeneralAssembly.
Levshin,A.L.,Ratnikova,L.,Berger,J.,1992.Peculiaritiesofsurfacewavepropagation acrossCentralEurasia.Bull.Seismol.Soc.Am. 82,2464–2493.
Li,A.,Burke,K.,2006.Uppermantle structureofsouthernAfricafrom Rayleigh wave tomography. J. Geophys. Res. 111, B10303. http://dx.doi.org/10.1029/ 2006JB004321.
Lin,S-C.,Kuo,B-Y.,Chiao,L-Y.,vanKeken,P.E.,2005.Thermalplumemodelsand meltgenerationinEastAfrica:adynamicmodelingapproach.EarthPlanet.Sci. Lett. 237,175–192.
Michon,L.,2016.ThevolcanismoftheComoresarchipelagointegratedataregional scale.In:Bachèlery,P.,Lénat,J.-F.,DiMuro,A.,Michon,L.(Eds.),Active Volca-noesoftheSouthwestIndianOcean:PitondelaFournaiseandKarthala.Active VolcanoesoftheWorld.Springer-Verlag,Berlin,Heidelberg,pp. 333–344. Nougier,J.,Cantagrel,J.M.,Karche,J.P.,1986.TheComoresarchipelagointhe
west-ernIndianOcean:volcanology, geochronologyandgeodynamic setting.J.Afr. EarthSci. 5,135–144.
Nyblade, A.A.,Owens, T.J., Gurrola,H.,Ritsema,J., Langston,C.A., 2000. Seismic evidencefor adeepuppermantlethermalanomalybeneathEastAfrica. Ge-ology 28,599–602.
Pacquette,J-L.,Moine,B., Rakotondrazafy,M.,2003. ID-TIMSusingthe step-wise dissolutiontechniqueversusionmicroprobeU–PbdatingofmetamictArchean zirconsfromNEMadagascar.PrecambrianRes. 121,523–538.
Petit,C.,Tiberi,C.,Deschamps,A.,Déverchère,J.,2008.Teleseismictraveltimes, to-pographyandthelithosphericstructureacrosscentralMongolia.Geophys.Res. Lett. 35,L11301.http://dx.doi.org/10.1029/2008GL033993.
Pilet,S.,Hernandez,J.,Bussy,F.,Sylvester,P.J.,2004.Short-termmetasomatic con-trolofNb/Thratiosinthemantlesourcesofintra-platebasalts.Geology 32, 113–116.
Rabinowitz,P.D.,Coffin, M.F.,Falvey,D., 1983.TheseparationofMadagascarand Africa.Science 220(4592),67–69.
Rakotondraompiana,S.A.,Albouy,Y.,Piqué,A.,1999.Modèledelithosphèrepour l’îledeMadagascar(océanIndienoccidental):nouvelleinterprétationdes don-néesgravimétriques.J.Afr.EarthSci. 28,961–973.
Rindraharisaona, E.J.,Guidarelli,M., Aoudia, A.,Rambolamanana, G.,2013. Earth structure and instrumental seismicity of Madagascar: implications on the seismotectonics.Tectonophysics 594,165–181.http://dx.doi.org/10.1016/j.tecto. 2013.03.033.
Ritzwoller,M.H.,Shapiro,N.M.,Levshin,A.L.,Bergman,E.A.,Engdahl,E.R.,2003. Abil-ityofaglobalthree-dimensionalmodeltolocateregionalevents.J.Geophys. Res. 108(B7),2353.http://dx.doi.org/10.1029/2002JB002167.
Roberts, G.G., Paul, J.D., White, N., Winterbourne, J., 2012. Temporal and spa-tialevolutionofdynamicsupportfromriverprofiles:a frameworkfor Mada-gascar. Geochem. Geophys. Geosyst. 13, Q04004. http://dx.doi.org/10.1029/ 2012GC004040.
Roig,J.Y.,Tucker,R.D.,Delor,C.,Peters,S.G.,Théveniaut,H.,2012.Cartegéologique delaRépuliquedeMadagascarà1/1000000.MinistèredesMines,PGRM, An-tananarivo,RépubliqueMadagascar,1Colorsheet.
Saria,E.,Calais,E.,Stamps,D.S.,Delvaux,D.,Hartnady,C.,2014.Present-day kine-maticsoftheEastAfricanRift.J.Geophys.Res. 119,3584–3600.
Shapiro,N.M.,Campillo, M.,2004.Emergence ofbroadbandRayleighwavesfrom correlationsoftheambientseismicnoise.Geophys.Res.Lett. 31.http://dx.doi. org/10.1029/2004GL019491.
Stamps,D.S.,Iaffaldano,G.,Calais,E.,2015.RoleofmantleflowinNubia–Somalia divergence.Geophys.Res.Lett. 42,290–296.
Storey,M.,Mahoney,J.J.,Saunders,A.D.,Duncan,R.A.,Kelley,S.P.,Coffin,M.F.,1995. TimingofhotspotrelatedvolcanismandbreakupofMadagascarandIndia. Sci-ence 267,852–855.
Tilmann,F.,Yuan,X.,Rümpker,G.,Rindraharisaona, E.,2012.SELASOMAproject, Madagascar 2012–2014.DeutschesGeoForschungsZentrum GFZ.Seismic Net-work.http://dx.doi.org/10.14470/MR7567431421.
Torsvik,T.H.,Tucker,R.D.,Ashwal,L.D.,Eide,E.A.,Rakotosolofo,N.A.,deWit,M.J., 1998.LateCretaceousmagmatisminMadagascar:paleomagneticevidencefora stationaryMarionhotspot.EarthPlanet.Sci.Lett. 64,221–232.
Tucker,R.D.,Conrad,J.,2008.40Ar/39ArgeochronologyofMesozoicandyounger ig-neousrocksofcentralandnorthernMadagascar.FinalreportoftheBGS-USGS ConsortiumtotheGovernmentofMadagascar,WorldBankProjectUK-04-0100, Chapter 7.
Tucker,R.D.,Kusky,T.M.,Buchwaldt,R.,Handke,M.J.,2007.Neoproterozoicnappes and superimposed folding of the Itremo Group, west-central Madagascar. J. GondwanaRes. 12,32–56.
Tucker,R.D., Roig, J-Y.,Macey,P.Y., Delor,C.,Amelin,Y.,Armstrong, R.A., Rabari-manana,M.H.,Ralison,A.V.,2011.Anewgeologicalframeworkforsouth-central Madagascar,and itsrelevancetothe “out-of-Africa”hypothesis.Precambrian Res. 185,109–130.
Wen,L.,2006.AcompositionalanomalyattheEarth’score–mantleboundaryasan anchortotherelativelyslowlymovingsurfacehotspotsand assourcetothe DUPALanomaly.EarthPlanet.Sci.Lett. 246,138–148.
Wysession,M.E.,Wiens,D.A.,Nyblade, A.A.,2011.Investigationofsourcesof in-traplatevolcanism usingPASSCALbroadbandinstrumentsinMadagascar,The Comores,andMozambique.InternationalFederationofDigitalSeismograph Net-works.Other/SeismicNetwork.http://dx.doi.org/10.7914/SN/XV_2011.
Yang, Y., Forsyth, D.W., 2006. Regional tomographicinversion ofthe amplitude andphaseofRayleighwaveswith2-Dsensitivitykernels.Geophys.J.Int. 166, 1148–1160.