CRUST AND UPPER MANTLE STRUCTURE OF
THE NORTHEASTERN UNITED STATES
by
Steven R. Taylor
B.S., Ohio University, Athens, Ohio
(1975)
SUBMITTED IN PARTIAL FULFILLMENT OF THE REQUIREMENTS FOR THE DEGREE
OF-DOCTOR OF PHILOSOPHY at the
MASSACHUSETTS INSTITUTE OF TECHNOLOGY May, 1980
Signature of Author...
Department of Earth nd-Planetary Sciences
7 IMay 1980
Certified by. .. . .. . .. -... *0
--hesi Supervisor
Accepted by... .... .. q - - - ---. ---..
Chairman, Departmental CoAi 200T duate Students
Lf ~
CRUST AND UPPER MANTLE STRUCTURE OF
THE NORTHEASTERN UNITED STATES
by
Steven R. Taylor
Submitted to the Department of Earth and Planetary Sciences
on May 9, 1980, in partial fulfillment of the requirements
for the degree of Doctor of Philosophy
ABSTRACT
Recognition that mountain belts are places where oceans
have closed implies that continental structure differs
across them. Using the northeastern United States (NEUS)
seismic network, it is shown that this applies to the
northern Appalachians by investigating the crustal structure
of the Precambrian Grenville Province in New York state and
the New England Paleozoic Appalachian Province. The crust
and upper mantle structure of the NEUS is studied by
combining teleseismic and regional body wave observations
with surface wave dispersion measurements.
The velocity models suggest that structures down to
possibly 200 km and greater can be correlated with surficial
geologic and tectonic features and that the two orogenic
belts show marked differences in crustal structure. This
has the important implication that major orogenic belts have
effects that reach well into the lithosphere which are
stable for extended periods of time, perhaps as long as 1
b.y.
Regional travel times recorded across the NEUS seismic
network indicate that the northern Appalachians are
characterized by a well-defined two layer crust, with a
relatively high velocity lower layer. The upper crustal
layer, approximately 15 km thick with P and S velocities of
6.1 and 3.6 km/s, respectively, overlies a high velocity
lower crust with P and S velocities of 7.0 and 4.1 km/s.
The average crustal thickness is approximately 40 km. The
crust of the Grenville Province is vertically homogeneous
with nearly constant P and S velocities of 6.6 and 3.7 km/s, respectively, and an average crustal thickness of 37 km.
Analysis of Rayleigh wave phase and group velocities
yields structural models that are relatively consistent with
the models derived from regional travel times. A method for
calculating interstation phase and group velocities from the interstation transfer function using Wiener deconvolution is
2
presented. The Rayleigh wave phase and group velocities
along different paths are inverted simultaneously using a
maximum-likelihood technique. Phase and group velocities
are also calculated across the MIT short-period network in
southeastern New England by estimating the
frequency-wavenumber power spectra.
Lateral variations in structure are studied using time
term analysis and teleseismic P wave residuals. A region of
thick or low-velocity crust trends northeast across eastern New York, western Massachusetts, southeast Vermont, central
New Hampshire, and central Maine. In eastern New York this
zone correlates with Bouguer gravity lows and with the Taconic klippen; a thick pile of thrusts emplaced during the
mid-Ordovician Taconic orogeny. The crustal thickening
beneath central New England correlates well with Bouguer
gravity lows and is found in the region of highest
topography indicating an isostatically compensated highland area.
The suture between the Grenville and Appalachian Province in the NEUS probably occurs along a north-northeast trending belt extending from northwestern Vermont to southwestern
Connecticut. High crustal velocities and/or crustal
thinning, a linear gravity high, a serpentinite belt,
Precambrian uplifts, and the Taconic thrusts are found along much of this belt which shows many similarities to the Ivera zone in northern Italy.
There is also the possibility of a second suture located
in the eastern section of the study area separating the
central orogenic belt from an eastern block (Avalonia).
Refraction models, and Pn and teleseismic P wave residuals indicate that the crust of the eastern block is probably thinner than that of the central belt and may be missing the
high velocity lower crustal layer. In eastern
Massachusetts, these two regions are separated by prominent fault zones across which no formations can be traced.
Three-dimensional inversion of teleseismic P wave
residuals indicates that a relatively low velocity anomaly
extending to depths in excess of 200 km and dipping to the
northwest shows a spatial correlation with the Bronson Hill
- Boundary Mountains Anticlinorium in central New Hampshire
and Maine. These structures occupy the sites of a complex
series of island arc sequences last active in Early Devonian time prior to the Acadian orogeny. This low-velocity region
may represent subducted oceanic lithosphere which has
undergone post-orogenic radioactive heating. Alternatively,
the oceanic lithosphere may have been totally subducted
resulting in lower velocity material filling the vacated Benioff zone.
The observed differences in crustal structure between the
Grenville and Appalachian Provinces are probably the result
in variations of petrology, chemistry, water content,
temperature, and tectonic evolution. Comparison of seismic
velocities with resistivity measurements suggests that the
rocks with hydrous mineral phases resulting in lowered velocities and a higher Poisson's ratio. Alternatively, the rocks of the lower crust beneath the Grenville Province may
be similar to those found on the surface while higher
velocity, mafic mineralogies are prevalent in the lower
crust of the Appalachians. This is consistent with the
hypothesis that the Grenville crust underwent substantial
reactivation, thickened, and became vertically uniform
during the Grenville orogeny. In contrast, the rocks of the Appalachian belt probably were associated with a cycle of
oceanic opening and closure which suggests an ensimatic
origin of the lower crust in this region.
Thesis Advisor: M. Nafi Toksoz Professor of Geophysics
ACKNOWLEDGEMENTS
The old adage "giving the tie off ones neck" literally
applies to my advisor M. Nafi Toksoz who gave me a
tremendous amount of help and support over the years. His
insight for identifying interesting geophysical problems and defining ways to solve them made things much easier for me.
I will remain indebted to Nafi.
Ed Chiburis of Weston Observatory at Boston College and
Yash Aggarwal, Mary Golisano, and Lynn Sykes of
Lamont-Doherty Geological Observatory freely provided short
period data used in many aspects of this thesis. Many
geological discussions with B. C. Burchfiel, Pat Barosh, and Frank Spear are also greatly appreciated.
My fellow partners-in-crime kept my spirits up and aided
me in all aspects of my work. My fuzzy-faced office-mate
Michael Clair Fehler demonstrated to me that a person can
finish a thesis at M.I.T. without becoming a babbling idiot.
MCF is a real star, and although he specialized in the more
sensual aspects of geophysics such as the study of jerky and wet cracks, and hot dry rocks, he would always take time to
listen to my problems, then say something like "You don't
know that? Its simply the correspondence principle." and
then set me straight. I'll always miss his stern
over-the-glasses looks, his funny accent, his binoculars,
and his stink executive command. Arthur C. H. Cheng, the
5
matrices and the lie of Rick Middleton's hockey stick in the same breath (unless he's reading the sports page...in which
case he won't tell you anything.) Although George Zandt
stinks and can't tell the difference between a phone line
glitch and a deep earthquake (both have a high apparent
velocity), I hope that our continued search for mysterious
blocks in the lithosphere and resurgent domes causes us to
cross paths. Clifford H. Thurber, my theoretical-type
office-mate, sits over there at his desk and continues to
frustrate me with his efficency. His programs work the
first time, he write lots of papers on every different topic
in geophysics, and he continues to maintain a healthy
attitude on life. Never once did he give me a hard time for
stealing cookies out of his desk drawer.
Norm Burr, Bill Ellsworth, and Randy Richardson were a
major influence during my formative years at M.I.T. Norm
introduced me to the wonders of computer hacking, to LLL,
and most importantly to Hilltop Steak House. Bill sort of
took me under his wing and helped with 3-D inversions and
told me "Yes, Steve there is a U Lambda V-transpose".
Without intending to, Randy convinced me to let somebody
else figure out the state of stress in the lithosphere.
In later years, I had fun and interesting discussions
along the way with John Nabelek, Jay Pulli, Jim Muller,
Albert Hsui, Sean Solomon, Wai Ying Chung, Gerardo Suarez,
Mike Chaplin, Rob Comer, and Mark Willis. I also highly
especially on a mountain.
Of course, I shan't forget my stellar seismology
students, Roger Buck, Ken Tubman, Rob Stewart, Dan Davis,
Lynn Hall, and all the others. Ken Tubman also provided
much input into the surface wave analysis and good old RB
kept my ego pumped up. These guys are all going to be superstars.
There are also the "real" people scattered about the
fifth floor. Sara Brydges seemed to be doing me favors
everytime I turned around and in addition to everything
else, helped me keep up on local gossip. George Keough, Al
Taylor, and Dave Johnston provided much assistance with the
maintenance and operation of the M.I.T seismic network.
Then there's always the other two crazies at the end of the hall, Judy Roos and Sharyn Belk.
Of course, none of this would have been possible without
the love, help, and support from both sets of my parents, my
sister-ugly who sent me funny rocks from the Canadian
Rockies, and the rest of the Goff family.
Pino's Pizza (End your quest, at Pino's you've found the best) supplied me with my weekly grease quota.
And without getting mushy, I thank Heather for
everything.
This research was supported by the Nuclear Regulatory
Commission contract NRC-04-76-209 and the Advanced Research
Projects Agency, monitored by the Air Force office of Scientific Research under contract F44620-75-C-0064.
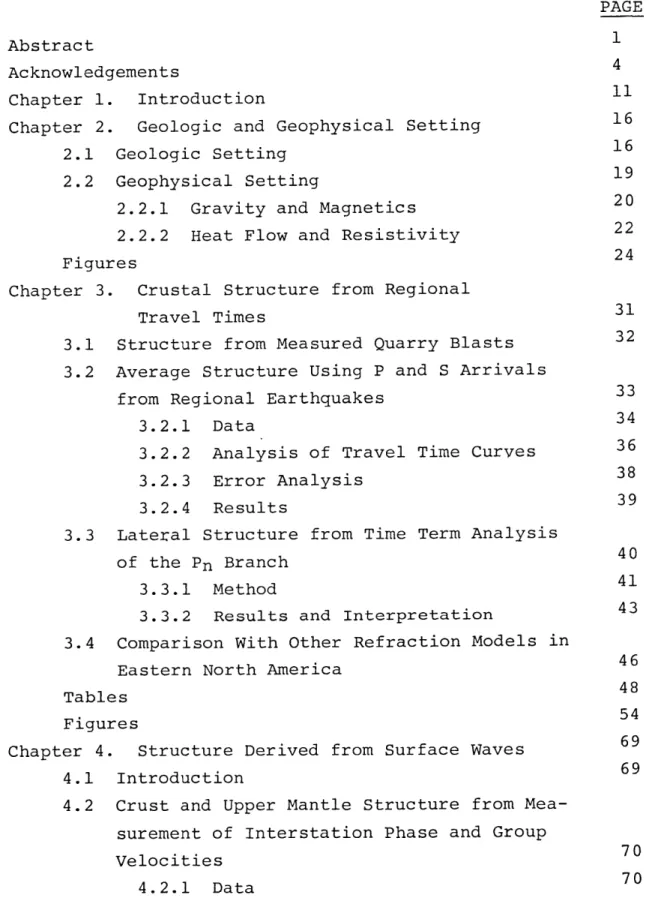
TABLE OF CONTENTS
PAGE
Abstract 1
Acknowledgements 4
Chapter 1. Introduction 11
Chapter 2. Geologic and Geophysical Setting 16
2.1 Geologic Setting 16
2.2 Geophysical Setting 19
2.2.1 Gravity and Magnetics 20
2.2.2 Heat Flow and Resistivity 22
Figures 24
Chapter 3. Crustal Structure from Regional
Travel Times 31
3.1 Structure from Measured Quarry Blasts 32 3.2 Average Structure Using P and S Arrivals
from Regional Earthquakes
3.2.1 Data 34
3.2.2 Analysis of Travel Time Curves 36
3.2.3 Error Analysis 38
3.2.4 Results
3.3 Lateral Structure from Time Term Analysis
of the Pn Branch 40
3.3.1 Method 41
3.3.2 Results and Interpretation 43 3.4 Comparison With Other Refraction Models in
Eastern North America 46
Tables 48
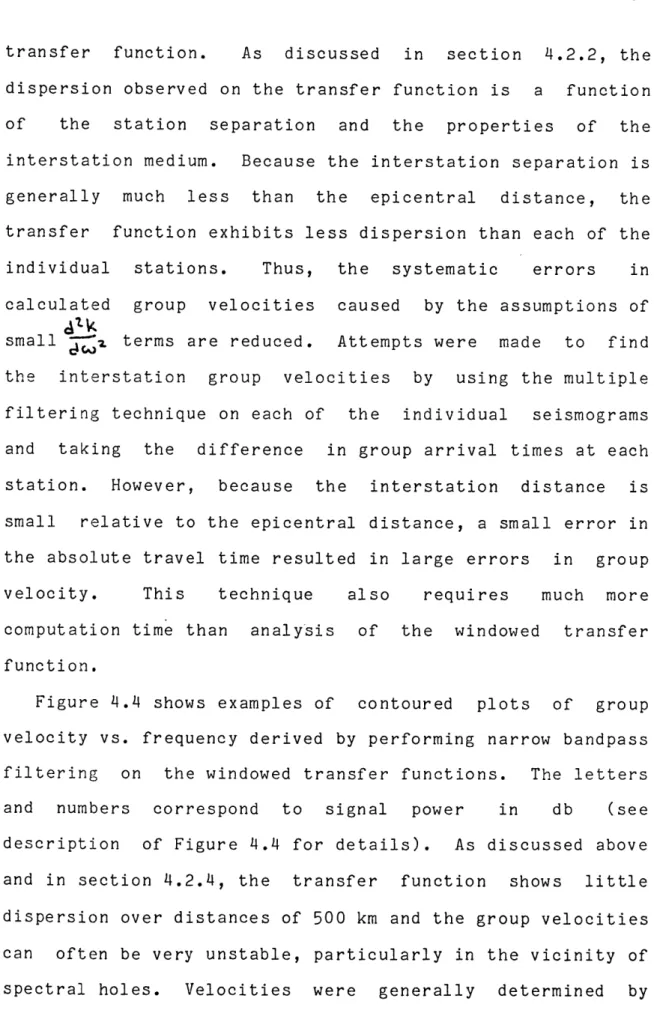
Figures
Chapter 4. Structure Derived from Surface Waves 69
4.1 Introduction 69
4.2 Crust and Upper Mantle Structure from Mea-surement of Interstation Phase and Group
Velocities 70
4.2.2 Interstation Transfer Function Using Wiener Deconvolution
4.2.3 Measurement of Interstation Phase Velocities
4.2.4 Measurement of Interstation Group Velocities
4.2.5 Error Analysis
4.2.6 Description of Rayleigh Wave Phase and Group Velocities
4.3 Estimation of Frequency-Wavenumber Power Spectrum in Southeastern New England
4.3.1 Data
4.3.2 Interpretation and Discussion 4.4 Simultaneous Inversion of Rayleigh Wave
Phase and Group Velocities Using a Maximum-Likelihood Technique
4.4.1 Information Derived from Fundamental Mode Rayleigh Wave Phase and Group Velocities
4.4.2 Inversion Results Tables
Figures
Chapter 5. Crust and Upper Mantle Structure from Teleseismic P Waves
5.1 Travel Time Residuals
5.2 Three-Dimensional Inversion Tables
Figures
Chapter 6. Variations of Crust and Upper Mantle Structure in the Appalachian Orogenic
Belt: Implications for Tectonic Evolution 6.1 Summary of Results Presented in Previous
Chapters
6.2 Contrasts Between Grenville and Appalachian Provinces in the NEUS
6.2.1 Compositional Differences
6.2.2 Contrasts in Tectonic Evolution
9 PAGE 72 74 76 81 85 87 89 91 93 102 105 148 150 160 170 173 190 190 194 195 198
6.3 Contrasts Between Northern and Southern Appalachians
6.4 Tectonic Evolution of the Northern Appalachians Table Figures References Appendix A. Appendix B. Appendix Appendix Figures Appendix E. Appendix F. Appendix G.
Generalized and Stochastic Inversion Non-Linear Inversion of Travel Time Data for Cross-Over Distances and Apparent Velocities
Time Term Analysis
Computation of Frequency-Wavenumber Power Spectra
Calculation of Phase and Group Velocity Partial Derivatives
Maximum-Likelihood Inversion of Phase and Group Velocity
Interstation Transfer Function Using Wiener Deconvolution Figures Biographical Note PAGE 209 212 219 220 226 240 246 251 257 267 270 273 277 283 287
CHAPTER 1
INTRODUCTION
With the northeastern United States (NEUS) seismic
network in operation since 1975, it became possible to
investigate for the first time the crust and upper mantle structure of the Precambrian Grenville Province in New York
state and the New England Paleozoic Appalachian Province.
The region under study in this thesis is actually one small
segment of an impressive Paleozoic mountain chain that
extends at least 3,000 km from the southeastern United
States through New England and into Newfoundland.
The tectonic history of ancient mountain belts is usually interpreted in terms of the reigning evolutionary models for neo-tectonic belts such as the Himalayas, the Alps, or the
Zagros. However, the geology and geophysics of older
mountain belts is often known in great detail and it is
difficult to formulate even a simple first order
evolutionary model because of the numerous complications
encountered. Ancient orogenic belts represent deeply eroded
cores of more recent mountain chains and detailed geologic
and geophysical studies of these older belts such as the
Appalachians should provide important constraints for
interpreting the younger belts.
associated with the northern Appalachians were discussed at the Zen-Zietz Penrose Conference of the Geological Society
of America in 1972, and are summarized by Zietz and Zen
(1973). During the conference, it became clear that
detailed seismic work would be necessary to aid in solving
geologic and tectonic problems. A detailed seismic
refraction survey was judged to be too expensive.
"Without it, however, calculations based on gravity data are too unconstrained to lead to much
more than inconclusive speculation. Lynn Sykes
suggested that some of the desired information on
velocity structure might be obtained at vastly
less cost by a long-term program of earthquake
observations using arrays of geophones linked by
telephone; this suggestion seemed to arouse much
interest, although in the core area, because of
the convergence of phyical properties (largely
through metamorphism and intrusion) of the
supracrustal rocks and the basement, one may doubt that remote physical measurements could lead to reasonable discrimination of these rocks.
Cross-sections extending to the base of the
crust and preferably lower, are, nonetheless, a
potentially profitable meeting ground for
geologists and geophysicists because these
sections help to define the geometric problems of
13
lithologic, and metamorphic data obtained at the
surface to predict geologic conditions several
kilometers below the surface and to reconstruct
physical conditions of the past, including such
things as the structure and volume of rocks now
eroded and estimates of crustal shortening.
Geophysicists can give important assistance to
some types of downward projection in the
near-surface environment and can provide almost
the only information available for deeper parts of the crust and mantle."
The above quote taken from Zietz and Zen (1973)
summarizes some of the goals of this thesis; i.e. to collect body and surface wave data from a regional seismic network,
derive a structural model, and interpret the model in terms
of geologic and other geophysical information.
Chapter 2 is mainly a literature review summarizing the
geologic setting of New England and other relevant
geophysical observations such as seismic, gravity, magnetic, heat flow, and electrical measurements.
In Chapter 3, refraction profiles from timed quarry
blasts are first presented and contrasts between the
Precambrian Grenville Province in New York State and the
Paleozoic Appalachian Province are explored using travel
times from regional earthquakes recorded by the NEUS
network. Lateral variations in structure across the NEUS
of the travel time curve. The last section in Chapter 3 compares the derived velocity models with other models from both the northern and southern Appalachians.
Surface wave dispersion measurements are presented in
Chapter 4 for a number of different paths across
northeastern North America. Interstation phase and group
velocities are measured from the interstation transfer
function which is calculated using Wiener deconvolution.
Rayleigh wave phase and group velocities are also measured
across the MIT short-period seismic network from the
frequency-wavenumber power spectra. For each path, the
observed phase and group velocities are inverted
simultaneously using a maximum-likelihood technique in order to derive a shear velocity with depth profile.
In Chapter 5, teleseismic P wave residuals recorded
across the NEUS seismic network are analyzed to determine
lateral variations in crust and upper mantle structure
beneath the region. The residuals are compared with gravity and the time term observations and a three-dimensional model
for the crust and upper mantle is presented using the
technique of Aki et al., (1977).
In Chapter 6, the results from previous chapters are
first summarized. Then the crust and upper mantle structure
between the Grenville and Appalachian Provinces is compared
in terms of variations in composition and tectonic
evolution.
15
made between the northern and southern Appalachians. The
COCORP findings across the Blue Ridge and Piedmont in
Georgia, North Carolina, and Tennessee have solved numerous
long-standing geologic and tectonic problems in the southern Appalachians and are included in the discussion.
Finally, a first order plate tectonic model of the New
England Appalachians is presented which satisfies many
16
CHAPTER 2
GEOLOGIC AND GEOPHYSICAL SETTING
In this chapter, the geologic setting of the northeastern
United States is reviewed and a simple model for its
tectonic evolution will be presented in Chapter 6. Because
only regional, large-scale structures are analyzed using
seismic techniques in the following chapters, the
discussions are kept quite general. Then, previous
geophysical studies utilizing seismic, gravity, magnetic,
heat flow, and electrical techniques are reviewed.
2.1 GEOLOGIC SETTING
The northern Appalachians have undergone a long and
extremely complex geological development. Table 6.1 lists
major orogenic episodes in the Appalachians and the maximum manifestation in the area of influence (from Rodgers, 1970).
Dating and stratigraphic correlation between regions has
been complicated by numerous orogenic episodes. The
northern Appalachians can be divided into three major
tectonic units (Bird and Dewey, 1970; Naylor, 1975): a
western belt and an eastern belt possibly representing the
central orogenic belt composed mainly of eugeoclinal
lithologies (Figure 2.1). The western unit is mainly
underlain by rocks of the Precambrian Grenville Province
which are exposed in the Adirondacks and outlying massifs
such as the Green Mountains, Berkshires, and the Hudson
Highlands. Unconformably overlying the Grenville basement
is an Eocambrian to Cambrian platform sequence which grades
upward into a Lower Ordovician clastic sequence. Found
above are the Taconic klippe which consist primarily of
deep-water shales, sandstones, and graywackes.
Paleontological evidence suggests that they were deposited
contemporaneously with the shelf sediments (Zen, 1972).
The central orogenic belt consists of a number of broad
structural warps. The Connecticut Valley Synclinorium
(CVS) is found to the east of the previously discussed
Precambrian massifs and can be traced from Connecticut
through Quebec to the Gulf of St. Lawrence. The CVS
contains a thick, highly metamorphosed eugeoclinal sequence
divided into two members separated by a major Middle
Ordovician unconformity. A linear serpentinite belt follows
the western flanks of the CVS.
East of CVS lies the Bronson Hill Anticlinorium (BHA)
which consists of a chain of elliptical gneissic domes
(Oliverian Plutonic series in New Hampshire). The structure
can be traced from Connecticut through northern New
Hampshire and is probably continuous with the Boundary
series of mafic metavolcanics associated with felsic metavolcanics and metasediments (Ammonoosuc Volcanics in New Hampshire) of Middle Ordovician age or older (440 30 m.y.;
Naylor, 1975). Unconformably overlying the Ammonoosucs is a
series of Silurian to Lower Devonian highly metamorphosed
clastics with some carbonates and volcanics.
Eastward of the BHA lies the Merrimack Synclinorium (MS)
which is a major northeast-trending tectonic feature
extending from eastern Connecticut through Maine and into
New Brunswick. It is the site of thick accumulations of
Ordovician to Lower Devonian metasediments typically
metamorphosed to sillimanite grade. These metasediments
(Devonian Littleton Formation) can be correlated with
Devonian strata at the top of the BHA. The MS also contains
large volumes of intrusives belonging to the Middle Devonian
New Hampshire Plutonic Series and the Mesozoic White
Mountain Magma series.
On the eastern flank of the MS a major northeast-trending
thrust belt (Clinton-Newbury, Bloody Bluff, and Lake Char
Faults) extends from southern Connecticut through eastern
Massachusetts (Skehan, 1969). Magnetic anomalies associated
with the formations in the thrust belt suggest that the
faults continue offshore in an east-northeast direction into
the Gulf of Maine (Weston Geophysical, 1976; Alvord et al.,
1976) and possibly into New Brunswick (Nelson, 1976). In
eastern Massachusetts the northwest dipping thrusts greatly
be traced across them (P. Barosh, personal commun.). Deformation and metamorphism in the MS probably delineate a
zone of maximum intensity of the Middle Devonian Acadian
orogeny (Rodgers, 1970).
The Eastern Basement is exposed to the east of the above
described thrust belt. These units are probably correlative
with rocks of the Avalon Zone in Newfoundland and
southeastern New Brunswick (Bird and Dewey, 1970; Nelson,
1976). The region in eastern Massachusetts is characterized
by plutonic, metasedimentary and metavolcanic rocks
metamorphosed mainly to chlorite grade ranging in age from
late Precambrian to Carboniferous. Unfossiliferous strata
and scattered age dating have made geologic interpretations
enigmatic (Naylor, 1975; Zarrow et al., 1978). However,
according to Naylor (1975), no rocks have been assigned an
age greater than 650 m.y. which is significantly younger
than the Grenville age rocks ( 1,100 m.y.) in the western
belt.
2.2 GEOPHYSICAL SETTING
To date, very little seismological work pertaining to
crust and mantle structure has been done in the northeastern
United States. Early studies involving analysis of local
earthquake data and timed quarry blasts include those by
Howell (1964). More recently, some refraction work has been published by Chiburis and Graham (1978), Aggarwal in Schnerk
et al., (1976), and Taylor and Toksoz (1979a). These
studies along with other refraction models from neighboring
regions are summarized in Table 3.5 and discussed in section 3.4.
Some observations have been made on teleseismic P waves
recorded in the NEUS by Wu and Allen (1972) who directly
measured dT/d& across the five original Boston College
stations and by Fletcher et al., (1978), who observed
teleseismic P wave residuals across the eastern U.S. and
Canada. Although the study by Fletcher et al., (1978)
involves readings from only a few nuclear explosions, their
observations are quite similar to those discussed in Chapter
5. Early arrivals are observed for stations in the
Grenville Province relative to those in the Appalachians
especially for sources from the northwest.
Surface wave studies in the NEUS are limited to those by
Brune and Dorman (1963), Dorman and Ewing (1962), and Taylor
and Toksoz (1979b) and are consistent with refraction
results and are discussed in Chapter 4.
2.2.1 GRAVITY AND MAGNETICS
Gravity and magnetic anomalies show very good
States. Their prominent features will be described in this
section and their fit into the tectonic framework of the
eastern U.S. will be discussed in Chapter 6. Detailed
gravity and areomagnetic maps are available over much of the
NEUS. A generalized Bouguer gravity map after Kane et al.,
(1972) is shown in Figure 2.2a for the NEUS and in Figure
2.2b for the eastern U.S. (Diment et al., (1972)). The
prominant features observed in the regional gravity field in
the NEUS are a low over the Taconic klippen in eastern New
York, a low over the White Mountains in northern New
Hampshire, and a northeast-trending low over the CVS in
Vermont and western Maine. A north-northeast trending
gravity high is found in western Connecticut, western
Massachusetts, western Vermont, and into Quebec and is
associated with the Precambrian uplifts and the serpentinite
belt. There is also a gravity high found in the northern
Adirondacks and along the Atlantic coast. As noted by Kane
et al., (1972), more detailed maps show a discontinuity in
regional trends where broad northeast-striking gravity
elements of eastern and northern New England are separated
from the more northernly-trending anomalies of western New
England along a line extending from Rhode Island to
north-central Vermont.
Excellent areomagnetic data is available over much of the
NEUS. Because a dipolar field falls of as r-3 as opposed
to r'A for the gravity data, the magnetic anomalies are of
correlation with surface geologic features (Figure 2.3).
Areomagnetic data has been crutial for mapping important
structural and stratigraphic contacts where they are often
obscured by glacial sediments or water (Alvord et al., 1976;
Weston Geophys. Res. Inc., 1976). Prominant features
observed on the areomagnetic maps are the Clinton-Newbury
and Bloody Bluff Fault zone in eastern Massachusetts and
eastern Connecticut, rocks of the White Mountain Plutonic
series, diabase dikes associated with Triassic rifting, the
Oliverian domes and gneiss domes of the BHA. In general,
Cambrian-Ordovician rocks such as the Nashoba Formation
within the Clinton-Newbury and Bloody Bluff Fault Zone have
a stronger magnetic signiture than Silurian-Devonian rocks.
2.2.2 HEAT FLOW AND RESISTIVITY.
Heat flow measurements in the NEUS are few and are
subject to many effects which are difficult to correct for
such as climatic variations, thermal conductivity, and
radiogenic heat production. Diment et al., (1972)
summarizes early heat flow measurements and makes
corrections for Pleistocene climatic variations (Figure
2.4). More recent measurements which include corrections
for radioactivity were made by Jaupart (1979). Figure 2.4
indicates that central New England is characterized by a
many of these measurements are taken from highly radioactive plutons, Jaupart (1979) concludes that these trends persist after corrections for radioactivity which suggests that the
anomalies may be caused by differences in mantle
temperature.
Resistivity measurements in the NEUS suggest the presense
of a highly conductive lower crust in the Adirondack
Mountains in New York state (Connerney et al., 1979), while
a resistive lower crust underlies a slightly conductive,
approximately 15 km thick upper crust in New England
(Kasameyer, 1974). Using geomagnetic sounding, Bailey et
al., (1978) found evidence for high telluric current flow in
central New England which they attributed to a 200 degree
thermal anomaly and low resistivity at the base of the
crust. However, the anomaly they observe may actually be
caused by highly conductive formations found in the
Merrimack Synclinorium such as the Brimfield Schist which
contain abundant graphite and iron sulfides (T. Madden,
pers. comm.).
In the next three chapters, body wave data from regional
and teleseismic events and surface wave dispersion
measurements will be presented. In Chapter 6, the results
will be jointly interpreted with the geologic and
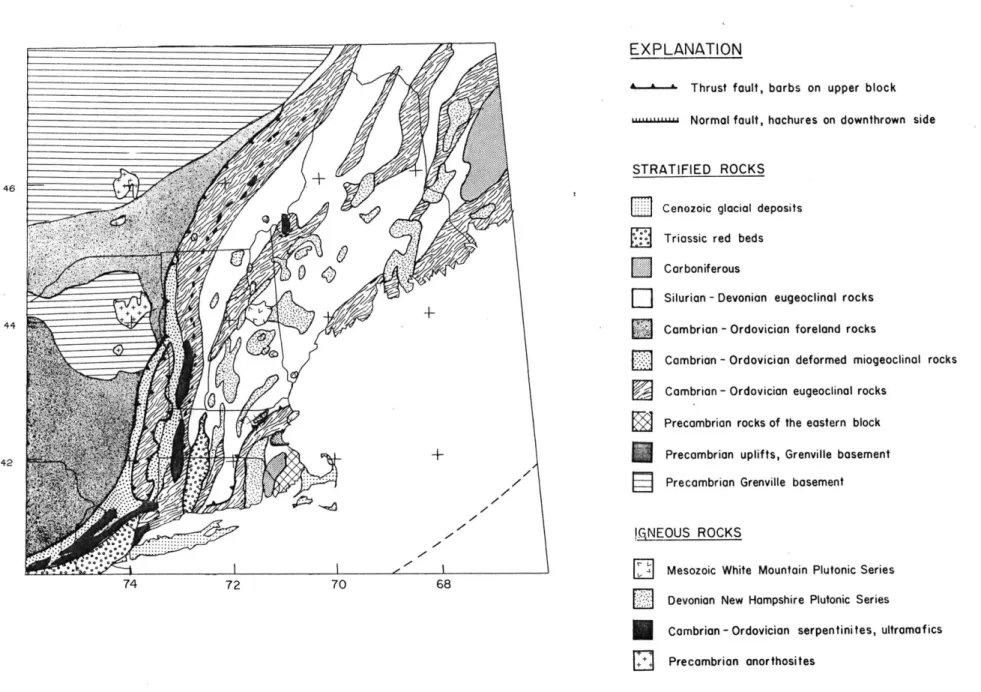
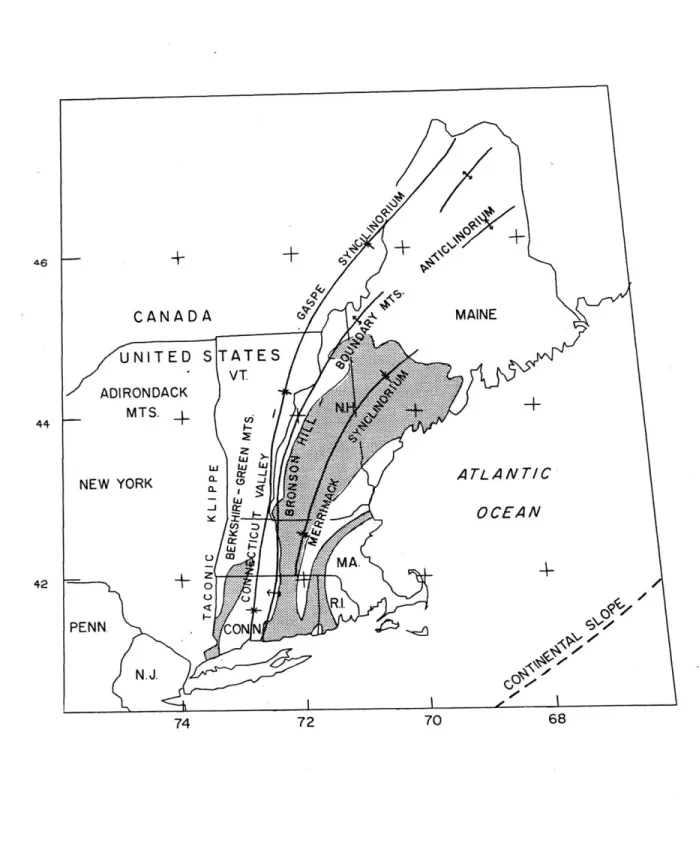
24 FIGURE CAPTIONS Figure 2.1a Figure 2.1b Figure 2.2a Figure 2.2b Figure 2.3 Figure 2.4
Generalized geologic map of northeastern
United States. Modified from King (1969).
Major tectonic structure in northeastern
United States. Shaded regions correspond to
sillimanite-grade metamorphic zones.
Bouguer gravity in northeastern United
States. Areas with positive gravity
anomalies are shaded. Modified from Kane et
al. (1972).
Bouguer gravity in eastern United States;
from Diment et al. (1972).
Areomagnetic map of New England.
interval is 100 gammas.
Contour
Heat flow corrected for Pleistocene climatic variations; from Diment et al., (1972).
EXPLANATION
Thrust fault, barbs on upper block
""" Normal fault, hachures on downthrown side
STRATIFIED ROCKS
D
Cenozoic glacial depositsTriassic red beds Carboniferous
Silurian - Devonian eugeoclinal rocks Cambrian - Ordovician foreland rocks
Cambrian - Ordovician deformed miogeoclinal rocks Cambrian - Ordovician eugeoclinal rocks
W
Precambrian rocks of the eastern block Precambrian uplifts, Grenville basementPrecambrian Grenville basement
jG.NEOUS ROCKS
1 Mesozoic White Mountain Plutonic Series
D
Devonian New Hampshire Plutonic SeriesCambrian - Ordovician serpentinites, ultramafics Precambrian anorthosites
Figure 2.la
74 72 70 68
27
74 72 70 68
800 70* 900
500-
400-C
3Q0* 90* 80* Figure 2.2b 400 3005900 S)oor
700
300
31
CHAPTER 3
CRUSTAL STRUCTURE FROM REGIONAL TRAVEL TIMES
Analysis of travel times from quarry blasts and
earthquakes in the northeastern United States have been
limited in scope and have yielded inconsistent results,
indicating the complicated structure in the region. Leet
(1941) and Linehan (1962) published early results in New
England using data from regional earthquakes recorded on a
small network. Katz (1955) published refraction results in
New York State from interpretation of a few timed quarry
blasts recorded along linear arrays. More recently, some
refraction work has been reported by Chiburis and Graham
(1978), Aggarwal (in Schnerk et al., 1976), and Taylor and
Toksoz (1979).
In this chapter, results from timed quarry blasts are
presented using data from portable stations and the NEUS
seismic network. Average compressional and shear wave
velocity structure using regional earthquakes are derived
using data from the NEUS network, and lateral variations in structure are studied by performing a time term analysis of
the Pn travel time branch. Finally, the results are
contrasted with other travel time studies in other portions of the Appalachians and eastern North America.
3.1 STRUCTURE FROM MEASURED QUARRY BLASTS
Ten quarry blasts have been timed in New England and
Canada and recorded on both portable and permanent seismic
stations. The blasts and stations used are shown in Figure
3.1, and the origin times, and blast locations are listed in
Table 3.1. About half of the blasts were located in
southern New England, and the rest in the large, open pit
asbestoes mines in Quebec. Three shots were also recorded
in Vermont.
Instruments used both for collecting origin times and as
portable stations consisted of Sprengnether MEQ-800's
recording on smoked paper drums, and USGS J-302 VCO's
recording FM signals on cassette tapes. Drum recordings
were made with a speed of 240 mm/min where reading precision for sharp arrivals has a standard error of about 0.05 sec.
The cassette recordings could be discrimminated and played
back at very high speeds (3 cm/s or greater) and reading
precision is on the order of a few milliseconds. For these
readings, accuracy was limited by the drift of the crystal oscillator clock, whose timing corrections were less than 20 ms/day, and the impulsiveness of the signal.
The quarry and roadcut blasts ranged in size from
approximately 5,000-20,000 kg. Shot configurations were
generally an array of 40-200 drillholes, each 15-20 m deep
and 8-10 cm in diameter. The delay time along the string
33
ammonium-nitrate and fuel oil. The 5,000 Kg shots generally
produced clear arrivals out to 150 km and readings beyond
this distance are few and are limited to only the larger
blasts.
A composite refraction profile and compressional velocity
model is shown in Figure 3.2 and listed in Table 3.2. One
of the most notable features discovered upon analysis of the
travel times is the extreme regional variability of the
uppermost crustal layer. Velocities in eastern
Massachusetts range from less than 5 km/s to 5.8 km/s, and a
6.0 km/s 'upper layer was identified in southern Maine.
Because the blasts produced few impulsive arrivals at
distances greater than 150 km, the crustal thickness and the
velocities of the lower layers are not well constrained.
However, it does appear that the lower crust is
characterized by velocities greater than 7.0 km/s and that
the cross-over distance for the Pn branch is greater than
160 km, indicating crustal thicknesses in excess of 35 km.
3.2 AVERAGE STRUCTURE USING P AND S ARRIVALS FROM REGIONAL
EARTHQUAKES
Refraction models derived from timed blasts are very
useful in determining crustal structure and as discussed in
the previous section indicate a high degree of structural
34
difficulties in working solely with the seismic refraction
surveys. First, the data collection can be difficult,
expensive, and time-consuming. A number of refraction lines
were set up by the author only to find that the blast either
occurred much earlier than expected or was delayed, or was
too small to produce usable recordings. Second, and more
importantly, most of the blasts were too small to generate
impulsive Pn arrivals which are essential in estimating
crustal thickness. Interpretation of the refraction
profiles was also complicated by the paucity of data at
certain crutial distance intervals. In constrast, a wealth
of information can be derived by analyzing readings from the
large number of earthquakes recorded and cataloged over the
past four or five years since the NEUS seismic network was
initiated. Although the earthquake-generated dataset
contains errors which are due to effects of mislocations and
errors in origin times, it represents a much more complete
collection of arrival-time information than the refraction
surveys using explosive sources. In this section, the
earthquake dataset and the method of analysis is discussed
along with a description of the results.
3.2.1 DATA
A dataset of 1545 P-wave and 546 S-wave readings from 170
was selected from earthquake bulletins of the NEUS seismic
network (Chiburis et al., 1975-1979). The earthquakes used
are shown in Figure 3.4. The magnitude range was between
1.5 and 3.8, and small magnitude events and swarms with poor
epicentral control were eliminated. A few events with
well-constrained focal depths of about 10 km in the
Adirondacks were deleted from the dataset. These events
were characterized by "depth" hyperbolae (Figure 3.5a) from
readings at nearby stations which would cause positive
errors in velocity estimates of upper crustal layers unless
depth carrections were made. Some relatively deep events
(d>10 km) were located by the Canadian network in Quebec.
However, as discussed below, the effects that these focal
depths have on the travel times to the distant NEUS stations
is small. Because most events are shallow (less than 10 km)
a surface focus was assumed, and travel times were computed with respect to published epicenters and origin times.
Travel time plots were constructed for various
event-station combinations and it became readily apparent
that significant differences in travel time curves existed between stations lying above Grenville basement and stations
lying in the New England Appalachians. The serpentinite
belt and the Precambrian uplifts were used to separate
stations into the two regions (Figure 2.1a). Reduced travel
time plots using P and S travel times for stations lying
above Grenville and Appalachian basement are plotted
Appalachian and Grenville stations show similar travel times
past epicentral distances of about 200 km. However,
overlays of the travel time curves demonstrate that
significant crustal differences exist between the two
regions. For distances less than 200 km, the Grenville
travel time curve is remarkably linear, while the
Appalachian curve shows lower velocities out to at least 100
km where arrival times on the separate plots begin to
rapidly converge.
Although readings made from the enlarged develocorder
films generally have a standard error of 0.1 sec, scatter in
the travel time plots arise from errors in hypocenter and
origin time, misidentification of phases, and lateral
complexities in structure.
3.2.2 ANALYSIS OF TRAVEL TIME CURVES
A number of different techniques are available for
interpretation of the travel time profiles shown in Figure
3.6. A simultaneous inversion for hypocenters and velocity
structure was considered following the technique described
by Aki and Lee (1976). However, the distribution of events
and stations in the NEUS is not suitable for this type of
analysis. Many of the events used occur outside of the
region being modeled and were originally located using the
events and the resolution of deeper crustal layers would be very poor.
A Wiechert-Herglotz or tau inversion was also considered.
However, because of the scatter in the data these inversion
techniques were judged to be too eloquent. On the other
extreme, identifying and fitting straight line segments to
travel time branches is very subjective and may not achieve
a best solution in a least squares sense.
A more systematic, yet simple approach following the
technique of Mitchell and Hashim (1977) was selected (see
Appendix.B for details). Given a set of travel time data, a
nonlinear least squares method is used to solve for apparent
velocities, critical distances, and corresponding intercept
times for a plane layered earth model. The method solves a
system of equations containing nonlinear terms involving
critical distance divided by refractor velocity (see
Appendix B and Figure 3.3).
Because a least squares technique is used, critical
distances, their corresponding times, and apparent
velocities are perturbed about a trial model. The initial
model was selected by estimating critical distances and
corresponding times from reduced travel time plots with
expanded time scales. Trial apparent velocities were then
calculated by taking the inverse slope of a least squares
38
3.2.3 ERROR ANALYSIS
The travel time data generally had a standard deviation
of about 0.7 sec. This scatter is probably caused mostly by
errors in epicentral location, focal depth, and origin time. Reading errors, phase misidentification, and differences in
travel time with azimuth caused by lateral variations in
structure and anisotropy are probably also important
factors.
Epicentral locations for most events are probably
accurate to within 5 km. Location errors of 5 km will cause
travel time errors of less than one second.
Effects of errors in earthquake depth on travel times was
also investigated. With the exception of one area in the
Adirondacks and La Malbaie, Quebec, most earthquakes in the
study area have foci of less than 10 km (Sbar and Sykes,
1977). Recently, accurate location of aftershocks near
Bath, Maine indicated depths of less than 7 km (Graham and
Chiburis, 1980). For a homogeneous upper crust, the partial
derivatives of travel time with respect to depth, z, can be
approximated by
DT (3.1%)
where VO is the crustal velocity, x is the epicentral
distance. These partial derivatives for various depths are
plotted as a function of distance in Figure 3.5b for VO =
time will be less than 1 second and will be negligible for
distances greater than about 40 km.
It is possible that the velocity model used in locating
the earthquakes introduces some bias into the
interpretation. Most of the earthquake locations and origin
times used in the NEUS were calculated using the same
velocity model (Chiburis et al., 1975-1979). The
earthquakes in Canada were located by combining readings
from the NEUS stations with the Canadian network using a
different velocity model. In a region with reasonably dense
station coverage and without strong lateral variations in
velocity such as eastern North America, small differences in
the velocity model should not have a significant effect on
the appearence of the travel time curves shown in Figure
3.6. As demonstrated by Anderson (1979), fairly accurate
epicenter locations within an array can be obtained by
simply constructing a series of station bisectors based on
relative arrival times with no information on velocities.
Although most of the earthquakes are located using the same
velocity model, the differences in travel times observed
between Appalachian and Grenville stations (Figure 3.6, 3.7)
gives further support that the location velocity model
introduces little bias into the final interpretation.
40
The final velocity models, and fit to the data for
Appalachian and Grenville P and S travel time curves are
shown out to 300 km in Figure 3.7. The critical distances,
corresponding times, apparent velocities, layer thicknesses,
and model errors are listed in Table 3.3. As will be
discussed in section 3.4, the results obtained from
interpretation of the travel time profiles are consistent
with previous refraction models and show large contrasts
between the two orogenic belts. The crust of the Grenville
Province appears to be very homogeneous with nearly constant
P and- S wave velocities of about 6.6 and 3.7 km/s,
respectively, with an average crustal thickness of 37 km.
In contrast, the Appalachians are characterized by a
slightly thicker (approximately 40 km) crust with two
well-defined layers. The upper crust in the Appalachians
shows relatively low P and S velocities of about 6.1 and 3.6
km/s, respectively, to about 15 km where an abrupt increase
to 7.0 km/s and 4.1 km/s occurs. Both regions show similar
Pn velocities of 8.0 km/s for the Grenville and 8.1 km/s for the Appalachians.
3.3 LATERAL STRUCTURE FROM TIME TERM ANALYSIS OF THE Pn
BRANCH
The least squares technique discussed in the previous
regions and cannot adequately portray lateral variations in
crustal structure. To study these lateral variations in
crustal structure, a time term analysis was applied to the
Pn branch of the travel time curve for all stations
simultaneously (D > 200 km).
Previous time term studies in eastern North America
include those by James et al. (1968) in the Middle Atlantic
States, Berry and West (1966) from the Lake Superior
refraction experiment, and Berry and Fuchs (1973) in eastern Canada.
3.3.1 METHOD
The time term method (Scheiddegger and Willmore, 1957;
Willmore and Bancroft, 1960) is based on the fact that the
travel time, Tij, between a source i and station
j
can berepresented by the sum of a source and receiver term and the distance, Dij, divided by the average refractor velocity (in this case the Pn velocity) Vpn (Figure 3.8)
Because the sum of the source and receiver terms equal a
constant (the zero-distance intercept time of the travel
time branch), there are infinitely many solutions and the
system is singular (see Appendix C). Thus, the generalized
zero eigenvalue resulting from the non-uniqueness of the source and receiver term was truncated (Wiggins, 1972).
A number of crutial assumptions are made in the
derivation of equation 3.2. First, it is assumed that the
dip of the refractor is small. Without an adequate
azimuthal distribution of sources, problems similar to those
of an unreversed seismic refraction profile can result and
there can be systematic errors in the time terms and
refractor velocity. However, as can be seen from Figure
3.4, there is a reasonably good azimuthal distribution of
events. Also, in an older, stable geologic province such as
that in the NEUS, the regional dips of the Moho are expected
to be small. Similar errors can occur if there exist large
regional variations in the refractor velocity. As discussed
in the previous section, although the Grenville and New
England Appalachians show regional differences in the crust, the Pn velocities appear to be quite similar.
It is also assumed that effects of velocity anisotropy
are small and that a large velocity gradient does not exist
in the upper mantle (i.e. the second derivative of the Pn
travel time branch is small). Velocity anisotropy can be
examined by including azimuthal terms involving sines and
cosines into the time term equation (McCollom and Crosson,
1975). Berry and Fuchs (1973) found only weak, poorly
defined anisotropy in the Grenville Province. Velocity
gradients can be modeled by incorporating higher order
from Figure 3.6, the Pn travel time branch is fairly linear,
and the coefficients of the higher order terms would be
small.
3.3.2 RESULTS AND INTERPRETATION
Earthquakes were selected from those of Figure 3.4 which
yielded three or more Pn arrivals in the distance range of
200-600 km. In all, 71 events, 61 stations and 343 readings
were used. For each event, epicentral distances and moveout
times from the nearest station were calculated. Relative
station time terms, j were computed by subtracting off
the mean time term from each station time term, Ki , using
where N is the number of stations.
The calculated Pn velocity is 8.04 km/s and the relative station time terms, standard errors, and number of readings are listed in Table 3.4 and shown in Figure 3.9 for stations with four or more readings.
As will be discussed in Chapter 5, the station time terms
have fewer readings and therefore are less constrained than
the average relative teleseismic P-wave residuals, although
the two sets of residuals do show a relatively good
correlation. A trend of positive time terms (late arrivals)
Massachusetts, southeast Vermont, central New Hampshire, and
central Maine. Negative time terms (early arrivals) are
observed in northeastern New York and northwestern Vermont
and also along much of the coastline.
As discussed in Appendix C, for a layer over a half-space
model, the station time terms are functions of crustal
thickness, velocity, and upper mantle velocity. Thus,
unless some constraints can be placed on the problem, the
station time terms can be interpreted a number of different
ways.
Because the Pn velocities appear to be relatively
constant and the average crustal velocities are similar
across the NEUS, it was decided to model the time terms as a
function of crustal thickness. Inverting absolute time
terms for crustal thickness requires the direct measurement
of the source terms, Sj, at a given site
j,
by recording theorigin time and measuring the intercept time from the
resulting travel time vs. distance plot. It would then be
necessary to record a Pn arrival at the same site, calculate
the resulting "station term", Rj, and equate Sj = Rj.
Because all of the station terms are relative, this would
assign absolute values to them, which could be used to
invert for absolute crustal thickness assuming a crustal
velocity function.
Only relative time terms were calculated in this study,
so the crust and upper mantle parameters from this and the
order approximation of crustal thickness variations. To
obtain the crustal thickness values at each station site
from the relative time terms, a single layer over a half
space model is used where the crustal thickness is
and
where Vpn = 8.04, Va
=
6.6, hO = 38 km for Grenvillestations and 39 km for Appalachian stations. Note that the
estimate of the average crustal velocity is slightly high so the crustal thickness variations are probably the maximum to
be expected. The crustal thickness map is shown in Figure
3.10.
As indicated by observing the relative station time terms
in Figure 3.9, the crustal thickness appears to be greatest
(and/or velocities are lowest) in a northeast trending belt
running from eastern New York,' through central New
Hampshire, and into Maine. This belt shows a remarkable
correlation with the belt of Bouguer gravity lows shown in
Figure 2.2. Crustal thinning (and/or high crustal
velocities) is found in northwestern Vermont and
northeastern New York and along the Atlantic coast.
The crustal thickness map is based on an overly
simplified model and represents at best a first order
approximation. Many factors contribute to erroneous crustal
46
by Bath (1978).
3.4 COMPARISON WITH OTHER REFRACTION MODELS IN EASTERN
NORTH AMERICA
Results from observations of regional travel times
suggests that significant differences in crustal structure
exist between the Grenville and Appalachian Provinces. In
this section, the models presented in this chapter will be
compared with other refraction models measured in eastern
North America. The tectonic implications of the structural
differences will be examined in Chapter 6.
Refraction models for the northern and southern
Appalachians and the Grenville Province are contrasted in
Table 3.5. The northern Appalachians appear to be composed
of a relatively thick, 40 km crust with two well-defined
layers. The lower crust is characterized by relatively high
velocities of 7 km/s. This is consistent with refraction
models of Leet (1941) and Steinhart et al., (1962) in the
NEUS, R.L.Street (pers. comm.) in central New Hampshire, and
Dainty et al. (1966) in Newfoundland. Two models presented
by Chiburis and Graham (1978) in southeastern New England
and Nakamura and Howell (1964) in eastern Maine suggests
crustal thinning and a missing high velocity lower layer
along the Atlantic coast. The region where the Chiburis and
characterized by a zone of negative time terms and apparent
crustal thinning (Figures 3.9 and 3.10). Interestingly,
these surveys may have sampled rocks of the eastern Block
(or Avalon zone) discussed in Chapter 2.
Refraction models from the Grenville Province appear to
be fairly similar along its length from the southeastern
U.S. to eastern Canada. In eastern Canada the high velocity
lower crustal layer is absent or weakly developed (Dainty et
al., 1966; Berry and Fuchs, 1973). It also appears that the
Grenville crust thickens from about 36 km at its eastern
edge to about 45 km at its western edge in the vicinity of
the Grenville Front. In New York state, the Grenville crust
appears to be uniform, about 36 km thick, with velocities
ranging from 6.4 to 6.6 km/s (Katz, 1955; Aggarwal in
Schnerk et al., 1976).
Further south, west of the Blue Ridge, the Grenville
crust appears to have two layers but the lower crustal layer
is about 6.7 km/s which is low relative to the northern
Appalachians (Steinhart and Meyer, 1961). The 14 km thick
upper layer could by composed of the allochthonous
miogeoclinal rocks.
The southern Appalachians appear to show velocity
structures that are more like the Grenville models than
those of the northern Appalachians because of the lack of
the high velocity lower crustal layer (Long, 1979; Warren,
1968; Bollinger et al., 1980). This has very important
Table 3.1
Blast Locations and Origin Times Date Location
8/25/76 Keating Quarry 10/4/76
4/7/77 "
8/30/76 Benevento Sand & Gravel 5/3/77 Cook Concrete
6/17/77 East Barret, Vt. 1-91 roadcut blast 6/22/79 National Mines, Que.
6/27/79 John Mansville Mines, Que 8/1/79 Vermont Asbestoes 8/14/79 " Lat. 42,539 i i" 42.588 43.698 44.323 46.140 45.771 44.76 "o Lon 71. 71. 70. 72. g. O.T. 689 21:24:51.53 21:36:20.0 21:29:42.2 138 19:28:08.25 262 17:30:47.65 041 19:25:08.1 71.225 71,949 72.53 i 19:44:02.61 19:47:42.24 18:31:50.75 18:47:11.25
TABLE 3.2
Refraction Model From Timed Quarry Blasts
DEPTH (Km) 0. -- 22.1 22.1 - 44.6 Moho VP (Km/s) 6.0 7.1 8.1
Table 3.3
Travel Time Models Vo=6.4 km/s Appalachians # events Til Ti 2 Ti 3 ti t2 Xcl Xc 2 V1 . V2 V3
ZO
Zi
Z2 Ztotal data Std. Dev. P 128 0.1 2.9 6.9 22. 011.0 30.0 133.6+6.5 189.3+7.9 6.1 7.0 8.2 2.2 10.9±0.5 26.7±1.1 39.8 0.73 S 96 0.2 6.2 11.4 39. 4±1. 6 57.3 139.3±5.6 214. 4±9. 0 3.6 4.2 4.7 2.1 14.9±0.6 24.8±1.0 41.8 0.72 Grenville P 82 0.4 0.8 5.9 17. 6±6.1 34.2 112.4+40.0 223. 011.5 6.6 6.6 8.0 3.1 0.7±0.2 32.01.7 35.8 0.60 S 58 0.4 0.8 12.5 16. 8±4 .1 60.3 59.2±14.9 220.0±10.9 3.7 3.7 4.6 1.9 0.3±0.7 35.6±1.6 37.8 0.87Table 3. 4
Station Time Terms, Errors, and Number of Readings 71 events 343 readings
Relative Time Term
AGM APT BCT BML BNH CBM