HAL Id: inserm-02512089
https://www.hal.inserm.fr/inserm-02512089
Submitted on 19 Mar 2020
HAL is a multi-disciplinary open access
archive for the deposit and dissemination of
sci-entific research documents, whether they are
pub-lished or not. The documents may come from
teaching and research institutions in France or
abroad, or from public or private research centers.
L’archive ouverte pluridisciplinaire HAL, est
destinée au dépôt et à la diffusion de documents
scientifiques de niveau recherche, publiés ou non,
émanant des établissements d’enseignement et de
recherche français ou étrangers, des laboratoires
publics ou privés.
disease mice
Lucile Mégret, Satish Sasidharan Nair, Julia Dancourt, Jeff Aaronson, Jim
Rosinski, Christian Neri
To cite this version:
Lucile Mégret, Satish Sasidharan Nair, Julia Dancourt, Jeff Aaronson, Jim Rosinski, et al.. Combining
feature selection and shape analysis uncovers precise rules for miRNA regulation in Huntington’s
disease mice. BMC Bioinformatics, BioMed Central, 2020, 21 (1), pp.75.
�10.1186/s12859-020-3418-9�. �inserm-02512089�
R E S E A R C H A R T I C L E
Open Access
Combining feature selection and shape
analysis uncovers precise rules for miRNA
regulation in Huntington
’s disease mice
Lucile Mégret
1*, Satish Sasidharan Nair
1, Julia Dancourt
1, Jeff Aaronson
2, Jim Rosinski
2and Christian Neri
1*Abstract
Background: MicroRNA (miRNA) regulation is associated with several diseases, including neurodegenerative diseases. Several approaches can be used for modeling miRNA regulation. However, their precision may be limited for analyzing multidimensional data. Here, we addressed this question by integrating shape analysis and feature selection into miRAMINT, a methodology that we used for analyzing multidimensional RNA-seq and proteomic data from a knock-in mouse model (Hdh mice) of Huntington’s disease (HD), a disease caused by CAG repeat expansion in huntingtin (htt). This dataset covers 6 CAG repeat alleles and 3 age points in the striatum and cortex of Hdh mice.
Results: Remarkably, compared to previous analyzes of this multidimensional dataset, the miRAMINT approach retained only 31 explanatory striatal miRNA-mRNA pairs that are precisely associated with the shape of CAG repeat dependence over time, among which 5 pairs with a strong change of target expression levels. Several of these pairs were previously associated with neuronal homeostasis or HD pathogenesis, or both. Such miRNA-mRNA pairs were not detected in cortex.
Conclusions: These data suggest that miRNA regulation has a limited global role in HD while providing accurately-selected miRNA-target pairs to study how the brain may compute molecular responses to HD over time. These data also provide a methodological framework for researchers to explore how shape analysis can enhance
multidimensional data analytics in biology and disease.
Keywords: Machine learning, Multidimensional data, miRNA regulation, Shape analysis, Predictive accuracy, Biological precision
Background
Several neurodegenerative diseases (NDs) such as Alz-heimer’s disease, Parkinson’s disease, Amyotrophic lat-eral sclerosis and Huntington’s disease (HD) may evolve through gene deregulation, which has fostered a large number of studies aiming to explore the role of micro-RNA (mimicro-RNA) regulation in driving gene deregulation in these diseases [1–5]. MiRNAs are short (~ 21 nt) non-coding RNAs that regulate gene expression through the degradation or translational repression of mRNAs. Al-though miRNAs are believed to play a discrete as well as
global role in NDs such as HD [3, 6–8], the identifica-tion of miRNAs that on a system level could be central to ND pathogenesis remains challenging [3]. Part of this problem relates to the lack of rich data, e.g. time series data, or sufficiently homogeneous data, e.g. in tissues and subjects [1]. This problem also relates to the chal-lenges associated with accurately modeling miRNA data and mRNA data on a system level. To this end, several approaches predict miRNA targets based on binding sites, where the most commonly used features for pre-dicting miRNA targets include sequence complementar-ity between the“seed” region of a miRNA and the “seed match” region of a putative target mRNA, species con-servation, thermodynamic stability and site accessibility [9]. These methods can be classified in two categories. One category comprises heuristic methods [10] such as
© The Author(s). 2020 Open Access This article is distributed under the terms of the Creative Commons Attribution 4.0 International License (http://creativecommons.org/licenses/by/4.0/), which permits unrestricted use, distribution, and reproduction in any medium, provided you give appropriate credit to the original author(s) and the source, provide a link to the Creative Commons license, and indicate if changes were made. The Creative Commons Public Domain Dedication waiver (http://creativecommons.org/publicdomain/zero/1.0/) applies to the data made available in this article, unless otherwise stated. * Correspondence:lucile.megret@sorbonne-universite.fr;
christian.neri@inserm.fr
1Sorbonne Université, CNRS UMR8256, INSERM ERL U1164, Brain-C Lab, Paris,
France
for example TargetScan [11] and mirSVR [12]. However, the number of possible targets for a single miRNA can be large, greatly limiting biological precision. The other category comprises machine-learning techniques (e.g. decision trees, support vector machine and artificial neural networks) such as mirMark [9], TarPmiR [13], TargetMiner [14], TargetSpy [15] and MiRANN [16]. More sophisticated algorithms in this category of methods include deep learning methods such as for example Deep-MirTar [17]. Finally, this category also comprises com-binatorial ensemble approaches for improving the coverage and robustness of miRNA target prediction [18].
Besides predicting binding sites, another strategy for predicting miRNA targets is to search for negative corre-lations between miRNA and target expression levels. Such approaches include the use of Bayesian analysis such as GeneMiR++ [19]. However, optimal fitting be-tween miRNAs and putative targets upon Bayesian causal inference can be biased due to building a large and heterogenous network of causal interactions that in-volves miRNA-to-miRNA, target and target-to-miRNA interactions in addition to target-to-miRNA-target inter-actions [20]. To overcome this problem, Bayesian models may be filtered using external database informa-tion on miRNA binding sites [21]. However, filtering does not address the problem of miRNA effect sizes nor takes into account the possibility that miRNA-target inter-actions could be indirect eventhough there is evidence for a binding site in external databases. Expression-based ap-proaches also involve support vector machine analysis [22], Gaussian process regression model [23] and network inference such as weighted gene correlation network ana-lysis (WGCNA), the latter approach which has been used, for example, for modelling miRNA regulation in hepatitis C [24] and in HD knock-in mice (Hdh mice) [3].
Although network inference methods such as Bayesian analysis and WGCNA may provide insights into the fea-tures of miRNA regulation, they may be prone to aggrega-tion of a large number of hypotheses around strongly deregulated entities [3, 20], lacking discriminative power and biological precision, and impairing data prioritization. Here, we addressed this problem by developing an ap-proach in which network-based analysis for reducing data complexity is followed by robust random-forest (RF) ana-lysis for selecting explanatory variables (i.e. miRNAs best explaining targets, with aP-value computed for each pre-dictor variable and each prepre-dictor variable stable across RF iterations involving different seeds) and shape analysis (surface matching) for building discriminative and accur-ate ensembles of negatively correlaccur-ated miRNA-mRNA pairs. We used RF analysis for feature selection as this method does not make any prior hypothesis on the exist-ence of a relationship, whether direct or indirect, between a miRNA and a target. To select the most interesting
miRNAs, this analysis was supplemented with evidence for binding sites as instructed from multiple databases and followed by data prioritization using criteria such as CAG-repeat-length dependence and the fold change of target expression. We applied this approach to the analysis of multidimensional data in the allelic series HD knock-in mice (Hdh mice), currently the largest and more compre-hensive datasets (6 CAG-repeat lengths, three age points, several brain areas: miRNA, mRNA and proteomic data) to understand how miRNA regulation may work on a sys-tem level in neurodegenerative diseases [2]. We focused on the study of miRNA regulation mediated by mRNA degradation as the coverage and dynamics of proteomic data in the allelic series of Hdh mice is limited compared to miRNA and mRNA data. As developed below, we found that, on a global level, miRNA data explains a very small proportion of the CAG-repeat- and age-dependent dynamics of gene deregulation in the striatum (and none in cortex) of Hdh mice, retaining 31 miRNA-mRNA pairs implicated in neuronal activity and cellular homeostasis, among which only five pairs are of high interest.
Results
Multimodal selection of miRNA targets
To understand how the dynamics of miRNA regulation may work on a system level in the brain of Hdh mice, we applied miRNA regulation analysis via multimodal integration (miRAMINT), a pipeline in which novelty is to combine shape analysis with random forest analysis (Fig.1).
As a first step, we performed a signed WGCNA ana-lysis [26] of mRNA and miRNA expression profiles to reduce data complexity through building co-expression modules. The expression profiles of genes (respectively miRNA) in each cluster were summarized using the eigen-gene (respectively eigen-miRNA) [27]. We then se-lected the miRNA module(s) where the eigen-miRNAs are negatively correlated with the eigen-genes. This ana-lysis retained 8 miRNA co-expression modules and 18 target co-expression modules in the striatum and 4 miRNA expression modules and 14 gene co-expression modules in the cortex (Table S1, see http:// www.broca.inserm.fr/MiRAMINT/index.php for edge lists). Amongst all possible associations (144) between miRNA modules and target modules, 12 negative corre-lations between eigen-vectors (false discovery rate lower than 1%) were retained in the striatum and in the cortex (Table1).
We then tested whether the log fold change (LFC) for miRNA expression across the 15 CAG-repeat and age-dependent conditions tested in Hdh mice might explain target expression levels across these conditions. To this end, we applied RF analysis, which allows this question to be addressed in an unbiased manner (i.e. with no a
Fig. 1 MiRAMINT analysis of miRNA regulation. This protocol integrates network-based analysis for reduction of data complexity followed by (i) random forest (RF) analysis for selecting explanatory variables, with ap-value computed for each predictor variable using the Altmann’s approach [25] and this RF analysis iterated (which involves different seeds in each iteration) until the number of hypotheses is stable across consecutive iterations (see also Materials and Methods), (ii) surface-matching analysis for high precision in matching the miRNA and mRNA expression profiles across conditions (herein as defined by 6 CAG repeat alleles and 3 age points), (iii) evidence for binding sites and (iv) data prioritization for selecting predicted miRNA-mRNA pairs of high interest. The number of possible miRNA-mRNA pairs retained at each step of the analysis (outcome) of multidimensional data from the brain of Hdh mice is indicated. The miRNA-mRNA pairs retained upon shape-matching analysis can be visualized athttp://www.broca.inserm.fr/MiRAMINT/index.php. The whole approach, data prioritization included, retained 5 miRNA-mRNA pairs of high interest in the striatum of Hdh mice and none in the cortex
Table 1 Negative correlations (FDR < 0.01) between miRNA modules and mRNA modules in Hdh mice
Striatal data Cortical data
miRNA module Target module miRNA module Target module identity
a
ID#1 (N = 206) ID#2 (N = 40,131) ID#1 (N = 217) ID#1 (N = 7028)
ID#1 (N = 206) ID#7 (N = 108) ID#1 (N = 217) ID#3 (N = 325)
ID#1 (N = 206) ID#11 (N = 49) ID#1 (N = 217) ID#6 (N = 223)
ID#1 (N = 206) ID#15 (N = 41) ID#2 (N = 149) ID#11 (N = 66)
ID#1 (N = 206) ID#17 (N = 33) ID#3 (N = 87) ID#4 (N = 291)
ID#2 (N = 138) ID#18 (N = 27) ID#3 (N = 87) ID#8 (N = 170)
ID#3 (N = 104) ID#5 (N = 163) ID#3 (N = 87) ID#9 (N = 75)
ID#3 (N = 104) ID#6 (N = 160) ID#3 (N = 87) ID#10 (N = 74)
ID#3 (N = 104) ID#10 (N = 51) ID#4 (N = 82) ID#4 (N = 291)
ID#3 (N = 104) ID#11 (N = 49) ID#4 (N = 82) ID#8 (N = 170)
ID#4 (N = 63) ID#3 (N = 935) ID#4 (N = 82) ID#9 (N = 75)
ID#8 (N = 20) ID#2 (N = 40,131) ID#4 (N = 82) ID#10 (N = 74)
a
priori hypothesis on the existence of miRNA-target rela-tionships) and which has been successfully used to study miRNA regulation on a binding site level [28, 29]. To ensure a strong level of reliability, we applied a version of RF analysis in which aP-value (based on 100 permu-tations) is computed for each predictor variable using the Altmann’s approach [25] and in which each hypoth-esis on a predictor variable is stable across RF iterations involving different seeds (See Materials and Methods). This approach retained 3983 pairs (involving 141 ex-planatory miRNA variables and 350 dependent genes variables) in the striatum and 49 pairs (involving 16 ex-planatory miRNA variables and 3 dependent genes vari-ables) in the cortex (Table S2). Next, we tested whether the shape of the surface defined by the LFC values for explanatory miRNAs is negatively correlated with that defined by the LFC values for the corresponding targets (see Methods). Surface-matching retained 219/3983 rela-tionships in the striatum, and 23/49 relarela-tionships in the cortex (Table S2). Finally, in these latter groups of miRNA-target relationships, we retained those showing evidence for binding sites as indicated in the TargetScan [11], MicroCosm [30] and miRDB [31] databases, which generated a final number of 31 predictions (14 miRNAs explaining 20 targets) in the striatum and 9 predictions (6 miRNAs explaining 3 targets) in the cortex (TableS2). No overlap was found with miRTarBase, a database which contains experimentally-validated miRNA-mRNA pairs. Thus, remarkably, integrating shapes and random forests in miRAMINT selected quite a small number of miRNA-target pairs that show significant htt- and age-dependent features in the brain of Hdh mice.
Comparison to bona fide information contained in proteomic data
Gene and protein expression data from the same cells under similar conditions usually do not show a strong positive correlation [32–35]. As shown above, miRA-MINT is a selective data analysis work-flow in which a small number of htt- and time-dependent miRNA regu-lation events may be retained, thus reducing the expect-ation for changes in protein expression levels to be correlated with changes in corresponding open reading frames. Nonetheless, we assessed whether some of the dynamics of gene deregulation explained by the dynam-ics of miRNA expression in the brain of Hdh mice might be associated with comparable dynamic changes of pro-tein levels. To this end, we focused on the striatal miRNA-target pairs identified in the striatum as the brain area where gene deregulation is the strongest [2] and where miRNA levels are reliably associated with mRNA levels by miRAMINT, which represents 20 tar-gets (Table S2). We observed that 9/20 targets (45%) retained by miRAMINT have at least one corresponding
protein, from which only 3 targets (15%) were positively correlated with protein products across CAG repeat lengths and age points (Table S3). Although this overlap is limited, these observations provided bona fide infor-mation for data prioritization as developed below.
Data prioritization upon miRAMINT analysis
Although selective, data analysis in miRAMINT enables a diversity of profiles in terms of CAG-repeat dependence, age dependence and magnitude of effects across condi-tions to be retained. Several criteria may then be used for prioritizing the most interesting pairs, including (i) the overall shape of the gene deregulation plane (e.g. linear ef-fects, biphasic efef-fects, local effects) and the maximal amp-litude of gene deregulation at any point in the CAG repeat- and age-dependent plane, (ii) the strength of plane matching (i.e. the Spearman’s score for surface-matching), (iii) the number of databases concluding to a binding site between miRNA(s) and predicted target(s) and (iv), if available, positive correlations between changes in the ex-pression of proteins and of genes encoding these proteins.
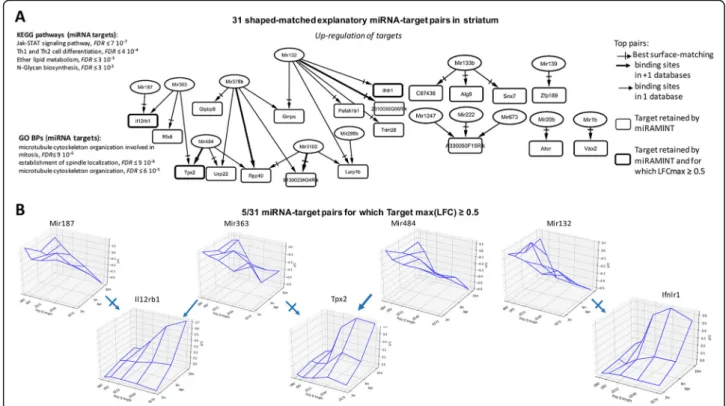
The analysis retained 31 miRNA-mRNA pairs in the striatum, among which 17 top pairs corresponding to ei-ther binding sites found in more than one miRNA target database or highest Spearman’s score for surface match-ing, or both (Fig. 2a), including 5 pairs for which from the maximally-achieved log fold change of target is greater than or equal to 0.5 (Fig.2b). Biological annota-tions suggested this group of miRNA-target pairs may be notably implicated in Jak-STAT signaling, Th1 and Th2 cell differentiation, ether lipid metabolism and N-glycan biosynthesis signaling pathway (Fig.2a).
In the cortex, miRAMINT retained 9 miRNA-target pairs that tend to show a biphasic (deregulation at 6 months, then return to initial level) age-dependent pro-file, including 6 miRNAs and 3 targets annotated for in-flammatory pathways (Tnfrs11a) such as NF-kappa B signaling, a pathway involved in neuronal apoptosis [36], and for cell genesis and death (protogenin, cadherin 9) (Fig. 3). However, deregulation in these miRNA-target pairs was not dependent on the CAG repeat lengths in a strongly consistent (linear effect) manner, contrasting with the consistency for CAG repeat dependence in the striatum (Fig. 2b). Additionally, raising the threshold on the log fold change of target expression to a value of 0.5 reduced the number of top predictions to 0 in the cor-tex. Thus, miRAMINT analysis indicated that no miRNA-target pairs are consistently and strongly deregulated in a CAG-repeat- and age-dependent man-ner in the cortex of Hdh mice.
Discussion
As multi-point data become available for modeling miRNA regulation [2], comprehensive approaches are
needed to build precise models of miRNA regulation of gene expression. Here, we addressed this problem by in-tegrating several machine learning concepts, each of them bringing complementary elements of information and reliability about the way that miRNA levels and tar-get levels may evolve across conditions. MiRAMINT analysis (Fig. 1) comprises WGCNA analysis for redu-cing data complexity, followed by (i) RF analysis for selecting explanatory variables, in which a p-value is computed for each predictor variable and in which RF analysis is iterated (involving different seeds) until the number of hypotheses is stable across consecutive itera-tions, (ii) shape analysis for matching the miRNA and mRNA expression profiles across conditions, (iii) evi-dence for binding sites and (iv) bona fide comparison of the gene targets retained into the model to protein ex-pression profiles.
Since the coverage and dynamics of proteomic data in the allelic series of Hdh mice are limited compared to those of miRNA and mRNA data, we focused our study on modeling miRNA regulation mediated by mRNA degradation. Depending on the features of input data layers, miRAMINT analysis may be used to analyze gene
expression repression mediated by mRNA degradation or inhibition of protein translation, or both.
Combining shape analysis and feature selection for negatively correlating miRNA and mRNA data suggests that miRNA regulation via mRNA degradation may have a limited global role in the striatum and cortex of Hdh mice. This conclusion is supported by the small number of miRNA-target relationships that show a consistent pattern (i.e. strong and linear effects) of expression in the surface defined by CAG-repeat lengths and age points in the striatum of these mice. This conclusion is reminiscent of a similar trend detected in the brain of wild-type mice, where miRNA regulation may be poorly correlated to gene expression signatures across cell types [37]. This conclusion is even more stringent for the cor-tex of Hdh mice, suggesting that miRNA regulation do not play a critical role in truly responding to HD in this brain area. In so far, our model significantly differs from a previous analysis [3] of the RNA-seq time series data in the allelic series of Hdh mice [2] in which global (eigenvalue-based) negative correlation between miRNAs and target modules (using WGCNA) was used to build a model of miRNA regulation. Although some of the
Fig. 2 Selected miRNA-target pairs in the striatum of Hdh mice. a Shown are the 31 miRAMINT miRNA-target pairs (see also TableS3for the full list of miRAMINT miRNA-target pairs in striatum). The targets are contained in rectangles and the miRNAs in ellipses. A thick edge means that evidence for binding sites is available from at least two miRNA databases. A thin edge means that evidence for binding sites is available from only one miRNA database. A thick rectangle means that the maximal LFC of the target is greater than 0.5. A cross arrow indicates the miRNA that is best paired with a target when this target has several possible miRNA regulators. Biological annotations of miRNA targets correspond to GO Biological processes or KEGG pathways at the result of STRING analyzes using stringent criteria (i.e. STRING score > 0.7, Databases and Experiments only, 20 neighbors added on the first shell) the KEGG pathways are those with, at least, 3 genes implied, the GO Biological processes are those with, at least, 5 genes implied. b Examples of 3D-graphs for top miRNA-target pairs (LFC amplitude of the target above 0.5)
miRNAs retained by miRAMINT analysis were also retained in this former study [3] (see Table S3: 12/14 miRNAs common to the two studies), miRAMINT miRNA-target pairs are in smaller numbers (before data prioritization: 31 miRAMINT predictions in striatum, instead of 7514 WGCNA predictions contained in 55 negative correlations between miRNA and target mod-ules in striatum; 9 miRAMINT predictions in cortex, in-stead of 186 WGCNA-based predictions contained in 9 negative correlations between miRNA and target mod-ules) and, importantly, except to one case (Mir132-Pafah1b1), they are associated with different targets. These differences are likely due to the higher accuracy associated with tree-based analysis combined with sur-face matching in miRAMINT compared to using a glo-bal (eigenvalue-based) negative correlation scheme between target modules and miRNAs [3].
A former bioinformatic analysis of miRNA expres-sion identified 33 possible miRNA-target relationships in post-mortem brain samples of HD patients com-pared to control individuals [38]. We found no over-lap between these predictions and the miRNA-target pairs retained by miRAMINT, which is expected as the study of post-mortem brain samples relied on a simple overlap analysis (based on binding sites in TargetScan) between lists of differentially expressed miRNAs and mRNAs [39] and as miRNA regulation in the humain brain could significantly differ from that in the mouse brain.
The lack of miRNA-target pairs that may truly func-tion in a CAG-repeat dependent manner in the cortex of Hdh mice is intriguing. Although some of the miRNAs retained in our analysis showed age- and CAG-repeat-dependent profiles, all nine miRNA-target pairs (involv-ing 3 targets) show a bi-phasic response with deregula-tion at 6 months of age and return to initial (2-month) expression levels at 10 months of age. Since miRNA regulation may be highly dependent on cellular context, we speculate this observation could relate to the large heterogeneity of neuronal populations in cortex, which could preclude a sufficiently sensitive analysis of HD and age-dependent miRNA regulation in whole cortex ex-tracts compared to whole striatum exex-tracts. Alterna-tively, this observation could relate to a strong level of miRNA-regulation reprogramming and impairment in the HD cortex, as further discussed below.
Although we cannot exclude the possibility that the conclusion about a limited global role of miRNA regula-tion in the brain of Hdh mice might be biased by the current lack of cell-type specific RNA-seq data in HD mice, our data highlight a new set of precisely matched and highly prioritized miRNA-target relationships (see Fig.2, TableS3) that are known to play a role in neuronal activity and homeostasis. This feature applies to miRNAs that are upregulated in the striatum of Hdh mice. Mir132 (upregulated and paired with 2310030G06Rik, the Guanine Monophosphate Synthase Gmps, Interferon Lambda Re-ceptor Ifnlr1, Ribonucleoprotein Domain Family Member
Fig. 3 Selected miRNA-target pairs in the cortex of Hdh mice. Shown are the 9 miRAMINT miRNA-target pairs (see also TableS3for the full list of miRAMINT miRNA-target pairs in cortex). The targets are contained in rectangles and the miRNAs in ellipses. A thick edge means that evidence for binding sites is available from at least two miRNA databases. A thin edge means that evidence for binding sites is available from only one miRNA database. All LFC are below 0.5. A cross arrow indicates the miRNA that is best paired with a target when this target has several possible miRNA regulators. Biological annotations of miRNA targets correspond to GO Biological processes or KEGG pathways at the result of STRING analyzes using stringent criteria (i.e. STRING score > 0.7, Databases and Experiments only, 5 neighbors added on the first shell) the KEGG pathways are those with, at
Larp1b, Platelet Activating Factor Acetylhydrolase 1b Regu-latory Subunit Pafah1b1 and Tripartite Motif-Containing ProteinTrim26) is associated to brain vascular integrity in zebrafish [37], spine density [39] and synaptogenesis [40]. Knocking down Mir1b (upregulated and paired with Ven-tral Anterior Homeobox 2, Vax2) significantly alleviated neuronal death induced by hypoxia [41]. miR139 (paired with the zinc finger protein 189 Zfp189) modulates cortical neuronal migration by targeting Lis1 in a rat model of focal cortical dysplasia [42]. Mir20b (paired with the Aryl-Hydrocarbon Receptor Repressor Ahrr) inhibits cerebral ischemia-induced inflammation in rats [43]. Exosomes harvested from Mir133b (paired with C87436, alpha-1,2-mannosyltransferase Alg9 and sorting nexin Snx7) overex-pressing mesenchymal stem cells may improve neural plas-ticity and functional recovery after stroke in the rat brain [44]. In addition, Mir133b may promote neurite outgrowth via targeting RhoA [45] and miR-133b may be critical for neural functional recovery after spinal cord injury and stroke in several organisms [46–48]. Mir187 (paired with the Interleukin 12 Receptor Subunit Beta Il12rb1) is associ-ated with the regulation of the potassium channel KCNK10/TREK-2 in a rat epilepsy model [49]. Finally, Mir363 is involved in neurite outgrowth enhanced by elec-trical stimulation in rats [50]. Target genes retained by MiRAMINT analysis in the striatum are also relevant to neuronal activity and homeostasis. Usp22 (targeted by Mir484 and Mir378b) was previsouly implicated in the maintenance of neural stem/progenitor cells via the regula-tion of Hes1 in the developing mouse brain [51]. Trim26 is related to DNA damage repair and cellular resistance to oxidative stress [52, 53]. In addition, neuroinformatic ana-lyses have linked Trim26 to neuropsychiatric disorders such as anxiety disorders, autistic spectrum disorders, bipolar disorder, major depressive disorder, and schizophrenia [54]. Tpx2 (targeted by Mir484 and Mir363), promotes acentro-somal microtubule nucleation in neurons [55] and regulates neuronal morphology through interaction with kinesin-5 [56]. During eye and brain neurogenesis, the Xvax2 protein was detected in proliferating neural progenitors and post-mitotic differentiating cells in ventral regions of both struc-tures in Xenopus embryos [57]. Snx7 has been related to Alzheimer’s disease pathogenesis through the reduction of amyloid-beta expression [58]. In addition, Snx7 may partici-pate in the control of glutamatergic and dopaminergic neurotransmission via the regulation of the kynurenine pathway, which is related to psychotic symptoms and cog-nitive impairment [59]. Finally, Pafah1b1 (targeted by Mir132), has been associated with the abnormal migration of cortical neurons and with neurologic disorder in mice and humans [60, 61]. In cortex, very few miRNA-target pairs were retained, and they involve target genes with low-amplitude fold change of expression. Nonetheless, it is in-teresting to note that some of the miRNA retained in the
cortex were associated with neuronal homeostasis. Mir10a (paired with the TNF receptor superfamily member Tnfrsf11a/RANK, involved in inflammatory response in the mouse [62], and with protogenin Prtg, involved in neuro-genesis and apoptosis [63, 64]) and Mir10b (paired with protogenin Prtg) are associated with the modulation of brain cell migration and aging [65,66]. MiRNA322 (paired with protogenin Prtg) is associated with apoptosis and Alz-heimer’s disease (AD) [67]. Finally, Mir100 (paired with cadherin Cdh9), is associated with neurological disorders such as AD, schizophrenia and autism [68–71].
Since miRAMINT finely accounts for the disease- and time-dependent features of miRNA and mRNA data in Hdh mice, miRAMINT miRNA-target pairs are strongly relevant to how cells and tissues may compute responses to HD on a miRNA regulation level. Amongst the 14 miRNAs retained by MiRAMINT analysis in the stri-atum (see Fig.2a), it is interesting to note that the levels of Mir222 (paired with A330050F15Rik) are increased in the plasma of HD patients and, however, were reported to be decreased in the striatum of transgenic 12-month-old YAC128 and 10-week-12-month-old R6/2 mice [72,73]. Here, our analysis puts forth the downregulation of Mir222 as an event that is highly CAG-repeat and age-dependent in Hdh mice and, therefore, that may be strongly rele-vant to the response of the mouse striatum to HD.
Conclusions
In summary, we addressed the problem of accurately modeling the dynamics of miRNA regulation from the analysis of multidimensional data. Our study puts forth the added value of combining shape analysis with feature selection for predictive accuracy and biological precision in modeling miRNA regulation from complex datasets, as illustrated by precise self-organised learning from multidimensional data obtained in the striatum and cor-tex of HD knock-in mice. MiRAMINT provides a con-venient framework for researchers to explore how combining shape analysis with feature selection can en-hance the analysis of multidimensional data in precisely modeling the interplay between layers of molecular regulation in biology and disease.
Methods
Source data
RNA-seq (mRNA and miRNA) data were obtained from the striatum and cortex of Hdh knock-in mice (allelic series Q20, Q80, Q92, Q111, Q140 and Q175 at 2 months, 6 months and 10 months of age) as previously reported [2]. The GEO IDs for transcriptome profiling data in Hdh mice are GSE65769 (Cortex, miRNAs), GSE65773 (Striatum, miRNAs), GSE65770 (Cortex, mRNAs) and GSE65774 (Striatum, mRNAs).
Conversion between gene symbols and Entrez identifiers
To identify genes, we used Entrez identifiers. To this end, we converted gene symbols to Entrez identifiers by using the Bioconductor package ( https://www.biocon-ductor.org/). Gene symbols that could be not mapped to a single Entrez ID were kept with the Entrez identifiers.
Removal of outliers in expression data
To remove outliers, we used variance stabilization to transform counts. Within each tissue and for each age-point, we constructed an Euclidean-distance sample net-work and removed those samples whose standardized inter-sample connectivity Z.k was below a threshold set to 2.5.
Differential expression analysis
mRNA and miRNA significant read-count data for eight individuals (four males and four females) as available in the RNA-seq data in the allelic series of Hdh mice was fed into Deseq2 implemented in the R package DESeq2 [24] in order to obtain a log-fold-change (LFC) vector for each condition (CAG-repeat length, age) and a vector indicating if the genes are up-regulated (LFC > 0 and p-value < 0.05), down-regulated (LFC < 0 and p-p-value < 0.05) or unchanged (p-value≥0) for each condition. The set age is k, and Q20 was used as reference for each con-dition at age k and Q > 20.
MiRAMINT analysis
To build an accurate model of miRNA regulation from the analysis of highly dimensional data such as the one available for the brain of Hdh mice [2], we developed miRAMINT, a pipeline that combines network-based, tree-based and shape-matching analysis into a single workflow (Fig.1) as detailed below.
Reduction of data complexity via network analysis
To reduce data complexity, we used WGCNA analysis. To this end, we used the R package WGCNA (https:// horvath.genetics.ucla.edu/html/CoexpressionNetwork/ Rpackages/WGCNA/). We applied standart settings as previously described [26] to generate signed WGCNA modules from RNA-seq (miRNA and mRNA separately) data in the allelic series of Hdh mice at 2 months, 6 months and 10 months of age, for striatum and cortex, by computing the correlation coefficient across the vari-ous CAG repeat lengths. Briefly, we constructed a matrix of pairwise correlations between all gene pairs across condidtions and samples. We removed all genes having less than two counts in all samples. We then constructed a“signed” pairwise gene co-expression similarity matrix and we raised the co-expression similarities to the power β = 6 to generate the network adjacency matrix. This procedure removes low correlations that may be due to
noise. We then computed consensus modules using maxBlockSize = 500, minModuleSize = 20 and merge-CutHeight = 0.15. The profile of the genes (respectively miRNA) in a module is summarized by the eigen-gene (respectively eigen-mir). To exclude the miRNA modules and mRNA modules that are not correlated, we then computed the Spearman’s score between each possible eigen-mir:eigen-gene pairs. Negative correlations with a false discovery rate lower than 1% using the Benjamini-Hochberg method (Benjamini Y, 1995) were considered statistically significant. This analysis allowed molecular entities that are not correlated at all to be filtered out, based on the lack of negative correlations between eigen-miRNAs and egen-genes.
Feature selection
To select the miRNAs that best explain the expression of target genes in the miRNA and mRNA space defined by the paired miRNA:mRNA WGCNA modules, we used RF analysis. Random forests are collections of deci-sion trees that are grown from a subset of the original data. This non parametric method has the advantage of dealing with non-linear effects and of being well-suited to the analysis of data in which the number of variable p is higher than the number of observation. Firstly, we re-moved the mRNA WGCNA nodes that show no signifi-cant deregulation across CAG-repeat lengths and age points. For each target, we then considered all miRNAs in the paired module(s) as possible explanatory variables of the target expression profile across conditions. Then, RF analysis implemented in the R package Ranger was performed by using the Altmann’s approach [27]. This approach has been initially proposed as heuristics in order to correct for the possible bias associated with the traditional measure of variable importance such as the Gini importance measure [27]. This approach has the advantage of using permutation to provides ap-value for the association of each miRNA with a potential target gene, reducing the risk that explanatory variables may be selected by chance. The first step of the Altmann’s ap-proach is to generate an importance score for all vari-ables. Then, the variable to be explained (mRNA) is randomly permutated. Permutation data are then used to grow new random forests and compute the scores for the predictor variables. Permutation were repeated 100 times (default parameter), thus generating 100 scores of importance for each miRNA variable that can be regarded as realizations from the unknown null distribu-tion. These 100 scores were used to compute a p-value for each predictor variable. If the classification error rate for a mRNA was higher than 10%, we rejected the possi-bility that this mRNA could be under miRNA regulation. When the error rate of classification was lower that 10%, we retained the miRNA(s) associated with mRNA(s)
with a p-value < 0.1. Finally, to further ensure the reli-ability of feature selection, the entire RF analysis, each round recruiting different starting seeds, was repeated until the pool of hypotheses at the intersection of all en-sembles of hypotheses generated by all RF iterations is stable. A pool of hypotheses was considered to be stable and RF iterations were stopped when greater than 80% of the hypotheses were conserved across 3 consecutive rounds of analysis. A stable pool of hypotheses was ob-tained for a range of 3–13 iterations (as illustrated in Fig.1).
Shape-matching
The LFCs of a miRNA and a mRNA across multiple conditions (herein as defined by 5 expanded CAG re-peat alleles and 3 age points) defines a surface that provides a strong basis for associating a miRNA with its putative target(s). To refine feature selection (see above), we computed the slope of each edge between two conditions. We then computed the Spearman’s score between the slopes for each gene and those for explanatory miRNA(s). Finally, we retained the miRNA-target pairs for which the Spearman’s score is negative and such that the false discovery rate is lower than 0.05 using the Benjamini-Hochberg method (Benjamini Y, 1995).
Comparison to proteomic data
Previous studies have shown that RNA-seq may validate proteomic data whereas few proteomic data may validate gene deregulation [2]. Nonetheless, we tested whether the deregulation of gene targets retained by MiRAMINT might be also observed at the protein level. To this end, we used the protein data as processed in the HdinHD database (https://www.hdinhd.org/). These data cover 6 CAG-repeat lengths across 3 age points, similarly to RNA-seq data. Briefly, the label-free quantification (LFQ) of the proteins was obtained as previously de-scribed [2]. We used the log10 ratio provided in the HDinHD database. This ratio compares the LFQ of the protein for a given CAG repeat length versus the LFQ at Q20 for each age. To test for correlation between the deregulation of the mRNA and the deregulation of the protein product, we computed the Spearman’s score be-tween the log-fold-change of the gene and the log10 ra-tio of the protein. For genes encoding more than one protein in the data-set, we tested for correlation with all protein products and we selected for the one showing the best Spearman’s score. Given the differences in the depthness and dynamics of these data compared to RNA-seq data, ap-value < 0.05 on the Spearman’s score was considered significant.
Supplementary information
Supplementary information accompanies this paper athttps://doi.org/10. 1186/s12859-020-3418-9.
Additional file 1: Table S1. Lists of nodes in miRNA and mRNA WGCNA modules. Module membership is indicated for mRNAs and miRNAs. NA, not applicable.
Additional file 2: Table S2. miRNA-target pairs retained by RF analysis. Thep-values are the ones provided by the Altmann’s RF algorithm [27]. This table shows the Spearman’s score for surface matching (see Methods) and LFC values on the targets for all miRNA-target pairs. Additional file 3: Table S3. Surface-matched miRNA-target pairs for which there is evidence for a binding site. This table shows the miR-target pairs for which (i) the Spearman’s score for plane matching is posi-tive and has a p-value < 0.01 upon Bonferroni correction for multiple test-ing and (ii) there is evidence for a bindtest-ing site as supported at least by one database including MicroCosm, TargetScan and miRDB. The LFC amplitude of the target is indicated (see Fig.2for pairs for which LFC amplitude of the target is above 0.8). The maximum LFC in absolute value of the targets. NA, not applicable.
Abbreviations
LFC:Log fold change; LFQ: Label-free quantification; RF: Random forest
Acknowledgments
We thank Benoit Perthame (Laboratoire Jacques-Louis Lions, Sorbonne Uni-versité) for discussions on mathematical modelling.
Authors’ contributions
Design of the study: LM, CN. Data acquisition, analysis and interpretation: LM, SSN, JD, JA, JR, CN. Drafting the manuscript: LM, CN. Conception of the study: CN. All authors read and approved the final manuscript.
Funding
This work was supported by Sorbonne Université, INSERM and CNRS, Paris, France and by the CHDI Foundation (grant number A-12273), Princeton, USA. The funding agencies had no role in study design, data analysis, deci-sion to publish, or preparation of the manuscript.
Availability of data and materials
The full list of WGCNA edges that define miRNA and mRNA expression either in the cortex or striatum and a 3D-visualization database of all miRNA-target pairs retained by miRAMINT analysis are available athttp://www.broca. inserm.fr/MiRAMINT/index.php. The source code developed for running miR-AMINT, written using R, is availablehttp://www.broca.inserm.fr/MiRAMINT/ index.php.
Ethics approval and consent to participate Not applicable.
Consent for publication Not applicable.
Competing interests
The authors declare that they have no competing interests.
Author details
1Sorbonne Université, CNRS UMR8256, INSERM ERL U1164, Brain-C Lab, Paris,
France.2CHDI Foundation, Princeton, NJ, USA.
Received: 29 January 2020 Accepted: 17 February 2020
References
1. Dardiotis E, Aloizou AM, Siokas V, Patrinos GP, Deretzi G, Mitsias P, Aschner M, Tsatsakis A. The role of MicroRNAs in patients with amyotrophic lateral sclerosis. J Mol Neurosci. 2018.
2. Langfelder P, Cantle JP, Chatzopoulou D, Wang N, Gao F, Al-Ramahi I, Lu XH, Ramos EM, El-Zein K, Zhao Y, et al. Integrated genomics and proteomics
define huntingtin CAG length-dependent networks in mice. Nat Neurosci. 2016;19(4):623–33.
3. Langfelder P, Gao F, Wang N, Howland D, Kwak S, Vogt TF, Aaronson JS, Rosinski J, Coppola G, Horvath S, et al. MicroRNA signatures of endogenous Huntingtin CAG repeat expansion in mice. PLoS One. 2018;13(1):e0190550. 4. Pichler S, Gu W, Hartl D, Gasparoni G, Leidinger P, Keller A, Meese E,
Mayhaus M, Hampel H, Riemenschneider M. The miRNome of Alzheimer's disease: consistent downregulation of the miR-132/212 cluster. Neurobiol Aging. 2017;50:167 e161–167 e110.
5. Ham S, Kim TK, Lee S, Tang YP, Im HI. MicroRNA profiling in aging brain of PSEN1/PSEN2 double knockout mice. Mol Neurobiol. 2018;55(6):5232–42. 6. Johnson R, Zuccato C, Belyaev ND, Guest DJ, Cattaneo E, Buckley NJ. A
microRNA-based gene dysregulation pathway in Huntington's disease. Neurobiol Dis. 2008;29(3):438–45.
7. Packer AN, Xing Y, Harper SQ, Jones L, Davidson BL. The bifunctional microRNA miR-9/miR-9* regulates REST and CoREST and is downregulated in Huntington's disease. J Neurosci. 2008;28(53):14341–6.
8. Jovicic A, Zaldivar Jolissaint JF, Moser R, Silva Santos MF, Luthi-Carter R. MicroRNA-22 (miR-22) overexpression is neuroprotective via general anti-apoptotic effects and may also target specific Huntington's disease-related mechanisms. PLoS One. 2013;8(1):e54222.
9. Menor M, Ching T, Zhu X, Garmire D, Garmire LX. mirMark: a site-level and UTR-level classifier for miRNA target prediction. Genome Biol. 2014;15(10): 500.
10. Fan X, Kurgan L. Comprehensive overview and assessment of
computational prediction of microRNA targets in animals. Brief Bioinform. 2015;16(5):780–94.
11. Lewis BP, Burge CB, Bartel DP. Conserved seed pairing, often flanked by adenosines, indicates that thousands of human genes are microRNA targets. Cell. 2005;120(1):15–20.
12. Betel D, Koppal A, Agius P, Sander C, Leslie C. Comprehensive modeling of microRNA targets predicts functional non-conserved and non-canonical sites. Genome Biol. 2010;11(8):R90.
13. Ding J, Li X, Hu H. TarPmiR: a new approach for microRNA target site prediction. Bioinformatics. 2016;32(18):2768–75.
14. Bandyopadhyay S, Mitra R. TargetMiner: microRNA target prediction with systematic identification of tissue-specific negative examples. Bioinformatics. 2009;25(20):2625–31.
15. Sturm M, Hackenberg M, Langenberger D, Frishman D. TargetSpy: a supervised machine learning approach for microRNA target prediction. BMC Bioinformatics. 2010;11:292.
16. Rahman ME, Islam R, Islam S, Mondal SI, Amin MR. MiRANN: a reliable approach for improved classification of precursor microRNA using artificial neural network model. Genomics. 2012;99(4):189–94.
17. Wen M, Cong P, Zhang Z, Lu H, Li T. DeepMirTar: a deep-learning approach for predicting human miRNA targets. Bioinformatics. 2018;34(22):3781–7. 18. Davis JA, Saunders SJ, Mann M, Backofen R. Combinatorial ensemble miRNA
target prediction of co-regulation networks with non-prediction data. Nucleic Acids Res. 2017;45(15):8745–57.
19. Huang JC, Morris QD, Frey BJ. Bayesian inference of MicroRNA targets from sequence and expression data. J Comput Biol. 2007;14(5):550–63. 20. Le TD, Liu L, Tsykin A, Goodall GJ, Liu B, Sun BY, Li J. Inferring
microRNA-mRNA causal regulatory relationships from expression data. Bioinformatics. 2013;29(6):765–71.
21. Zhang J, Le TD, Liu L, Liu B, He J, Goodall GJ, Li J. Identifying direct miRNA-mRNA causal regulatory relationships in heterogeneous data. J Biomed Inform. 2014;52:438–47.
22. Ovando-Vazquez C, Lepe-Soltero D, Abreu-Goodger C. Improving microRNA target prediction with gene expression profiles. BMC Genomics. 2016;17:364. 23. Kang H, Ahn H, Jo K, Oh M, Kim S. mirTime: identifying condition-specific
targets of MicroRNA in time-series transcript data using Gaussian process model and spherical vector clustering. Bioinformatics. 2019.
24. Peng X, Li Y, Walters KA, Rosenzweig ER, Lederer SL, Aicher LD, Proll S, Katze MG. Computational identification of hepatitis C virus associated microRNA-mRNA regulatory modules in human livers. BMC Genomics. 2009;10:373. 25. Altmann A, Tolosi L, Sander O, Lengauer T. Permutation importance: a
corrected feature importance measure. Bioinformatics. 2010;26(10):1340–7. 26. Langfelder P, Horvath S. Eigengene networks for studying the relationships
between co-expression modules. BMC Syst Biol. 2007;1:54.
27. Horvath S, Dong J. Geometric interpretation of gene coexpression network analysis. PLoS Comput Biol. 2008;4(8):e1000117.
28. Van Peer G, De Paepe A, Stock M, Anckaert J, Volders PJ, Vandesompele J, De Baets B, Waegeman W. miSTAR: miRNA target prediction through modeling quantitative and qualitative miRNA binding site information in a stacked model structure. Nucleic Acids Res. 2017;45(7):e51.
29. Mendoza MR, da Fonseca GC, Loss-Morais G, Alves R, Margis R, Bazzan AL. RFMirTarget: predicting human microRNA target genes with a random forest classifier. PLoS One. 2013;8(7):e70153.
30. Griffiths-Jones S, Saini HK, van Dongen S, Enright AJ. miRBase: tools for microRNA genomics. Nucleic Acids Res. 2008;36(Database issue):D154–8. 31. Wong N, Wang X. miRDB: an online resource for microRNA target
prediction and functional annotations. Nucleic Acids Res. 2015;43(Database issue):D146–52.
32. Haider S, Pal R. Integrated analysis of transcriptomic and proteomic data. Curr Genomics. 2013;14(2):91–110.
33. Chen G, Gharib TG, Huang CC, Taylor JM, Misek DE, Kardia SL, Giordano TJ, Iannettoni MD, Orringer MB, Hanash SM, et al. Discordant protein and mRNA expression in lung adenocarcinomas. Mol Cell Proteomics. 2002;1(4): 304–13.
34. Pascal LE, True LD, Campbell DS, Deutsch EW, Risk M, Coleman IM, Eichner LJ, Nelson PS, Liu AY. Correlation of mRNA and protein levels: cell type-specific gene expression of cluster designation antigens in the prostate. BMC Genomics. 2008;9:246.
35. Ghazalpour A, Bennett B, Petyuk VA, Orozco L, Hagopian R, Mungrue IN, Farber CR, Sinsheimer J, Kang HM, Furlotte N, et al. Comparative analysis of proteome and transcriptome variation in mouse. PLoS Genet. 2011;7(6): e1001393.
36. Yan L, Zhu T. Effects of rosuvastatin on neuronal apoptosis in cerebral ischemic stroke rats via Sirt1/NF-kappa B signaling pathway. Eur Rev Med Pharmacol Sci. 2019;23(12):5449–55.
37. Xu B, Zhang Y, Du XF, Li J, Zi HX, Bu JW, Yan Y, Han H, Du JL. Neurons secrete miR-132-containing exosomes to regulate brain vascular integrity. Cell Res. 2017;27(7):882–97.
38. Dong X, Cong S. Bioinformatic analysis of microRNA expression in Huntington's disease. Mol Med Rep. 2018;18(3):2857–65.
39. Hansen KF, Sakamoto K, Wayman GA, Impey S, Obrietan K. Transgenic miR132 alters neuronal spine density and impairs novel object recognition memory. PLoS One. 2010;5(11):e15497.
40. Lesiak A, Zhu M, Chen H, Appleyard SM, Impey S, Lein PJ, Wayman GA. The environmental neurotoxicant PCB 95 promotes synaptogenesis via ryanodine receptor-dependent miR132 upregulation. J Neurosci. 2014;34(3):717–25. 41. Chang CY, Lui TN, Lin JW, Lin YL, Hsing CH, Wang JJ, Chen RM. Roles of
microRNA-1 in hypoxia-induced apoptotic insults to neuronal cells. Arch Toxicol. 2016;90(1):191–202.
42. Huang Y, Jiang J, Zheng G, Chen J, Lu H, Guo H, Wu C. miR-139-5p modulates cortical neuronal migration by targeting Lis1 in a rat model of focal cortical dysplasia. Int J Mol Med. 2014;33(6):1407–14.
43. Zhao J, Wang H, Dong L, Sun S, Li L. miRNA-20b inhibits cerebral ischemia-induced inflammation through targeting NLRP3. Int J Mol Med. 2019;43(3): 1167–78.
44. Xin H, Wang F, Li Y, Lu QE, Cheung WL, Zhang Y, Zhang ZG, Chopp M. Secondary release of Exosomes from astrocytes contributes to the increase in neural plasticity and improvement of functional recovery after stroke in rats treated with Exosomes harvested from MicroRNA 133b-overexpressing multipotent Mesenchymal stromal cells. Cell Transplant. 2017;26(2):243–57. 45. Lu XC, Zheng JY, Tang LJ, Huang BS, Li K, Tao Y, Yu W, Zhu RL, Li S, Li LX.
MiR-133b promotes neurite outgrowth by targeting RhoA expression. Cell Physiol Biochem. 2015;35(1):246–58.
46. Liu NK, Wang XF, Lu QB, Xu XM. Altered microRNA expression following traumatic spinal cord injury. Exp Neurol. 2009;219(2):424–9.
47. Yu YM, Gibbs KM, Davila J, Campbell N, Sung S, Todorova TI, Otsuka S, Sabaawy HE, Hart RP, Schachner M. MicroRNA miR-133b is essential for functional recovery after spinal cord injury in adult zebrafish. Eur J Neurosci. 2011;33(9):1587–97.
48. Xin H, Li Y, Liu Z, Wang X, Shang X, Cui Y, Zhang ZG, Chopp M. MiR-133b promotes neural plasticity and functional recovery after treatment of stroke with multipotent mesenchymal stromal cells in rats via transfer of exosome-enriched extracellular particles. Stem Cells. 2013;31(12):2737–46.
49. Haenisch S, von Ruden EL, Wahmkow H, Rettenbeck ML, Michler C, Russmann V, Bruckmueller H, Waetzig V, Cascorbi I, Potschka H. miRNA-187-3p-mediated regulation of the KCNK10/TREK-2 Potassium Channel in a rat epilepsy model. ACS Chem Neurosci. 2016;7(11):1585–94.
50. Quan X, Huang L, Yang Y, Ma T, Liu Z, Ge J, Huang J, Luo Z. Potential mechanism of Neurite outgrowth enhanced by electrical stimulation: involvement of MicroRNA-363-5p targeting DCLK1 expression in rat. Neurochem Res. 2017;42(2):513–25.
51. Kobayashi T, Iwamoto Y, Takashima K, Isomura A, Kosodo Y, Kawakami K, Nishioka T, Kaibuchi K, Kageyama R. Deubiquitinating enzymes regulate Hes1 stability and neuronal differentiation. FEBS J. 2015;282(13):2411–23. 52. Williams SC, Parsons JL. NTH1 Is a New Target for Ubiquitylation-Dependent
Regulation by TRIM26 Required for the Cellular Response to Oxidative Stress. Mol Cell Biol. 2018;38(12):e00616–17.
53. Edmonds MJ, Carter RJ, Nickson CM, Williams SC, Parsons JL. Ubiquitylation-dependent regulation of NEIL1 by mule and TRIM26 is required for the cellular DNA damage response. Nucleic Acids Res. 2017;45(2):726–38. 54. Lotan A, Fenckova M, Bralten J, Alttoa A, Dixson L, Williams RW, van der
Voet M. Neuroinformatic analyses of common and distinct genetic components associated with major neuropsychiatric disorders. Front Neurosci. 2014;8:331.
55. Chen WS, Chen YJ, Huang YA, Hsieh BY, Chiu HC, Kao PY, Chao CY, Hwang E. Ran-dependent TPX2 activation promotes acentrosomal microtubule nucleation in neurons. Sci Rep. 2017;7:42297.
56. Kahn OI, Ha N, Baird MA, Davidson MW, Baas PW. TPX2 regulates neuronal morphology through kinesin-5 interaction. Cytoskeleton (Hoboken). 2015; 72(7):340–8.
57. Liu M, Liu Y, Liu Y, Lupo G, Lan L, Barsacchi G, He R. A role for Xvax2 in controlling proliferation of Xenopus ventral eye and brain progenitors. Dev Dyn. 2008;237(11):3387–93.
58. Xu S, Zhang L, Brodin L. Overexpression of SNX7 reduces Abeta production by enhancing lysosomal degradation of APP. Biochem Biophys Res Commun. 2018;495(1):12–9.
59. Erhardt S, Schwieler L, Imbeault S, Engberg G. The kynurenine pathway in schizophrenia and bipolar disorder. Neuropharmacology. 2017;112(Pt B): 297–306.
60. Katayama KI, Hayashi K, Inoue S, Sakaguchi K, Nakajima K. Enhanced expression of Pafah1b1 causes over-migration of cerebral cortical neurons into the marginal zone. Brain Struct Funct. 2017;222(9):4283–91. 61. Dinday MT, Girskis KM, Lee S, Baraban SC, Hunt RF. PAFAH1B1
haploinsufficiency disrupts GABA neurons and synaptic E/I balance in the dentate gyrus. Sci Rep. 2017;7(1):8269.
62. Shimamura M, Nakagami H, Osako MK, Kurinami H, Koriyama H, Zhengda P, Tomioka H, Tenma A, Wakayama K, Morishita R. OPG/RANKL/RANK axis is a critical inflammatory signaling system in ischemic brain in mice. Proc Natl Acad Sci U S A. 2014;111(22):8191–6.
63. Wang YC, Juan HC, Wong YH, Kuo WC, Lu YL, Lin SF, Lu CJ, Fann MJ. Protogenin prevents premature apoptosis of rostral cephalic neural crest cells by activating the alpha5beta1-integrin. Cell Death Dis. 2013;4:e651. 64. Wong YH, Lu AC, Wang YC, Cheng HC, Chang C, Chen PH, Yu JY, Fann MJ. Protogenin defines a transition stage during embryonic neurogenesis and prevents precocious neuronal differentiation. J Neurosci. 2010;30(12):4428–39. 65. Hohensinner PJ, Kaun C, Ebenbauer B, Hackl M, Demyanets S, Richter D,
Prager M, Wojta J, Rega-Kaun G. Reduction of premature aging markers after gastric bypass surgery in morbidly obese patients. Obes Surg. 2018; 28(9):2804–10.
66. Liu S, Sun J, Lan Q. TGF-beta-induced miR10a/b expression promotes human glioma cell migration by targeting PTEN. Mol Med Rep. 2013;8(6): 1741–6.
67. Ma X, Shang F, Zhang Q, Lin Q, Han S, Shan Y, Du J, Ling F, Zhang H, Xu G. MicroRNA-322 attenuates aluminum maltolate-induced apoptosis in the human SH-SY5Y neuroblastoma cell line. Mol Med Rep. 2017;16(2):2199–204. 68. Ge X, Zhang Y, Zuo Y, Israr M, Li B, Yu P, Gao G, Chang YZ, Shi Z.
Transcriptomic analysis reveals the molecular mechanism of Alzheimer-related neuropathology induced by sevoflurane in mice. J Cell Biochem. 2019;570(7761):332–337.
69. Wang C, Pan YH, Wang Y, Blatt G, Yuan XB. Segregated expressions of autism risk genes Cdh11 and Cdh9 in autism-relevant regions of developing cerebellum. Mol Brain. 2019;12(1):40.
70. Duan X, Krishnaswamy A, Laboulaye MA, Liu J, Peng YR, Yamagata M, Toma K, Sanes JR. Cadherin combinations recruit dendrites of distinct retinal neurons to a shared Interneuronal scaffold. Neuron. 2018;99(6):1145–54 e1146.
71. Chen X, Long F, Cai B, Chen X, Chen G. A novel relationship for schizophrenia, bipolar and major depressive disorder part 5: a hint from
chromosome 5 high density association screen. Am J Transl Res. 2017;9(5): 2473–91.
72. Diez-Planelles C, Sanchez-Lozano P, Crespo MC, Gil-Zamorano J, Ribacoba R, Gonzalez N, Suarez E, Martinez-Descals A, Martinez-Camblor P, Alvarez V, et al. Circulating microRNAs in Huntington's disease: emerging mediators in metabolic impairment. Pharmacol Res. 2016;108:102–10.
73. Lee ST, Chu K, Im WS, Yoon HJ, Im JY, Park JE, Park KH, Jung KH, Lee SK, Kim M, et al. Altered microRNA regulation in Huntington's disease models. Exp Neurol. 2011;227(1):172–9.
Publisher’s Note
Springer Nature remains neutral with regard to jurisdictional claims in published maps and institutional affiliations.