HAL Id: hal-02165952
https://hal.sorbonne-universite.fr/hal-02165952
Submitted on 26 Jun 2019
HAL is a multi-disciplinary open access
archive for the deposit and dissemination of
sci-entific research documents, whether they are
pub-lished or not. The documents may come from
teaching and research institutions in France or
abroad, or from public or private research centers.
L’archive ouverte pluridisciplinaire HAL, est
destinée au dépôt et à la diffusion de documents
scientifiques de niveau recherche, publiés ou non,
émanant des établissements d’enseignement et de
recherche français ou étrangers, des laboratoires
publics ou privés.
stranger’s voice recruit faster implicit processes than
self-produced expressions
Laura Rachman, Stéphanie Dubal, Jean-Julien Aucouturier
To cite this version:
Laura Rachman, Stéphanie Dubal, Jean-Julien Aucouturier. Happy you, happy me: expressive changes
on a stranger’s voice recruit faster implicit processes than self-produced expressions. Social Cognitive
and Affective Neuroscience, Oxford University Press (OUP), 2019, 14 (5), pp.559 - 568.
�10.1093/so-cafn/nsz030�. �hal-02165952�
Received: 5 March 2018; Revised: 9 April 2019; Accepted: 21 April 2019
© The Author(s) 2019. Published by Oxford University Press.
This is an Open Access article distributed under the terms of the Creative Commons Attribution NonCommercial-NoDerivs licence (http:// creativecommons.org/licenses/by-nc-nd/4.0/), which permits non-commercial reproduction and distribution of the work, in any medium, provided the original work is not altered or transformed in any way, and that the work properly cited. For commercial re-use, please contact jour-nals.permissions@oup.com
559 Social Cognitive and Affective Neuroscience, 2019, 559–568 doi: 10.1093/socafn/nsz030
Advance Access Publication Date: 1 May 2019 Original article
Happy you, happy me: expressive changes on a
stranger’s voice recruit faster implicit processes than
self-produced expressions
Laura Rachman,
1,2
Stéphanie Dubal,
1
and Jean-Julien Aucouturier
2
1
Inserm U 1127, CNRS UMR 7225, Sorbonne Université UMR S 1127, Institut du Cerveau et de la Moelle épinière,
Social and Affective Neuroscience Lab, Paris, 75013, France and
2Science & Technology of Music and Sound,
UMR 9912 (CNRS/IRCAM/Sorbonne Université), Paris, 75004, France
Correspondence should be addressed to Laura Rachman, Science & Technology of Music and Sound, UMR 9912 (CNRS/IRCAM/Sorbonne Université), Paris, 75004, France. Email: rachman.laura@gmail.com.
Abstract
In social interactions, people have to pay attention both to the ‘what’ and ‘who’. In particular, expressive changes heard on speech signals have to be integrated with speaker identity, differentiating e.g. self- and other-produced signals. While previous research has shown that self-related visual information processing is facilitated compared to non-self stimuli, evidence in the auditory modality remains mixed. Here, we compared electroencephalography (EEG) responses to expressive changes in sequence of self- or other-produced speech sounds using a mismatch negativity (MMN) passive oddball
paradigm. Critically, to control for speaker differences, we used programmable acoustic transformations to create voice deviants that differed from standards in exactly the same manner, making EEG responses to such deviations comparable between sequences. Our results indicate that expressive changes on a stranger’s voice are highly prioritized in auditory processing compared to identical changes on the self-voice. Other-voice deviants generate earlier MMN onset responses and involve stronger cortical activations in a left motor and somatosensory network suggestive of an increased recruitment of resources for less internally predictable, and therefore perhaps more socially relevant, signals.
Key words: event-related potentials; mismatch negativity; self-voice; other-voice; algorithmic voice transformations
Introduction
In social interactions, people have to process continuous changes not only in the vocal and facial expressions of their interlocutors but also in the feedback from their own facial and vocal expressions. There is a long-ranging debate in the social-cognitive and meta-social-cognitive communities (James, 1884;Frith, 2012) about the mechanistic primacy of both types of inputs; on the one hand, the social-cognitive interpretation of other agents is believed to mobilize simulation mechanisms that
supplement the processing of exteroceptive input (Gallese et al., 2004;Niedenthal, 2007). On the other hand, vocal (Aucouturier et al., 2016) and facial feedback (Laird and Lacasse, 2014, but see alsoWagenmakers et al., 2016) paradigms suggest that meta-cognitive evaluations of e.g. one’s own emotional state are influenced by proprioceptive inputs (the sound of our voice, the motor pattern of our face) that are processed ‘as if’ they were external stimuli. In the voice domain in particular, the question remains whether there are fundamental mechanistic differences between e.g. hearing one’s own voice suddenly
change its pitch to sound brighter and happier and processing the exact same cues on the voice of a conversation partner.
Electrophysiological indices of self- and other-stimulus processing have provided mixed evidence to this question. Various studies show converging evidence that self-related visual stimuli are prioritized in the brain (Apps and Tsakiris, 2014). For instance, images of the self-face elicit faster responses and recruit greater attentional resources than representations of another person (Tacikowski and Nowicka, 2010; Pannese and Hirsch, 2011; Sel et al., 2016). However, self-generated auditory stimuli do not necessarily show the same pattern; while participants’ own voice evoked larger N2 and P3 when compared to a stranger’s voice in an active detection task (Conde et al., 2015), Graux and colleagues found that participants’ own voice evoked a smaller P3a amplitude than the voice of a stranger or a familiar other when using passive oddball paradigms (Graux et al., 2013,2015).
Critically, these previous studies have used designs in which self- and other-stimuli are alternated. While such a contrast sheds light on the relative saliency of self-voice (SV) deviants in a context of other-voices (OVs) standards, it does not address the question of whether we process expressive changes in our own voice (i.e. SV deviants in a sequence of SV standards) in the same way as in the voice of others (i.e. OV deviants in a sequence of OV standards).
On the one hand, the processing of expressive changes in a sequence of SVs may be facilitated because the SV is a familiar signal. Visual paradigms have consistently shown that deviants among familiar letters or shapes elicit faster mismatch responses (e.g. Sulykos et al., 2015), and similar results were found contrasting deviants in culturally familiar sounds (e.g. the Microsoft Windows chime) with deviants in sequences of the same sounds played backwards (Jacobsen et al., 2005). An SV advantage would also be consistent with results documenting facilitating effects of language or speaker familiarity on phonological and semantic processing (Chen et al., 2014a;Fleming et al., 2014).
On the other hand, the processing of expressive cues in a sequence of OVs may be facilitated because the OV is less predictable, more socially relevant and thus warrants more/-faster reorientation of attention than self-stimuli. There are known effects of social relevance on mismatch responses in the visual and auditory modalities, notably when manipulat-ing the communicative nature of the signals; in sequences of emotional face stimuli, Campanella and colleagues (2002) found earlier and larger mismatch responses to changes of expressions that led to a different emotional appraisal (e.g. a happy face in a sequence of sad faces) than to a different depiction of the same emotion (see alsoBayer et al., 2017;Kovarski et al., 2017). In the auditory domain, affiliative signals such as laughter evoke larger mismatch negativity (MMN) than a non-affiliative growl (e.g.Pinheiro et al., 2017b), vowels expressing fear evoke both an earlier and larger MMN response than expressions of happiness and sadness (Carminati et al., 2018) and changes of the same intensity elicit larger MMNs on vocal than nonvocal stimuli (Schirmer et al., 2005), all of which can be interpreted as an effect of social relevance. Finally, not only the auditory stimulus itself but also the context in which it is presented seems to affect preattentive change detection processes. In an oddball paradigm using both intensity and frequency deviants of pure tones,Pinheiro et al.(2017a) reported a smaller MMN in response to deviants presented when participants looked at negative images compared to both positive and neutral images. Similarly, MMN responses to happy two-syllable deviants have
shorter peak latencies when participants receive fear-reducing testosterone rather than placebo (Chen et al., 2014b). Even non-vocal tones modulated in F0 and F0 variation to match non-vocal expressions of affect are sufficient to evoke MMNs (Leitman et al., 2011).
One technical obstacle to comparing mismatch responses to expressive deviants in SV and OV sequences, however, is the need to control for similar changes to occur in both contexts. When relying on participant voices, it is always possible that one speaker expresses a given emotional or expressive change more clearly or loudly than another speaker (Jürgens et al., 2015), or with different cues (e.g. louder vs higher pitch), such that any difference observed in processing such changes cannot be unambiguously attributed to self/other processing differences rather than individual production differences.
To make such sequences amenable to an MMN paradigm, we used a novel voice-transformation software tool (DAVID,
Rachman et al., 2018) in order to create voice deviants which, while being recognized as authentic expressive changes for both types of speaker, utilize ‘exactly’ the same cues in ‘exactly’ the same manner (e.g. a 50 cent pitch increase on the second syllable of the word) in both contexts. Previous studies using DAVID have demonstrated that transformed voices are perceived as natural expressions and in emotional contexts create the same explicit and implicit reactions as authentic emotional expres-sions (Aucouturier et al., 2016). In the present study, we used DAVID to apply identical expressive changes to both SV and OV stimuli and used an event-related potential MMN paradigm to examine whether the processing of these controlled changes is affected by speaker identity.
Methods
Participants
A total of 25 healthy, right-handed female participants took part in this study [27 came in for voice recordings, but 2 were not able to do the electroencephalography (EEG) session], 2 of which were excluded from analysis due to excessive EEG artifacts in the EEG, leaving 23 participants in the final analysis (mean age = 21.2, s.d. = 1.8 years).
An additional 20 right-handed female participants took part in a follow-up behavioral study comprising a catego-rization task of the expressive changes. One participant was excluded because of missing data due to technical problems, leaving 19 participants in the final analysis (mean age = 21.4, s.d. = 2.1 years). Participants in this second group did not partake in the EEG experiment.
For both studies, we selected only female participants because the voice transformations we used worked more reliably for female than for deep, lower pitch male voices (Rachman et al., 2018). The experimental protocol was approved by Institut Européen d’Administration des Affaires (INSEAD)’s Institutional Review Board, and all participants gave written informed consent before the start of the study. Participants reported normal or corrected to normal vision, normal hearing and an absence of neurological or psychiatric illness. They were financially compensated for their participation.
Stimuli
Participants came to the lab 1 week prior to the EEG experiment for a voice recording session. The recordings took place in a sound-attenuated booth, using a headset microphone (DPA d:fine 4066), an external sound card (RME UCX Fireface,
L. Rachman et al. 561
Table 1. Deviant parameter values
Happy Sad Pitch shift, cents +50 -70 Inflection duration, ms 500 – min., cents -200 – max., cents +140 – Shelf filter cut-off, Hz >8000 <8000 slope, dB/octave +9.5 -12
Parameter values of the happy and sad transformations used in this study [refer toRachman et al. (2018)for details].
Germany) and Garage-Band software (Apple Inc., Cupertino, California, USA) with a 44.1 kHz sampling rate and 16-bit resolu-tion. Participants were asked to read a list of 20 disyllabic neutral words and 6 disyllabic pseudo-words with a neutral intonation (Supplementary Table S1). All sounds were normalized at 70 dBA using a Matlab (Natick, Massachusetts, USA) toolbox (Pampalk, 2004). Because only the recordings of the pseudoword /ba-ba/ were used during the EEG session, these sound files were also normalized in time to have a duration of 550 ms using superVP/audiosculpt software. To ensure comparable amounts of vocal diversity in ‘self’ and ‘other’ stimuli, participants were grouped in pairs such that the ‘self’ voice (SV) of one participant served as the ‘other’ voice (OV) for the other participant and vice versa.
Finally, we processed all recordings with the DAVID software platform (Rachman et al., 2018) to generate expressive changes related to happiness and sadness to create two deviants from the standard utterance. These changes were created by combining audio effects such as pitch shift (increasing the standard’s pitch by 50 cents in the happy deviant and decreasing by 70 cents in the sad deviant), inflection (increasing the beginning of the second syllable by an extra 70 cents in happy) and filtering (increasing high-frequency energy with a high-shelf filter in happy and decreasing high-frequency energy with a low-shelf filter in sad; see Table 1 for parameter values). Two different expressive changes were chosen to test for c onsistency between effects with parameter changes in different directions (upward and downward pitch.) Crucially, using such
programmable transformations ensured that, in both the self and other sequences, deviants differed from the standards in exactly the same manner, making EEG responses to such deviations comparable between sequences (Figure 1).
Oddball paradigm
We used an oddball paradigm with two different sequences: one ‘self sequence’ and one ‘other sequence’. In the ‘self sequence’, the neutral recording of the SV served as the standard stimu-lus and the ‘happy’ and ‘sad’ transformations of the standard stimulus served as the two expressive deviants. Following the same logic, the ‘other-sequence’ used the neutral recording of the OV as the standard and its ‘happy’ and ‘sad’ transformations as deviants (seeFigure 2). Additionally, both sequences also con-tained an identity deviant to try to replicate previous studies by Graux and colleagues (2013, 2015); the neutral SV was presented as the identity deviant in the ‘other sequence’ and vice versa (seeReplication of Graux et al. (2015)for further information). We counterbalanced the order of the sequences across participants. Each sequence contained 1080 stimuli in total with the standard stimulus occurring 80% of the time and each of the three deviant stimuli (‘happy’, ‘sad’ and ‘identity’) occurring 6.7% of the time (72 stimuli). Each sequence started with 10 standard stimuli and 2–7 standards occurred between successive deviants. All stimuli lasted 550 ms and were presented with a stimulus onset asynchrony of 1000 ms.
Behavioral tasks
To test whether participants were able to distinguish their own voice from a stranger’s voice, they performed a behavioral self-other discrimination task. Five bisyllabic words and three pseu-dowords (Supplementary Table S1), produced by the participant and another person (the same ‘other’ as was presented during the EEG recording), were presented in the neutral version and with the happy and sad transformations applied. Participants were asked to indicate for each stimulus if it was their own voice or the voice of someone else. In a second behavioral task participants rated the emotional intensity of the voices (see
Supplementary Materialfor results). Follow-up categorization task
To test whether the expressive transformations were correctly recognized, a second group of N = 20 female participants per-formed a categorization task of the expressive transformations
Fig. 1. Acoustic content of two representative stimuli used in the MMN experiment. Solid line, black, pitch of the standard; red, increase of pitch in the happy deviant;
green, decrease of pitch in the sad deviant. Shaded area indicates second-syllable inflection in the happy deviant. Dotted line, black, spectral centroid (centre of mass) of the standard; red, high-frequency energy added in the happy deviant; green, high-frequency energy removed in the sad deviant. Bottom, black, half-corrected waveforms of the standard. Left, participant’s own voice (SELF). Right, another participant’s voice (OTHER).
Fig. 2. Schematic representation of the oddball sequences for the self (above)
and other (below) conditions. In the SV sequences, standards are neutral SV and deviants are happy (SV+) and sad (SV-) manipulations of the standard, as well as one OV recording of the same word (OV). In the OV sequences, standards are neutral OVs and deviants are happy (OV+) and sad (OV-) manipulations as well as one SV recording of the same word (SV).
with the same stimuli as above (five bisyllabic and three pseudo words). Participants were presented with pairs of the same word produced by the same speaker (SV or OV). The first stimulus was always an original, non-manipulated recording, and the second stimulus was either a neutral recording or transformed using the ‘happy’ or ‘sad’ effect. Participants were then asked to categorize the second stimulus in a three-option categorization task (neutral–happy–sad).
Procedure
During the EEG recordings, subjects were seated in front of a computer screen (55× 32 cm) on which they watched a silent subtitled movie. Participants were asked to pay attention to the movie and to ignore the sounds. Auditory stimulus presentation was controlled with PsychoPy (Peirce, 2007), and sounds were delivered through Sennheiser (Germany) CX 300-II earphones at 70 dB SPL.
Electroencephalographic (EEG) data were recorded from 63 scalp locations (actiCHamp, Brain Products GmbH, Germany) with a sampling rate of 500 Hz, relative to a nose tip reference, and filtered with a bandpass of 0.01–100 Hz (12 dB/octave roll-off). Four electrodes were placed on the left and right temples [horizontal electrooculogram (EOG)] and above and below the left eye (vertical EOG) to monitor eye movements and blinks, respectively. Sound onset triggers were sent to the EEG acqui-sition computer by a Cedrus StimTracker (Cedrus Corporation, San Pedro, CA) to control synchronization between stimulus presentation and the EEG signal.
Pre-processing and statistical analyses were performed in FieldTrip (Oostenveld et al., 2011). Offline, the continuous data were re-referenced to the average of the left and right mastoid electrodes (TP9 and TP10) and filtered with a 0.1 Hz high-pass filter (Butterworth, 12 dB/octave roll-off) and a 30 Hz low-pass filter (Butterworth, 48 dB/octave roll-off). The data were then visually inspected to remove epochs with artifacts, such as mus-cle activity and signal drifts. Next, eye blinks and movements were corrected using the fast independent component analysis method.
To get a better estimation of the MMN, we equated the number of deviants and standards by randomly selecting 69 standards (as many as the mean number of deviants after arti-fact rejection) that immediately preceded a deviant in the self and other sequences. Individual EEG epochs were averaged sepa-rately for each type of standard (self, other) and deviant stimulus (neutral self, neutral other, happy self, happy other, sad self, sad other), with a 200 ms pre-stimulus baseline and a 700 ms post-stimulus period. After artifact rejection, each subject had at least
75% trials remaining in each condition and the number of trials did not differ across conditions (Self standard, M = 831.5; happy, M = 69.7; sad, M = 69.4; Other standard, M = 831.3; happy, M = 68.7; sad, M = 69.0; Ps > 0.05). Finally, four difference waves were calculated by subtracting the grand average waveform of the standard stimuli from each of the deviant grand averages within each sequence type (i.e. for each speaker separately), yielding the following conditions: ‘Happy Self’, ‘Happy Other’, ‘Sad Self’ and ‘Sad Other’.
Statistical analyses
Statistical analyses were conducted in Python 2.7. The alpha level was set at 0.05, and all statistical tests were two-tailed.
Accuracy scores and ratings were computed from the dis-crimination and intensity rating tasks, respectively. We con-ducted one-sample t-tests on the accuracy scores to test whether SV and OV were discriminated above chance level (50%). Signifi-cant main effects and interactions were followed up with Tukey HSD for post-hoc comparisons.
EEG data were analyzed using cluster-based statistics imple-mented in FieldTrip (Maris and Oostenveld, 2007). In total, four cluster-based permutation tests were performed: one on the standard grand averages to test for an effect of speaker identity and three on the difference waves to investigate main effects of identity and expression and the identity× expression inter-action. For the interaction we first calculated the difference between the happy and sad difference waves for each speaker identity separately before entering these data into the analysis. Based on prior hypotheses about the temporal location of the MMN component (e.g.Beauchemin et al., 2006,Graux et al., 2015,
Pinheiro et al., 2017b), analyses were carried out within a 50–300 ms time window across all electrodes. For each cluster-based permutation test, we first conducted pairwise t-tests between two conditions at each channel and time point in the predefined time window. The critical P-value for the t-statistic for depen-dent samples was set to 0.05 (two-sided). Spatial clusters were formed if a significant channel had at least two neighbouring channels that also passed the specified significance threshold. For each cluster, the sum of the individual t-values of all the samples included in that cluster was computed and compared with the maximum cluster-level test statistic obtained by 5000 random permutations in which subject-specific averages were randomly permuted for each subject individually (Monte Carlo
P-value < 0.05, two-sided).
As an alternative parametric analysis strategy, we analyzed the mean MMN amplitude and MMN peak and onset latencies within a region of interest (ROI) comprising electrodes F1, Fz, F2, FC1, FCz, FC2, C1, Cz and C2. We extracted the mean amplitude over a 40 ms time window around the averaged MMN peak across conditions, participants and electrodes (280± 20 ms) to avoid a possible bias introduced by differences in conditions. We extracted the MMN onset and peak latencies using a jack-knife procedure and tested for differences in the four conditions (identity× expressive tone). The jackknife procedure improves statistical power by taking the latencies of the grand average using a leave-one-out method (Ulrich and Miller, 2001,Kiesel et al., 2008); for N = 23 participants, we calculated 23 grand averages, each leaving out 1 of the participants and including the other 22. We then determined the onset latency for each of these 23 grand averages as the time where the difference wave reached 50% of the MMN peak amplitude. In a similar way, we defined the MMN peak latency as the time at which the difference wave reached the most negative amplitude. These
L. Rachman et al. 563
ues were entered into two separate repeated measures analysis of variance (rmANOVA)s with identity (self, other), expressive tone (happy, sad), antero-posterior site (frontal, frontocentral, central) and lateralization (1-line, z-line, 2-line) as within-subject factors. Finally, we divided the resulting F-value by (N− 1)2 to
correct for the artificially low error variance introduced by the leave-one-out procedure (Ulrich and Miller, 2001). Furthermore, Greenhouse–Geisser correction for non-sphericity was applied when necessary. We report uncorrected degrees of freedom and corrected P-values.
Source localization. Estimation of cortical current source
den-sity was performed with Brainstorm (Tadel et al., 2011). The cortical current source density mapping was obtained from a distributed source model of 15 000 current dipoles. The dipoles were unconstrained to the cortical mantle of a generic brain model built from the standard Montreal Neurological Institute (MNI) template brain provided in Brainstorm. EEG electrode posi-tions were determined for each subject using a CapTrak sys-tem (Brain Products GmbH, Germany) and aligned to the stan-dard MNI template brain. The forward model was computed with the OpenMEEG Boundary Element Method (Gramfort et al., 2010). A noise covariance matrix was computed for each sub-ject by taking the 200 ms baseline period of each trial and was taken into account in the inversion algorithm. The cortical current source density mapping was then obtained for each subject from the time series of each condition by means of the weighted minimum-norm estimate. Z-scored cortical maps across all conditions were used to define the ROIs that are activated irrespective of expressive tone and identity within the time window in which there was a significant difference between self and other conditions. ROIs contained at least 30 vertices with a z-score above 60% of the maximum z-score. To analyze the cortical sources of the difference waves we per-formed paired t-tests for each vertex within the defined ROIs, taking the mean values across the 190–230 ms window. This time window was chosen to span the interval between the average MMN onset latency in the OV condition (190 ms) and the average MMN onset latency in the SV condition (236 ms), in order to identify sources for the activity explaining the effect (see ‘Results’ section). Activations within an ROI were consid-ered significant whenever at least 10 adjacent vertices reached statistical significance.
Replication of Graux et al. (2015)
In addition to the above procedure, we included extra stim-uli to replicate the identity mismatch response of Graux et al.(2013), namely one neutral-other deviant (P = 0.067) in the ‘self’ sequences (the same stimulus that served as standard in the ‘other’ sequence) and one neutral-self deviant (P = 0.067) in the ‘other’ sequences (the same stimulus that served as standard in the ‘self’ sequence). Difference waves were calcu-lated by subtracting (neutral) standards that immediately pre-ceded the identity deviant of one sequence (e.g. ‘other’ stan-dard from ‘other’ sequence) from the neutral deviant of the same identity in the other sequence (e.g. ‘other’ deviant from ‘self’ sequence). While not statistically significant, the pattern of responses to both types of deviants was consistent with
Graux et al.(2013), with larger P3a for ‘other’ deviants than ‘self’ (seeSupplementary Figure S1). These results are not further discussed in this paper.
Fig. 3. (A) Discrimination accuracy (%) for neutral, happy and sad versions of SV
and OV. Dotted line indicates chance level performance (50%). (B) Categorization accuracy (%) for neutral, happy and sad versions of SV and OV. Dotted line indicates chance level performance (33.3%). Error bars represent standard error of the mean (SEM). **P < 0.01
Results
Behavioral results
In the post-EEG task, participants were tested on a variety of SV and OV stimuli, unprocessed or processed with expressive changes, and asked to evaluate whether these were examples of the SV.
The accuracy of self-other discrimination was greater in OVs than in SVs (main effect of speaker identity: F(1, 22) = 80.7,
P < 0.001), which is easily explained by the fact that it is easier
to misattribute sounds from the self to (an infinite possibility of) other identities than the other way around. There was also a main effect of expressive tone on discrimination accuracy (F(2, 44) = 19.2, P < 0.001) and an identity × expressive tone interaction (F(2, 44)= 20.7, P < 0.001), showing that manipulated SVs were more easily confused for other identities than non-manipulated voices. Self-other discrimination was more accurate than chance for both neutral and expressive OVs (ts(22) > 19, Ps < 0.001), more accurate than chance in the neu-tral (t(22)= 9.66, P < 0.001) and sad SVs (t(22) = 2.60, P < 0.05), but not in happy SVs (t(22)= −1.07, P > 0.05;Figure 3, left). When
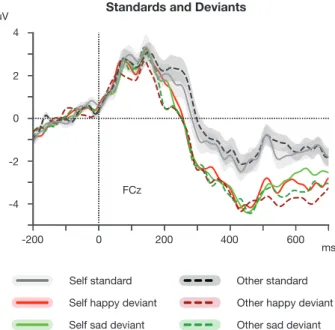
Fig. 4. Grand average ERPs to the self (solid lines) and other (dashed lines) standard and deviant stimuli. Shaded area represents bootstrap SEM.
taking only the /ba-ba/ stimulus into account, two participants did not recognize their voice in the neutral condition. The happy and sad transformations of the SV were not recognized by 11 and 9 participants, respectively. Overall, nine participants correctly identified the self-produced /ba-ba/ in all three conditions (for difference waves of these participants, seeSupplementary Figure S2).
In the additional categorization task of the expressive trans-formations, accuracy was greater in SV than in OV (main effect of speaker identity: F(1, 18)= 15.14, P < 0.01). We also found a main effect of expressive tone (F(2, 36) = 20.59, P < 0.001), as well as an identity× expressive tone interaction (F(2, 36) = 5.31,
P < 0.05). Follow-up paired sample t-tests revealed that the
happy transformation was better recognized on the SV than on the OV: t(18) = 4.03, P < 0.01 (Bonferroni corrected;
Figure 3, right).
Standards
The cluster-based permutation test and rmANOVAs did not reveal any differences between Self and Other standards (Ps > 0.05;Figure 4).
Difference waves
Difference waves showed a relatively small (-2μV) fronto-central negativity peaking at 280± 20 ms, compatible with an MMN (Figure 5). The difference waves were also re-referenced to the nose reference to ensure the typical polarity inversion between Fz/Cz and the mastoid electrodes. However, because mastoid-referenced averages typically show a better signal-to-noise ratio than the nose-referenced averages, the former were used in all subsequent analyses (Kujala et al., 2007,Martínez-Montes et al., 2013).
We found a significant cluster when testing for a main effect of identity (Monte Carlo P < 0.05; Figure 5D) but none for a main effect of expressive tone or an interaction. Parametric
analyses with the jackknife procedure revealed that this differ-ence was driven by the onset of the MMN rather than its peak. There was a main effect of identity on the MMN onset latency
(Fcorrected(1,22) = 10.14, P < 0.01), with the OV onset latency at
190 ms, compared to 236 ms in the SV condition, a considerable difference of 46 ms (seeFigure 5A–Cfor the difference waves and topographies). There were no effects of expressive tone, electrode antero-posterior location or lateralization on onset latency, nor was there a significant interaction between any of the factors. In contrast, no main effects of identity or expressive tone were observed on the amplitude (-2μV) or the latency (280 ± 20 ms) of MMN peak, and no interaction effects were observed on the MMN peak latency. The rmANOVAs on the mean MMN amplitude showed only an identity× lateralization interaction effect (F(2, 44) = 7.04, P < 0.01), but follow-up analyses at each antero-posterior site (frontal, frontocentral, central) did not reveal an effect of identity (all Ps > 0.05).
Sources
ROIs identified using source activation maps across all con-ditions in the 190–230 ms window (spanning the difference between other- and self- MMN onset latencies) included bilateral regions in the precentral gyri, large insulo-temporal regions in the right hemisphere and large fronto-parietal regions in the left hemisphere. Source activations for OV vs SV in these ROIs were stronger in the left precentral gyrus/sulcus (47 vertices) and the left postcentral gyrus (16 vertices;Figure 6).
Discussion
Changes in vocal cues can communicate a person’s social atti-tude or emotional state and are thus important to process in social interactions. The present study investigated whether the same expressive changes (pitch variations, inflections, and tim-bre) are processed differently on the SV compared to a stranger’s voice.
Behavior
Self/other discrimination rates for transformed versions of the SVs were lower than for the neutral SVs, which suggests that our manipulations of expressive tone, and notably the happy effect, affected identity perception to a certain extent. While it is difficult to relate such subsequent, explicit recognition scores to the implicit processes occurring during the earlier oddball procedure (see, e.g.,Candini et al., 2014), it remains possible that some of the participants processed deviants in SV sequences as differing both in expressive tone and speaker identity. However, it appears implausible that such misattributed deviants in SV sequences should drive the greater MMN onset latencies seen in these sequences compared to OV sequences. First, deviants misattributed as OVs in sequences of SVs have been traditionally associated with greater, rather than lower saliency [e.g. greater P3a amplitude in (Graux et al., 2015), such that misattributions of identity in SV sequences should reduce, rather than accen-tuate the effect found here. Second, while behavioral data show speaker identity is affected to a larger extent by the happy effect than the sad effect, EEG responses to happy and sad deviants did not differ.
In other auditory tasks, a sound’s increased emotional or social relevance often creates perceptual biases that make them appear louder or more intense (Asutay and Västfjäll, 2012,
L. Rachman et al. 565
Fig. 5. (A) Differences waves of the happy (red) and sad (green) transformations on the self (light) and other (dark) voice. (B) Differences waves of the pooled happy
and sad deviants of the self (light) and other (dark) voice. Shaded area represents bootstrap SEM, **P < 0.01. (C) Topographies of the pooled happy and sad deviants of the SV and OV at MMN onset and peak. (D) Significant cluster of the contrast between the ‘other’ and ‘self’ difference waves represented in four 10 ms time windows between 180 and 220 ms. Highlighted channels belong to the cluster and were significant across the whole time 10 ms window.
Neuhoff, 1998). Here, expressive changes on SV and OV did not differ in their perceived emotional intensity (seeSupplementary Figure S3). However, while manipulated expressions were categorized well above chance level for both SVs and OVs, happy (and to a lesser extent, sad) manipulations were categorized more accurately when participants heard them on their own voice rather than on an unfamiliar stranger’s voice. This pattern of results is in line with a number of studies showing better recognition or prediction accuracy when one observes one’s own actions than when one observes another person’s actions (Knoblich and Flach, 2001, Tye-Murray et al., 2015) and can also be explained by better sensory resolution for the familiar sounds of one’s own voice, similarly perhaps to the language familiarity effects seen with native vs foreign language speaker discrimination (Fleming et al., 2014).
N onset latency Across all conditions, the MMN peak latency was a relatively late 280 ms. MMN usually peaks at 150–250 ms from change onset, with this peak latency getting larger with the decreased magnitude, or increased processing difficulty, of stimulus change (Garrido et al., 2009). It is possible that the late peak latency observed here reflects a late onset of observable
stimulus change in our two-syllable words. In particular, spectral changes associated with happy or sad deviants may only become manifest on the vowel portion of the first syllable (onset ca. 100 ms, seeFigure 1). In similar studies of two-syllable emotional words with a variety of changes (e.g. consonant duration, omis-sion of second syllable, etc.),Pakarinen et al.(2014) report MMN peak latencies ranging between 126–355 ms post stimulus-onset andChen et al.(2016) a peak MMNm of 265 ms; in contrast, with single-vowel stimuli involving more immediate timbre changes and no initial consonant,Carminati et al.(2018) report MMN latencies ˜200 ms. Future work should better document the temporal profile of physical information available in the signal to discriminate deviants from standards, in order to more precisely determine the chronometry of their auditory processing.
We observed no difference in MMN amplitude and peak latency, but an earlier MMN onset for expressive deviants on the OV compared to the SV. This MMN onset latency effect was seen in both expressive transformations and amounted to a considerable difference of 46 ms. Because we did not find any significant difference between the self and other conditions on the waveform of the standard stimuli, and because both self and
Fig. 6. (A) Source localizations across all conditions in the 190–230 ms showing maxima of activation (¿60%, z-scores) to determine ROIs. (B) Modulations of cortical
activity as a function of speaker identity in the 190–230 ms time window. Only clusters containing at least 10 contiguous vertices with P < 0.05 in this time window were considered statistically significant. The source activations are color-coded only for t-values corresponding to P < 0.05. (C) Time courses of the grand mean amplitude of the current sources in each activated region for self and other conditions. Shaded areas represent the standard deviation; the grey area represents the 190–230 ms time window in which the analyses took place.
other deviants were generated from the standards with identical algorithmic procedures, it is unlikely that such a large onset effect results from the differential processing of the standards or differences in refractory states (Jacobsen and Schröger, 2001). The shorter MMN onset latency in the OV condition rather suggests that changes on a stranger’s voice are highly prioritized in auditory processing. This is in contrast with the increased saliency of self-stimuli in the visual domain (Apps and Tsakiris, 2014,Sel et al., 2016), but consistent with the idea that other-stimuli are more socially relevant (Pinheiro et al., 2017b,Schirmer et al., 2005). In a recent study, effects of emotion were seen earlier in a communicative context when compared to a non-communicative context (Rohr and Abdel Rahman, 2015). It there-fore appears possible that our design of other-deviants in a sequence of other-standards is implicitly treated as a context akin to social communication (‘other speaking to self’), more so than changes embedded in a sequence of self-sounds.
It should be emphasized that only female participants were included in this study. While both women and men typically show an MMN response to emotional deviants, previous work has showed that this preattentive response can be amplified in women, possibly because of a greater social relevance of emo-tional information for women (Schirmer et al., 2007). Importantly, this amplification seems to be specific to vocal sounds and has not been found in nonvocal sounds (Hung and Cheng, 2014). As such, it remains to be determined whether male participants show a similar difference in MMN onset latency as what we report here.
Source activations
Source estimations during the MMN onset temporal window (190–230 ms) across all conditions showed activations in the
right insulo-temporal region and the left fronto-parietal region. Right-lateralized temporal activations are in line with previous MMN studies that reported right activations for pitch deviants in tones and voice (Jiang et al., 2014,Lappe et al., 2016). In addition, the right anterior insula is involved in processing vocal emotions (Belin et al., 2004) and has also been associated with MMN responses to emotional syllable deviants (Chen et al., 2016).
The interpretation of EEG source analysis should remain conservative. Here, activity discriminative of self and other mis-matches did not occur within the typical supra-temporal or frontal MMN generators (Garrido et al., 2009), which suggests that processing OV stimuli was accompanied neither by any detectable enhancement of sensory processes nor by any switch of attention. Neither did activity discriminative of self and other occur within the predominantly right-lateralized regions previ-ously associated with speaker identity tasks, such as the right temporoparietal junction (Schall et al., 2015) and right inferior frontal gyrus (Kaplan et al., 2008) or with MMN sources associated with emotional vocal stimuli such as the right anterior insula (Chen et al., 2016). Instead, when contrasting responses to ‘self’ and ‘other’ deviants within the above ROIs, we found increased activations in the left precentral gyrus/sulcus and the left post-central gyrus for deviants on the OV.
These regions suggest that vocal expression deviants recruit a network of motor and somatosensory areas that are increas-ingly thought to be involved in mapping heard speech onto articulatory representations (Scott and Johnsrude, 2003,Evans and Davis, 2015,Skipper et al., 2017). The left somatomotor cortex in particular has been associated with phoneme discrimination tasks (Sato et al., 2009) and appears to be especially recruited for more effortful conditions involving noisy (D’Ausilio et al., 2012,Hervais-Adelman et al., 2012) or non-native speech (Wilson and Iacoboni, 2006), in which articulatory representations
L. Rachman et al. 567
may provide a processing advantage. In the visual modality, left somatosensory areas have also been associated with unpredicted deviations from the self-face (Sel et al., 2016), or facial emotion recognition in the other (Sel et al., 2014), both of which are also believed to involve processes of embodied simulation or predictions. Earlier activity in this network of regions for the OV deviants is therefore compatible with a greater recruitment of resources for less internally predictable signals such as speech produced by an unfamiliar stranger, for which listeners may lack an adequate internal template—a fact that can also explain that categorizing the expressive tone in a separate explicit task was more difficult on non-self voices.
In sum, expressive changes on a stranger’s voice are highly prioritized in perceptual processing compared to identical changes on the SV. OV deviants generate earlier MMN responses and involve activity in a left motor/somatosensory network suggestive of greater recruitment of resources for less internally predictable, and therefore perhaps more socially relevant, signals.
Supplementary data
Supplementary dataare available at SCAN online.
Acknowledgments
All data were collected at the Centre Multidisciplinaire des Sciences Comportementales Sorbonne-Université-Institut Européen d’Administration des Affaires. The authors thank Maël Garnotel for his help with the data collection, Nathalie George for advice on the source analyses and Marie Gomot for comments on the manuscript.
Funding
This study was supported by European Research Coun-cil Grant StG 335536 Cracking the Emotional Code of Music to J.J.A.
References
Apps, M.A., Tsakiris, M. (2014). The free-energy self: a predictive coding account of self-recognition. Neuroscience and
Biobehav-ioral Reviews, 41, 85–97.
Asutay, E., Västfjäll, D. (2012). Perception of loudness is influ-enced by emotion. PLoS One, 7(6), e38660.
Aucouturier, J.-J., Johansson, P., Hall, L., Segnini, R., Mercadié, L., Watanabe, K. (2016). Covert digital manipulation of vocal emo-tion alter speakers’ emoemo-tional states in a congruent direcemo-tion.
Proceedings of the National Academy of Sciences of the United States of America, 113(4), 948–53.
Bayer, M., Ruthmann, K., Schacht, A. (2017). The impact of per-sonal relevance on emotion processing: evidence from event-related potentials and pupillary responses. Social Cognitive and
Affective Neuroscience, 12, 1470–9.
Beauchemin, M., De Beaumont, L., Vannasing, P., et al. (2006). Electrophysiological markers of voice familiarity. The European
Journal of Neuroscience, 23, 3081–6.
Belin, P., Fecteau, S., Bedard, C. (2004). Thinking the voice: neural correlates of voice perception. Trends in Cognitive Sciences, 8(3), 129–35.
Campanella, S., Gaspard, C., Debatisse, D., Bruyer, R., Crommelinck, M., Guerit, J.-M. (2002). Discrimination of emotional facial expressions in a visual oddball task: an ERP study. Biological Psychology, 59(3), 171–86.
Candini, M., Zamagni, E., Nuzzo, A., Ruotolo, F., Iachini, T., Frassinetti, F. (2014). Who is speaking? Implicit and explicit self and other voice recognition. Brain and Cognition, 92, 112–7. Carminati, M., Fiori-Duharcourt, N., Isel, F. (2018).
Neurophysio-logical differentiation between preattentive and attentive pro-cessing of emotional expressions on french vowels. Biological
Psychology, 132, 55–63.
Chen, C., Chen, C.-Y., Yang, C.-Y., Lin, C.-H., Cheng, Y. (2014a). Testosterone modulates preattentive sensory processing and involuntary attention switches to emotional voices. Journal of
Neurophysiology, 113(6), 1842–9.
Chen, C., Lee, Y.-H., Cheng, Y. (2014b). Anterior insular cortex activity to emotional salience of voices in a passive oddball paradigm. Frontiers in Human Neuroscience, 8, 743.
Chen, B., Kitaoka, N., Takeda, K. (2016). Impact of acoustic sim-ilarity on efficiency of verbal information transmission via subtle prosodic cues. EURASIP Journal on Audio, Speech, and Music
Processing, 2016(1), 19.
Conde, T., Goncalves, O.F., Pinheiro, A.P. (2015). Paying attention to my voice or yours: an ERP study with words. Biological
Psychology, 111, 40–52.
D’Ausilio, A., Bufalari, I., Salmas, P., Fadiga, L. (2012). The role of the motor system in discriminating normal and degraded speech sounds. Cortex, 48(7), 882–7.
Evans, S., Davis, M.H. (2015). Hierarchical organization of auditory and motor representations in speech perception: evidence from searchlight similarity analysis. Cerebral Cortex, 25(12), 4772–88.
Fleming, D., Giordano, B.L., Caldara, R., Belin, P. (2014). A language-familiarity effect for speaker discrimination without compre-hension. Proceedings of the National Academy of Sciences of the
United States of America, 111(38), 13795–8.
Frith, C.D. (2012). The role of metacognition in human social interactions. Philosophical Transactions of the Royal Society of
London. Series B, Biological Sciences, 367, 2213–23.
Gallese, V., Keysers, C., Rizzolatti, G. (2004). A unifying view of the basis of social cognition. Trends in Cognitive Sciences, 8(9), 396– 403.
Garrido, M.I., Kilner, J.M., Stephan, K.E., Friston, K.J. (2009). The mismatch negativity: a review of underlying mechanisms.
Clin-ical Neurophysiology, 120(3), 453–63.
Gramfort, A., Papadopoulo, T., Olivi, E., Clerc, M. (2010). Open-MEEG: opensource software for quasistatic bioelectromagnet-ics. Biomedical Engineering Online, 9(1), 45.
Graux, J., Gomot, M., Roux, S., Bonnet-Brilhault, F., Camus, V., Bruneau, N. (2013). My voice or yours? An electrophysiological study. Brain Topography, 26(1), 72–82.
Graux, J., Gomot, M., Roux, S., Bonnet-Brilhault, F., Bruneau, N. (2015). Is my voice just a familiar voice? An electrophysiologi-cal study. Social Cognitive and Affective Neuroscience, 10(1), 101–5. Hervais-Adelman, A.G., Carlyon, R.P., Johnsrude, I.S., Davis, M.H. (2012). Brain regions recruited for the effortful comprehen-sion of noise-vocoded words. Language and Cognitive Processes,
27(7–8), 1145–66.
Hung, A.-Y., Cheng, Y. (2014). Sex differences in preattentive perception of emotional voices and acoustic attributes.
Neu-roreport, 25(7), 464–9.
Jacobsen, T., Schröger, E. (2001). Is there pre-attentive memory-based comparison of pitch? Psychophysiology, 38, 723–7.
Jacobsen, T., Schröger, E., Winkler, I., Horváth, J. (2005). Familiarity affects the processing of task-irrelevant auditory deviance.
Journal of Cognitive Neuroscience, 17(11), 1704–13.
James, W. (1884). What is an emotion? Mind, 9(34), 188–205. Jiang, A., Yang, J., Yang, Y. (2014). MMN responses during implicit
processing of changes in emotional prosody: an ERP study using Chinese pseudo-syllables. Cognitive Neurodynamics, 8(6), 499–508.
Jürgens, R., Grass, A., Drolet, M., Fischer, J. (2015). Effect of acting experience on emotion expression and recognition in voice: non-actors provide better stimuli than expected. Journal of
Nonverbal Behavior, 39(3), 195–214.
Kaplan, J.T., Aziz-Zadeh, L., Uddin, L.Q., Iacoboni, M. (2008). The self across the senses: an fMRI study of self-face and self-voice recognition. Social Cognitive and Affective Neuroscience, 3, 218–23. Kiesel, A., Miller, J., Jolicoeur, P., Brisson, B. (2008). Measurement of ERP latency differences: a comparison of single-participant and jackknife-based scoring methods. Psychophysiology, 45(2), 250–74.
Knoblich, G., Flach, R. (2001). Predicting the effects of actions: interactions of perception and action. Psychological Science,
12(6), 467–72.
Kovarski, K., Latinus, M., Charpentier, J., et al. (2017). Facial expres-sion related vMMN: disentangling emotional from neutral change detection. Frontiers in Human Neuroscience, 11, 18. Kujala, T., Tervaniemi, M., Schröger, E. (2007). The mismatch
negativity in cognitive and clinical neuroscience: theoretical and methodological considerations. Biological Psychology, 74(1), 1–19.
Laird, J.D., Lacasse, K. (2014). Bodily influences on emotional feelings: accumulating evidence and extensions of William James’s theory of emotion. Emotion Review, 6(1), 27–34. Lappe, C., Lappe, M., Pantev, C. (2016). Differential processing of
melodic, rhythmic and simple tone deviations in musicians— an MEG study. NeuroImage, 124, 898–905.
Leitman, D.I., Sehatpour, P., Garidis, C., Gomez-Ramirez, M., Javitt, D.C. (2011). Preliminary evidence of pre-attentive distinctions of frequency-modulated tones that convey affect. Frontiers in
Human Neuroscience, 5, 96.
Maris, E., Oostenveld, R. (2007). Nonparametric statistical testing of EEG- and MEG-data. Journal of Neuroscience Methods, 164(1), 177–90.
Martínez-Montes, E., Hernández-Pérez, H., Chobert, J., et al. (2013). Musical expertise and foreign speech perception. Frontiers in
Systems Neuroscience, 7, 84.
Neuhoff, J.G. (1998). Perceptual bias for rising tones. Nature,
395(6698), 123.
Niedenthal, P.M. (2007). Embodying emotion. Science, 316(5827), 1002–5.
Oostenveld, R., Fries, P., Maris, E., Schoffelen, J.-M. (2011). Fieldtrip: open source software for advanced analysis of MEG, EEG, and invasive electrophysiological data. Computational Intelligence
and Neuroscience, 2011, 1.
Pakarinen, S., Sokka, L., Leinikka, M., Henelius, A., Korpela, J., Huotilainen, M. (2014). Fast determination of MMN and P3a responses to linguistically and emotionally relevant changes in pseudoword stimuli. Neuroscience Letters, 577, 28–33. Pampalk, E. (2004). A Matlab toolbox to compute music similarity
from audio. In Proceedings of the ISMIR International Confer-ence on Music Information Retrieval (ISMIR’04), pp. 254–257, Barcelona, Spain, October 10–14, 2004.
Pannese, A., Hirsch, J. (2011). Self-face enhances processing of immediately preceding invisible faces. Neuropsychologia, 49(3), 564–73.
Peirce, J.W. (2007). Psychopy—psychophysics software in python.
Journal of Neuroscience Methods, 162(1), 8–13.
Pinheiro, A.P., Barros, C., Dias, M., Niznikiewicz, M. (2017a). Does emotion change auditory prediction and deviance detection?
Biological Psychology, 127, 123–33.
Pinheiro, A.P., Barros, C., Vasconcelos, M., Obermeier, C., Kotz, S.A. (2017b). Is laughter a better vocal change detector than a growl? Cortex, 92, 233–48.
Rachman, L., Liuni, M., Arias, P., et al. (2018). David: an open-source platform for real-time transformation of infra-segmental emotional cues in running speech. Behavior Research
Methods, 50(1), 323–43.
Rohr, L., Abdel Rahman, R. (2015). Affective responses to emo-tional words are boosted in communicative situations.
Neu-roImage, 109, 273–82.
Sato, M., Tremblay, P., Gracco, V.L. (2009). A mediating role of the premotor cortex in phoneme segmentation. Brain and
Lan-guage, 111(1), 1–7.
Schall, S., Kiebel, S.J., Maess, B., von Kriegstein, K. (2015). Voice identity recognition: functional division of the right STS and its behavioral relevance. Journal of Cognitive Neuroscience, 27(2), 280–91.
Schirmer, A., Striano, T., Friederici, A.D. (2005). Sex differences in the preattentive processing of vocal emotional expressions.
Neuroreport, 16(6), 635–9.
Schirmer, A., Simpson, E., Escoffier, N. (2007). Listen up! Process-ing of intensity change differs for vocal and nonvocal sounds.
Brain Research, 1176, 103–12.
Scott, S.K., Johnsrude, I.S. (2003). The neuroanatomical and func-tional organization of speech perception. Trends in
Neuro-sciences, 26(2), 100–7.
Sel, A., Forster, B., Calvo-Merino, B. (2014). The emotional homunculus: ERP evidence for independent somatosensory responses during facial emotional processing. Journal of
Neu-roscience, 34(9), 3263–7.
Sel, A., Harding, R., Tsakiris, M. (2016). Electrophysiological cor-relates of self-specific prediction errors in the human brain.
NeuroImage, 125, 13–24.
Skipper, J.I., Devlin, J.T., Lametti, D.R. (2017). The hearing ear is always found close to the speaking tongue: review of the role of the motor system in speech perception. Brain and Language,
164, 77–105.
Sulykos, I., Kecskés-Kovács, K., Czigler, I. (2015). Asymmetric effect of automatic deviant detection: the effect of familiarity in visual mismatch negativity. Brain Research, 1626, 108–17. Tacikowski, P., Nowicka, A. (2010). Allocation of attention to
self-name and self-face: an ERP study. Biological Psychology, 84(2), 318–24.
Tadel, F., Baillet, S., Mosher, J.C., Pantazis, D., Leahy, R.M. (2011). Brainstorm: a user-friendly application for MEG/EEG analysis.
Computational Intelligence and Neuroscience, 2011, 8.
Tye-Murray, N., Spehar, B.P., Myerson, J., Hale, S., Sommers, M.S. (2015). The self-advantage in visual speech processing enhances audiovisual speech recognition in noise. Psychonomic
Bulletin & Review, 22(4), 1048–53.
Ulrich, R., Miller, J. (2001). Using the jackknife-based scoring method for measuring LRP onset effects in factorial designs.
Psychophysiology, 38(5), 816–27.
Wagenmakers, E.-J., Beek, T., Dijkhoff, L., et al. (2016). Registered replication report: Strack, Martin, & Stepper (1988). Perspectives
on Psychological Science, 11(6), 917–28.
Wilson, S.M., Iacoboni, M. (2006). Neural responses to non-native phonemes varying in producibility: evidence for the sensori-motor nature of speech perception. NeuroImage, 33(1), 316–25.