HAL Id: insu-00717704
https://hal-insu.archives-ouvertes.fr/insu-00717704
Submitted on 13 Jul 2012
HAL is a multi-disciplinary open access
archive for the deposit and dissemination of
sci-entific research documents, whether they are
pub-lished or not. The documents may come from
teaching and research institutions in France or
abroad, or from public or private research centers.
L’archive ouverte pluridisciplinaire HAL, est
destinée au dépôt et à la diffusion de documents
scientifiques de niveau recherche, publiés ou non,
émanant des établissements d’enseignement et de
recherche français ou étrangers, des laboratoires
publics ou privés.
Apparent synfolding magnetization as a result of overlap
of pre- and post-folding magnetizations
Nadir Halim, Jean-Pascal Cogné, Vincent Courtillot, Yan Chen
To cite this version:
Nadir Halim, Jean-Pascal Cogné, Vincent Courtillot, Yan Chen. Apparent synfolding magnetization
as a result of overlap of pre- and post-folding magnetizations. Geophysical Research Letters, American
Geophysical Union, 1996, 23 (24), pp.3523-3526. �10.1029/96GL03254�. �insu-00717704�
GEOPHYSICAL
RESEARCH
LETTERS, VOL. 23, NO. 24, PAGES 3523-3526,
DECEMBER 1, 1996
Apparent synfolding magnetization
as a result of overlap of
pre- and post-folding magnetizations
Nadir Halim, Jean Pascal Cogn6 and Vincent Courtillot
Institut de Physique du Globe de Paris, Paris, FranceYan Chen
Laboratoire de G6ologie Structurale, Universit6 d'Orl•ans, Orleans, France
Abstract. In most rocks, Natural Remanent Magnetization
(NRM) can involve two or more superimposed components. Demagnetizations hopefully result in the separation of these
components, which may then be resolved using least-squares
regression methods. In a study of Cretaceous redbed sites from
Qaidam (China), thermal demagnetization of most specimens revealed 3 rectilinear segments in orthogonal plots, giving the appearance of a 3-component magnetization. In order to
help deciding if the intermediate straight segments could have
resulted from overlap between post-folding low temperature (LTC) and pre-folding high temperature components (HTC), we modeled the overlap using a priori information on the
directions and relative intensities of LTC and HTC derived
from the actual observations. We constructed typical synthetic Zijderveld (1967) diagrams for each site, which could be compared with those obtained from the real samples. We conclude for the Qaidam samples that the intermediate temperature component (ITC) is most likely an artefact
resulting from overlap between the LTC and HTC.
1. Introduction.
Demagnetization techniques routinely used by
paleomagnetists are expected to either confirm the primary
nature of a natural remanent magnetization (NRM) or to
unravel successive phases of remagnetization and
overprinting. When demagnetization steps are suitably chosen, demagnetization paths can often be divided into rectilinear segments in orthogonal projection, and the directions of individual components determined with a principal component line fitting method (Kirschvink, 1980).
The number of segments is usually taken to be the number of
magnetization components (although, as noted by R. Butler- pers. comm., 1996 - the degree of difficulty in deciphering NRM increases as some rather large power of the number of components). Overlap of unblocking temperature or coercivity spectra tends to produce a curved trajectory on the vector component diagrams within the interval of overlap. This is how such overlaps are generally recognized (e.g. Dunlop, 1979).
During thermal demagnetization of Cretaceous redbeds from
the Gansu Corridor, in the Qaidam block (China; Halim et al,
in preparation), we obtained Zijderveld diagrams consisting of
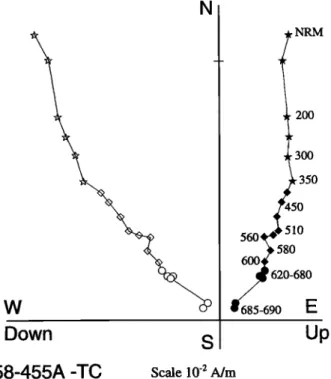
3 rather clear linear segments in 9 out of 13 sites (Figure 1,...
Copyright 1996 by the American Geophysical Union.
Paper number 96GL03254.
0094-8534/96/96GL-03254505.00
The first segment represents a lower temperature component (LTC), unblocked by 280-350øC, which is close to the present earth field (PEF) direction; the third segment represents a
higher temperature component (HTC) which becomes
unblocked above 550øC (see Table 1). The intermediate
segment can be interpreted in (at least) two different manners.
It could correspond to an intermediate temperature component
(ITC) with an unblocking temperature spectrum ranging from a
lower temperature between 300 and 400øC to an upper temperature between 550 and 600øC. Alternately, it could have resulted from overlap between the HTC and the LTC, hence be
an artefact with no useful paleomagnetic meaning. But then this would be a rather unusual overlap with straight rather than
curved trajectory. The purpose of this letter is to briefly report
w
N
S
Down
NRM 300 350•]'450
560,•
60•!•'
580'5•
620-680
ø
6•585-690
up
58-455A -TC
10
-2 AJm
Figure 1. A typical demagnetization diagram (Zijderveld,
1967) from a Cretaceous redbed specimen (58-455A) from the
Qaidam block (China; Halim et al, in preparation) displaying three quasi-linear demagnetization segments, apparently
corresponding to three distinct components of magnetization
at lower (LTC, stars), intermediate (ITC, diamonds) and higher
(HTC, circles) temperatures. Some demagnetization
temperature steps are indicated. Correction for bedding has beel• applied (see table 1). Closed (resp. opened) symbols are for projections onto the horizontal (resp. NS-vertical) plane. 3523
3524
HALIM ET AL.' SYNFOLDING
MAGNETIZATION
Table 1. Magnetization characteristics for the lower and higher temperature componentsSite Bedding LTC HTC
Strike Dip Ti I -Tfl M D ! Ti2-Tf2 M D ! 32 38 18 0-580 0.30 29. ! 52.3 350-680 3.40 43.5 46.5 33 157 75 0-580 0.40 29.9 45.5 350-680 0.39 58.9 -22.3 35 126 32 0-580 0.21 21.2 56.8 350-680 0.33 34.3 17.6 55 I 18 42 0-580 1.45 I 1.5 54.5 350-680 2.60 21.2 15.5 56 118 42 0-580 1.82 ! 7.2 43.4 350-680 !.03 17.7 31.9 58 249 44 0-580 7.68 10.6 58.6 350-680 9.51 89.0 45.6 59 261 52 0-580 2.63 7.1 57.0 350-680 3.47 97.6 41.2 60 263 56 0-580 2.04 6.5 57.5 350-680 3.59 114.6 43.8
Characteristics of low (LTC) and high (HTC) temperature components (in situ coordinates) for 8 sites of
Cretaceous redbeds from Qaldam (China; Halira et al, in preparation). Site number, bedding strike (s) and dip (d) are
first given. For each component, the range of the temperature spectrum (Ti-Tf), magnitude (M; 10'2A/m), declination (D) and inclination (1) are given next. The HTC is a pre-folding and the LTC a post-folding magnetization (see text
and Table 2). Subscripts "i" and 'T' for "initial" and "final".
Miv
Til
(a) •,•
r•
I E Up
our analysis
and modelling
of this problem,
which does
not
seem
to have been previously
encountered.
A full report
of the
Qaidam
study
is given
elsewhere
(Halim
et al, in preparation).
In the following, the intermediate
linear part of the vector
plots
is termed
ITC, with no a priori
implied
interpretation
as
to whether this is a real component or an artefact. (b)
2. Analysis
The ITC was determined on the intermediate temperature
linear
portions
of the demagnetization
diagrams,
where
it was
clearly not parallel
to either the LTC or the HTC, at the
specimen
level. Site-mean
directions
of the ITC from the 9
sites in which it was isolated are illustrated in equal-area
projection
in Figure
2 (a and
b), which
shows
that
data
cluster
upon total unfolding,
although
significant
scatter
remains.
0 0 27 90 180 180 99% 95% _ •
60-
kmax=64.5
0.) = • 5o- • 4o- 7O • 90 30- 20-,o-
O0 10 20 30 40 50 60 70 60 90 100
(c)
•
180 % UnfoldlngFigure 2. Equal area projection of the apparent intermediate
temperature component (ITC) site-means and overall mean (star with shaded 95% cone of confidence) obtained from the
Cretaceous redbeds sites in Qaidam (China; Halim et al, in preparation) before (a) and after (b) bedding correction.
Squares
(resp.
dots)
are site-mean
directions
from North (resp.
South) dipping limbs. (c) stepwise unfolding of the observed apparent ITC, showing a maximum Fisher (1953) precision
parameter
k for 70% of unfolding
(N=9 sites);
the resulting
site-mean directions and overall mean are shown in (d).
(dM/dT) I
(dM/dT)2
illlllilillliliiiiili"'"'"'"'""
T,I Ti2 Tfl T• T
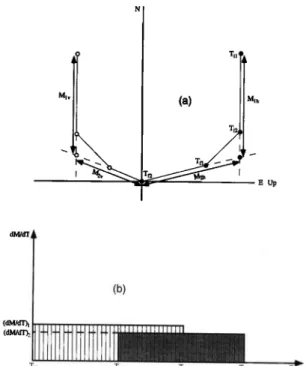
Figure 3. (a) Simplified schematic representation of the
determination of LTC and HTC intensities; M lv and M lh (
resp. M2v and M2h) represent the north-vertical and
horizontal components of the lower temperature (resp. higher
temperature) component. (b) A simple model of the uniform
overlapping temperature spectra of the LTC (between Til and Tfl) and HTC (between Ti2 and Tf2), with respective magnetization densities (dM/dT)l and (dM/dT)2. The integral of each spectrum (area of the corresponding rectangle) is
determined from the intensities in (a). Same conventions as in Figure 1.
Average directions before and after full bedding correction are
respectively
Dg=46.8
ø, Ig=50.1
o (c•95=
21.8ø),
and
Ds=26.1
ø,
Is=58.2 ø (c•95=10.6ø). Furthermore, it may be seen that data from north dipping limbs (sites 57, 59, 60; squares in Fig.2a
and 2b) cross over data from south dipping limbs (all other sites; circles in Fig. 2a and 2b) upon unfolding. This holds not only for sites from different limbs, but also for data from south dipping limbs with different dip angles (see in particular
sites 32, 33, and 35). This kind of behaviour is often
interpreted as resulting from a remagnetization during folding.
We thus performed a progressive stepwise unfolding of these
data (in 5% steps), and followed the evolution of the grouping
through the k precision parameter (Fisher, 1953) as a function
of unfolding percentage. The results of this stepwise unfolding are shown in Figure 2(c and d). Maximum clustering occurs at 70% of unfolding, with k=64.5. This clustering is
Table 2. Magnetization characteristics for the observed versus modelled intermediate temperature
component
Site Observed Modelled A
N D ! k 0t95 D ! 32 4 33.8 49.6 102.9 7.6 38.6 48.8 33 4 55.2 6.9 119.3 6.2 49.3 4.0 35 6 30.8 34.6 61.4 9.8 31.8 29.1 55 7 18.6 29.7 142.0 4.1 19.1 27.6 56 •3 22.0 33.0 195.0 4.0 17.4 38.7 58 83.6 6 !. 1 107.0 5.4 65.1 56.8 59 13 110. 2 57.3 242.4 2.4 73.1 55.2 60 12 118.6 57.3 73.5 4.7 94.1 57.8 Mean 8 50.4 46.8 44.1 42.5 (k--6.5, o.95=23.5 ø) (k---9.5, o.95=!9.0 ø) 3.2 6.5 5.6 2.1 6.8 10.4 20.5 13.1
Mean declination and inclination (in situ coordinates) and statistical parameters of the observed and modelled apparent intermediate temperature component (ITC). N is the number of specimens used in each site. k and 0t95 are the Fisher precision parameter and the radius of the 95% cone of confidence for the observed ITC site-means. A is the angle between the modelled and the observed ITC directions.
HALIM ET AL.' SYNFOLDING MAGNETIZATION 3525
significant at the 99% probability level with respect to uncorrected directions, and at the 95% probability level with respect to the fully tilt-corrected directions. Following the classical interpretation, we should therefore conclude that the
ITCs from this formation are a remagnetization acquired early
(about 30%) in the folding of this series. The corresponding average ITC direction would be D=32.9 ø, I=56.8 ø (k=64.5,
1x95=6.4 ø, N=9).
For the same sites, the LTC yields a negative fold test (at the 99% confidence level) and a post-folding direction of
Dg=15.3
ø, Ig=53.9
ø (1x95=5.3ø).
With bedding
correction
one
finds Ds=353.1 ø, Is=50.3 ø (1x95=28.6ø). In the same way, the
HTC yields a positive fold test (at the 99% confidence level)
and a pre-folding direction of Ds=38.5 ø, Is=50.2 ø
(1x95=11.8ø).
Before
bedding
correction,
one
finds
Dg= 51.2
ø,
Ig= 38.0
ø (o•95=28.2ø).
The ITC therefore
lies between
the
pre-folding HTC and post-folding LTC directions and yields an
"in-between" apparent synfolding remagnetization test. These
observations are of course a cause of some concern. Moreover,
a few Zijderveld diagrams do show some amount of curvature.
In effect, if we now go back to the demagnetization curves,
we note that the ITCs generally make a small angle with
respect
to the HTCs at the specimen
level. When they are
present in a single specimen, LTC, ITC and HTC all have Northerly downward directions. We should therefore consider
the possibility
that the ITC could result from overlapping
unblocking temperature spectra of the LTC and HTC.
3. Modelling and Discussion
In order to investigate these possibilities, we have
attempted to model the demagnetization behaviour of two
components with overlapping spectra, and to compare results
from the model to the observed data.
N
D•wn
S
N 58-456B-TC Scale: 10 -1 Nm E W Up Down NN s up 58-462B-TC Scale: 10 '1 Nm N Down S Up Down 58-457B-TC Scale: 10 '1 Nm 58-synthetic- TC N N E UpFigure 4. Orthogonal vector plots of three actual and one synthetic demagnetization diagrams for samples from site 58,
after tilt correction. The synthetic case is based on the model
of Figure 3 where the LTC is assumed to be post-folding and the HTC pre-folding. The slight differences in NRM
magnitudes or orientations are due to the fact that the modelled specimen is an average of intensities and directions
determined from all specimens of the given site. Same
conventions as in Figure 1. 80 "• 40 3O 2O 10 0 0 o 99% o kmax= 80.5 N=8 270 90 served 10 20 30 40 50 60 70 80 90 100 180 %Unfolding 0 • 270 90 2• 30 2O 10 Overlapping model O0 10 20 30 40 50 60 70 80 90 100 180 % Unfolding
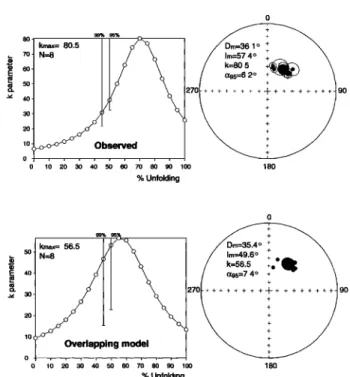
Figure 5. Stepwise unfolding of the observed and modelled
apparent intermediate temperature component for the N=8
sites in which the three components LTC, ITC and HTC had
been observed. Maximum grouping occurs at 70% of unfolding for the observed ITC and 55% of unfolding for the modelled one. The two average directions are close but
distinguishable, mostly because of an inclination difference
(AI=7.8ø+9.7ø; see text).
We start by determining the site-mean directions and the
average magnitudes of the LTC and HTC for the 8 out of 9 sites
where all three LTC, ITC, and HTC were found to co-exist. The
intensities of LTC and HTC were estimated graphically, as
shown in Figure 3a. The directions of LTC and HTC were continued linearly and intensities evaluated from NRM to the
intersection point for the LTC, and from that point to the
origin for the HTC. For site 57, both the ITC and HTC were of very small amplitude and rather noisy, and we were unable to determine the intensity of the HTC.
For the purpose of the model, we next made the simple hypothesis that the unblocking temperature spectra were uniform in the range of existence of each component (i.e. T i 1
and Tfl for the LTC, Ti2 and Tf2 for the HTC; see Figure 3b). A uniform temperature increment dT was chosen to construct synthetic demagnetization diagrams. The integrals of each spectrum distribution (i.e. the areas of the two corresponding, overlapping, rectangles) were constrained by the intensities as determined in Figure 3a:
Tfl
(dM/dT)]dT
•
= LT•
JTil
(dM/dT)2dT
= HT•
i2
allowing the determination of the magnetization densities (dM/dT)l and (dM/dT)2. Given the direction of the LTC and HTC vectors, it is then a simple matter to construct a
3526 HALIM ET AL.: SYNFOLDING MAGNETIZATION
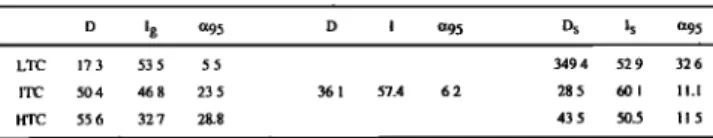
Table 3: Overall mean magnetization directions for the lower, intermediate and higher
temperature components. D lg 495 D I 495 D s i s 495 LTC 17.3 53.5 5 5 349 4 52 9 ITC 50.4 46.8 23.5 36.1 57.4 6.2 28.5 60.1 HTC 55 6 32.7 2&8 43.5 50.5 32 6 11.i 11.5
Means are calculated for N=8 sites (see text and Tables I and 2). The first three columns give dechnat•on (Dg),
•nchnatlon (lg) and 95% confidence •nterval (ot95) before bedding correction. The last three columns give declination
demagnetization stay roughly constant throughout the
overlapping interval. Given the data uncertainties, there is no
point in devising a more complex and realistic unblocking
temperature spectrum for the LTC or HTC. Also, it is
reasonable to conclude in the case of our Qaidam data, where
the red beds were deposited in the Cretaceous, folded as a result
of the Cenozoic India-Asia collision and to some extent
(D s) .... hnation(Is)and95%confid .... interval (ot95) after bedding .... tion. The middle col .... (D,l, ot95)are overprinted in the direction of the recent field, that the
for the ITC only for partial unfolding at 70%, minimizing ot95 (see text and Figure 5). Subscripts "g" and "s" for
"geographic" and "stratigraphic" coordinates.
In our study, we selected a temperature increment dT of
20øC; dM/dT, T i, and Tf corresponding to each pair (LTC,
HTC) were obtained from real samples, as listed in Table 1. The LTC was considered to be entirely post-folding and the HTC pre-folding, and the appropriate bedding attitudes were used for each site. We constructed in this way a typical synthetic Zijderveld diagram for each site. Results of this simulation are given in Table 2, where they are compared to the mean ITC in each site. As an example, we present in Figure 4 observed orthogonal vector plots corresponding to three additional specimens from site 58 (see also Figure 1) and the synthetic diagram for that site. As expected from the spectra of Figure 3b, the synthetic vector plots consists of 3 linear portions, which could erroneously be interpreted as three independent magnetization directions. We see in Table 2 that
the observed and modelled ITC overall mean for 8 sites are
quite
similar
in geographic
coordinates:
Dg=50.4
ø, Ig=46.8
ø
vs Dg=44.1
ø, Ig=42.5
ø. The same
is true in stratigraphic
coordinates: Ds=28.5 ø, Is=60.1 ø vs Ds=27.3 ø, Is=53.5 ø. When performing stepwise unfolding, the overlapping model
gave a maximum
k parameter
for the ITC at 55% of unfolding,
confirming that overlap of the two actual directions can
produce an apparent synfolding magnetization
component
(Figure 5). The synthetic ITC would seem to have been
acquired after 45% of folding, and the recorded direction would
then be D=35.4 ø, I=49.6 ø (c•95=7.4ø). This compares very
favorably with the actual data where k has its maximum value at 70% of unfolding, and with ITC direction D=36.1ø, 1=57.4 ø
(c•95=6.2 ø) (Table 3). The actual and synthetic ITC are slightly different in inclination (AI=7.8ø+9.7ø), in part because unfolding is not exactly at the same level. Also, the hypotheses for the intensities of LTC and HTC and shape of their unblocking temperature spectra are clearly
oversimplifications.
This simple model shows that two magnetization components with overlapping unblocking temperature
spectra, one acquired prior to folding and the other after folding, may yield in some cases (that is for certain values of
the temperature range and shape of the spectra), a linear magnetization component with apparent intermediate
temperature range and an apparent positive synfolding
remagnetization test, which is actually an artefact. This rather
unusual situation contrasts with the more commonly
encountered situation when overlaps produce curved trajectories. Here, the proportions of the high and low stability components removed within each increment of
apparent synfolding ITC has no useful geological meaning. We could clearly have been (and were originally) tempted to
use this apparently well dated component to deduce a pole and
relative displacements of Qaidam with respect to
neighbouring blocks as a result of the ongoing collision. A somewhat related warning was given by Dinarts and McClelland (1991): in that case complete overlap in constant proportions of two magnetization components resulted in a single vector component upon thermal demagnetization. AF
demagnetization and Lowrie tests however allowed to separate
the two components to some extent. Such tests were unsuccessful in our study (Halim et al, in preparation). We hope that this letter will be yet another cautionary example of some use in other similar studies.
Acknowledgments. This study is part of a cooperation project on the
Kunlun mountains between the French Institut National des Sciences de
l'Univers and the Ministry of Geology and Mineral Resources of the People's Republic of China. We are grateful to P. McFadden, R. Butler and V. DiVenere for careful and very useful reviews. IPGP
contribution n ø 1437.
References
Dinar•s-Turell, J., and McClelland, E., A cautionary tale for paleomagnetists: A spurious apparent single component remanence due to overlap of blocking-temperature spectra of two components, Geophys. Res. Lett., 18, 1297-1300, 1991.
Dunlop, D.J., On the use of Zijderveld vector diagrams in multicomponent paleomagnetic studies, Phys. Earth Planet. Inter., 20,
12-24, 1979.
Fisher, R.A., Dispersion on a sphere, Proc. R. Soc. London, 217, 295-
305, 1953.
McElhinny, M.W., Statistical significance of the fold test in
paleomagnetism, Geophys. J. R. astr. Soc., 8, 33-40, 1964.
Kirschvink, J.L., The least squares line and plane and the analysis of
paleomagnetic data, Geophys. J. R. Astr. Soc., 62, 699-718, 1980.
Zijderveld, J.D.A., A.C. demagnetization of rocks: Analysis of results,
in Methods in paleomagnetism, D.W.Collinson, K.M. Creer, and S.K.
Runcorn, eds., pp. 254-286, 1967.
N. Halim, Laboratoire de Pa16omagn6tisme, Institut de Physique du
Globe, 4 place Jussieu, 75252 Paris cedex 05, France.
J.P. Cogn6, Laboratoire de Pa16omagn6tisme, Institut de Physique du
Globe, 4 place Jussieu, 75252 Pads cedex 05, France.
V. Courtillot, Laboratoire de Pa16omagn6tisme, Institut de Physique
du Globe, 4 place Jussieu, 75252 Paris cedex 05, France.
Y. Chen, Laboratoire de G6ologie structurale, URA 1366, BP 6759,
45067 Orl6ans cedex 2, France.
(Received March 29, 1996; revised September 25, 1996; accepted September 26, 1996.)