HAL Id: hal-00003065
https://hal.archives-ouvertes.fr/hal-00003065
Submitted on 12 Oct 2004HAL is a multi-disciplinary open access
archive for the deposit and dissemination of sci-entific research documents, whether they are pub-lished or not. The documents may come from teaching and research institutions in France or abroad, or from public or private research centers.
L’archive ouverte pluridisciplinaire HAL, est destinée au dépôt et à la diffusion de documents scientifiques de niveau recherche, publiés ou non, émanant des établissements d’enseignement et de recherche français ou étrangers, des laboratoires publics ou privés.
thin section analyses : implications for the Oligocene
volcanism in the Kerguelen Archipelago (southern
Indian Ocean)
Guillaume Plenier, Pierre Camps, Bernard Henry, Benoit Ildefonse
To cite this version:
Guillaume Plenier, Pierre Camps, Bernard Henry, Benoit Ildefonse. Determination of flow directions combining AMS and thin section analyses : implications for the Oligocene volcanism in the Kerguelen Archipelago (southern Indian Ocean). Geophysical Journal International, Oxford University Press (OUP), 2005, 160, pp.63-78. �10.1111/j.1365-246X.2004.02488.x�. �hal-00003065�
ccsd-00003065, version 1 - 12 Oct 2004
Determination of flow directions combining AMS and
thin section analyses : implications for the Oligocene
volcanism in the Kerguelen Archipelago (southern
Indian Ocean).
G. Plenier
1, P. Camps
2⋆, B. Henry
3and B. Ildefonse
21 Laboratoire G´eophysique, Tectonique et S´edimentologie, CNRS and ISTEEM, Universit´e
Montpellier 2, case 060, 34095 Montpellier Cedex 05, France
2 Laboratoire de Tectonophysique, CNRS and ISTEEM, Universit´e Montpellier 2 case 049,
34095 Montpellier Cedex 05, France
3 G´eomagn´etisme et Pal´eomagn´etisme, CNRS and IPGP, 4 avenue de Neptune,
94107 Saint-Maur cedex, France
Accepted 2004 November XX. Received 2003 October XX; in original form 2004 August XX
SUMMARY
We report an Anisotropy of Magnetic Susceptibility (AMS) study carried out on seven Oligocene volcanic sections widely distributed on the surface of the Kerguelen Archipela-go. The statistical results at flow scale and at section scale were checked with AMS density diagrams and thin section analysis. Because of axes permutations frequently observed for lava flows, two possible flow directions were nicely defined for the majority of the sections. We then used two alternative approaches (imbrication of the minimum axis and symmetry of the AMS distribution) to infer a flow direction for each section. These two methods and thin section analyses not being decisive for choosing between the two solutions, geological and geomorphological observations were finally used for confident
interpretations. The results of this study helped to more precisely locate the supposed eruptive centers of the Kerguelen archipelago.
Key words: Lava flows – anisotropy – magnetic susceptibility – Shape Preferential Orientation – Kerguelen Archipelago.
1 INTRODUCTION
The magnetic susceptibility of a rock is a function of the minerals present and of their indi-vidual characteristics. It generally displays a directional variability referred to as anisotropy of magnetic susceptibility (AMS). AMS is represented by a second rank tensor of eigenvec-tors Kmin, Kint and Kmax (Hrouda, 1982; Borradaile, 1988; Rochette et al., 1992; Tarling
& Hrouda, 1993; Borradaile & Henry, 1997; Bouchez, 2000). For undeformed volcanic rocks, the global AMS is usually controlled by the presence of titanomagnetites and reflects either their anisotropy of distribution, after they lately crystallized in interstitial zones within the pre-existing silicate phase during lava flow (Hargraves et al., 1991), or more directly their orientation acquired during emplacement (Hrouda, 1982; Ca˜n´on Tapia et al., 1995; Morris, 2000). In each case, AMS records the end of flow emplacement (Ventura, 2001). Usually, the anisotropy of magnetic susceptibility is mostly weak, suggesting a not very effective orientation mechanism. This should be particularly true for lava flows where conditions of magma emplacement are less constrained than for dyke intrusions. Indeed, the absence of a second solid surface on the roof of the lavas during emplacement may prevent the magma flux from being stabilized. Moreover, the underlying surface, affected by erosion and/or tec-tonics (faults, folds,. . . ) or the roof of another flow, are generally less planar than dyke walls and the magma flux can therefore be easily deviated by natural obstacles. The magnetic lineation (Kmax) is found either parallel or perpendicular to the flow direction (Ca˜n´on Tapia
et al., 1995; Glen et al., 1997; Morris, 2000; Herrero-Bervera et al., 2002; Henry et al., 2003) even for samples from the same flow. The magnetic foliation (pole given by Kmin), on the ⋆Corresponding author. Tel: +33 467 14 39 38; Fax: +33 467 52 39 08. e-mail address: camps@dstu.univ-montp2.fr
contrary, is often close to the flow plane (Kolofikova, 1976; Ca˜n´on Tapia et al., 1996). By analogy with the use of imbrication to determine the flow sense within a dyke (Knight & Walker, 1988; Tauxe et al., 1998; Geoffroy et al., 2002), AMS was also proposed to infer the flow sense within a lava flow (Ca˜n´on Tapia et al., 1997). In this paper, the flow direction refers to the azimuth of flow and the flow sense to the way it flows (from N to S for example). Two previous AMS studies have been carried out in the Kerguelen Archipelago. Plenier et al. (2002) aimed to determine if the dip observed at a section was either due to an initial topography existing before the lava emplacement or to a late tectonic tilting of the whole sequence. They found a flow direction parallel to the dip of the lava pile, and thus they did not apply a tilt correction to their paleomagnetic data for this section. Henry et al. (2003) detected some variations of emplacement conditions along another section presenting a thick interbedded conglomeratic layer. Their analysis revealed a weak tilting in the southeastern part of the Archipelago. In both studies the principal susceptibility directions displayed numerous permutations, even at a flow scale, but flow directions were confidently defined.
The principal aim of this study is to determine the emplacement directions in seven sections distributed on the surface of the Archipelago in order to localize their respective eruptive centers (see Zhu et al. (2003) for a comparable study; on Hannuoba basalts, northern China). We present three different but complementary approaches for interpreting the AMS measurements: analysis at the section scale, at the flow scale and using density diagrams. Owing to the frequent permutations, thin sections analysis is also used to check the reliability of the flow directions obtained by AMS studies. Finally, the interpreted flow sense will be compared to that proposed by Nougier (1970a) from field observations (present dip, thickness variation and fault distribution of the lava piles).
2 GEOLOGY AND SAMPLING
The Kerguelen archipelago (Nougier, 1970a; Giret, 1986) is located at 70◦E and 49◦S in the
southern Indian Ocean, on the northern part of the Kerguelen-Gaussberg plateau. It repre-sents the last 30 Ma aerial continuation of the Kerguelen plume magmatic activity (Yang
et al., 1998; Weis et al., 1998; Nicolaysen et al., 2000). Some magmatic contributions related to the Southeast Indian Ridge during the early Cenozoic are also suspected (Doucet et al., 2002). Lava flows are preponderant in the archipelago. They outcrop at more than 85% of the surface and form 400 to 900 m high tabular relief incised by glacial erosion. Gabbro, granite and syenite intrusions from 1 to 15 km in diameter are also present locally. These plutons, derived from later Kerguelen plume melts (Giret, 1990; Weis & Giret, 1994), compose with few sediments the rest of the rocks outcropping in the archipelago.
Firstly devoted for paleosecular variation and paleointensity purposes (Plenier et al., 2002; Plenier et al., 2003), about seven samples per flow, oriented using magnetic and solar compass, have been collected. All the successive least altered lava flows (1 to 10 m thick) were sampled in their bottom part which generally gives the most reliable indication for flow direction from AMS studies (Glen et al., 1997; Herrero-Bervera et al., 2002). The collected lavas are equally distributed throughout each section and are thus representative of the lava piles. The samples were collected as far as possible from dykes and close to previously-dated sections (Yang et al., 1998; Nicolaysen et al., 2000; Doucet et al., 2002) across sections 1 (Port Christmas: 16 flows), 2 (Mont des Ruches: 18 flows), 3 (Mont des Tempˆetes: 20 flows), 4 (Port Couvreux: 6 flows), 5 (Mont Amery: 8 top flows), 6 (Port Raymond : 9 flows) and 7 (Mont Bureau : 18 flows) (Fig. 1). For the section 5, we completed our sampling with about 50 samples from the 8 bottom flows just below (VA-VH), which were previously collected by Henry and Plessard (1997). No significant dip has been observed for all of these lava sequences, except for the sections 4 and 6 for which a dip of 5◦ toward the E and of
4◦ toward the ESE has been measured, respectively.
3 ROCK MAGNETISM
The magnetic carriers of one sample per flow for sections 2, 3 and 4 have been identified (Plenier et al., 2003) using low-field susceptibility thermal evolution curves (K-T curves). Two distinct behaviors were observed. Irreversible and complex K-T curves correspond to an assembly of original rich-Ti titanomagnetites or slightly oxidized titanomaghemites with
higher Curie temperature titanomaghemites due to low temperature oxidation (Fig. 2a). Reversible K-T curves characterize poor-Ti titanomagnetites produced by high temperature oxyexsolution of the original titanomagnetite during the flow emplacement (Fig. 2b). Thin section observation with an oil immersion lens allowed similar conclusions. We found samples showing irreversible K-T curves to be associated with pleochroic ilmenite and an optically isotropic phase interpreted as a titanomaghemite (Fig. 2c). For samples presenting reversible K-T curves, exsolved ilmenite or titanohematite lamellae results from deuteric oxidation of a residual titanomagnetite (Fig. 2d).
4 ANISOTROPY OF MAGNETIC SUSCEPTIBILITY
AMS of 649 non-demagnetized standard samples was measured using KLY2 and KLY3 Kap-pabridges at IPGP (Saint Maur) and Montpellier paleomagnetic laboratories respectively. Owing to the occurrence of conglomerate at the base of the third flow from the Mont des Ruches section (section 2) and the few samples (8) in the underlying units, these two bottom flows have been rejected from the rest of the analysis. Indeed, they may have experienced dif-ferent emplacement conditions (in particular taking place with difdif-ferent dips) as previously observed for the analysis of the Port Jeanne d’Arc section (Henry et al., 2003). They need therefore to be discarded. At the end, a total of 641 samples were kept for the determination of flow direction.
The data have been analyzed at two different scales to determine flow direction. In each case, the confidence zone for the mean direction of each axis was calculated using both linear perturbation analysis (Hext, 1963; Jelinek, 1978; Lienert, 1991) and bootstrap method (Constable & Tauxe, 1990). These two statistics providing approximately the same results, only the bootstrap ellipses are displayed on the figures.
4.1 Flow scale analysis
In this approach, we first calculated the mean directions of the principal susceptibilities for each individual flows and then averaged them to estimate the mean directions of the section
as the whole. Lava flows with less than 4 samples and those for which the principal suscep-tibility directions are poorly defined (displaying 2 or 3 principal directions not statistically different) were excluded from the analysis.
The relatively low number of samples per flow is probably the main reason for the low percentage of flows (less than 50%) that yielded reliable results (Table 1). This problem was already pointed out by Canon-Tapia (1997), who concluded that measurement of less than 10 specimens per flow often yields large statistical uncertainty of the susceptibility principal directions.
With only two remaining flows, section 4 was not subjected further to this analysis. On the contrary, for the other six sections, the mean directions of the selected flows are relatively well grouped (left part of Fig. 3) and allow the determination of a mean magnetic fabric representative of each lava pile (Table 1 and right part of Fig. 3).
The three northern sections (1, 2 and 3), and sections 5 and 6 present very similar magnetic fabric: Kmax is almost horizontal with a direction between N-S and NW-SE, and
Kmin close to vertical. For section 7, this fabric changes slightly with Kmax oriented SW-NE. Confidence zones are of variable size. The confidence ellipse for Kmin is elongated in a plane
perpendicular to Kmax, whereas it is elongated in the horizontal plane (perpendicular to
Kmin) for Kmax.
4.2 Grouping of the flows
The flow scale analysis led to the rejection of more than half of the studied flows and did not allow any interpretation concerning the section 4. Moreover, flow direction can be affected by local disturbances related in particular to irregularities of the underlying flow surface. Therefore, the more samples included in the computation, the more the effects of local deviation on the mean directions are limited by averaging. Grouping of all the AMS data for each section increases the reliability of the mean axes orientation and of their confidence zone (Plenier et al., 2002; Henry et al., 2003).
observed on the field within the volcanic sequences. However, because several eruptive centers could be involved in a same lava pile, the mean principal axes and their 95% confidence zones parameters have been calculated for groups of 3 to 5 immediately adjacent flows to check a possible evolution of the flow direction within a section (Fig. 4). In the absence of such evolution, all data can be grouped together to infer global flow direction. Statistical approaches being partly biased in case of systematic axis permutations, density diagrams were also used for comparison with this later flow direction.
For sections 2, 3 and 6, the successive groups of flow recorded an almost identical mean direction, though in the two latter the mean directions of the upper lava group are more scattered. For the sections 4, 5 and 7, the direction recorded from one group to another seems less consistent at the section scale, but the mean axes are not statistically different from subset to subset.
For sections 1 and 7, a difference of the ca9-12 and fa1-6 group of flows, respectively, relative to the other groups is observed. However, this difference is related to permutations of Kmaxand Kintallowed by the almost isotropic fabric of these groups of flow. The consistency of the mean AMS directions being verified, the AMS samples data of each whole section were merged.
The mean axes orientation obtained for each section (Table 2, Fig. 5) is very similar to that determined by flow scale analysis when allowed. For section 4, Kmax scatters in an
almost horizontal plane with a poorly defined SW-NE mean direction and Kmin is close to
vertical with a confidence ellipse elongated in a plane perpendicular to Kmax, as already
observed for the other sections. Jelinek’s (1981) diagrams presented in Figure 5 display similar distributions for sections 1, 2, 3, 5, 6 and 7, with a shape from prolate to oblate cases and a mean P’ between 1.009 and 1.038. Section 4 displays the same scatter for T parameter but only very low values for the degree of anisotropy P’.
4.3 Density diagrams
A difficulty in statistical analysis of AMS of volcanic flows is the possible occurrence of permutation of the principal susceptibility axes. Such permutations, often observed, can be ascribed to (i) local strain changes (Merle, 1998) owing to the paleotopography or the posi-tion of the samples in the flow, (ii) composiposi-tion and size of the magnetic minerals (Rochette et al., 1992), (iii) magnetic interactions of the grains (Gr´egoire et al., 1995), (iv) rolling of the elongated particles in strong velocity gradients by analogy with sediments (Jeffery, 1922; Tarling & Hrouda, 1993) and (v) grain settling (Ca˜n´on Tapia et al., 1996). These permutations lead to perpendicular clusters for the same principal axis. This clearly can be pointed out using density contours on a stereonet for a large set of samples (Rochette et al., 1992). Such diagrams also often allow better estimation of the distribution symmetry relative to vertical plane of the eigenvectors and to infer the emplacement direction (Henry, 1980; Thompson et al., 1986; Ca˜n´on Tapia et al., 1997; Ca˜n´on Tapia & Coe, 2000).
Density contour plots of Kmax and Kmin for all the AMS data of each section (Fig. 6)
are very similar for all sections: Kmin of high inclination and Kmax close to the horizontal
plane. The directions with the highest density of axis on the density diagrams are very similar to the global mean AMS eigenvectors of the section scale analysis. This indicates that permutations do not significantly affect, here, the mean tensor directions. The only exceptions are sections 4 and 7, which display relatively high scatter of the mean directions probably related to their particularly low degree of anisotropy.
For the other sections however, the minimum axes are not regularly scattered around their mean direction, but mostly spread within a strongly dipping plane, towards NNW for sections 2 and 3, WNW for section 6 and SSE for sections 1 and 5. The dip direction of this plane, and thus the vertical symmetry plane of the minimum axes distribution is then NNW-SSE or WNW-ESE according to the sections.
The maximum axes systematically display a bimodal distribution. Because axes permu-tation have been found in the same flow, these bimodal distributions are not related to flows which recorded lava emplacement from distinct eruptive centers. It is noteworthy that the
clearest defined mean maximum axis is for sections 1, 2, 3, 5 and 6 near the dip direction of the vertical plane indicated by the minimum axes distribution. Taken together, maximum and minimum axes distributions admit a same vertical plane of symmetry.
5 THIN SECTIONS ANALYSIS
The flow directions determined using AMS have been opposed to an independent flow di-rection indicator (Henry, 1980; Callot et al., 2001) represented by image analysis of thin sections.
We prepared polished thin sections parallel to the magnetic foliation plane (Kmax-Kint)
for two samples from section 3 (Fig. 7a and b from the flows Tem16 and Tem18 respectively) and two others from section 5 (Fig. 7f and g from the flows Ame6 and Ame8 respectively). We included in addition three other samples from a previous study (Plenier et al., 2002) at the Mont de la Tourmente section (Fig. 7c, d and e from the flows Tou2, Tou11 and Tou15 respectively). One of these samples (Fig. 7c) has magnetic lineation (Kmax) perpendicular
to the interpreted flow direction. Obviously, two or three thin sections per lava pile are not enough for determining its emplacement direction. The aim of these analyses is only to compare discrete results from an independent method with the AMS interpretation.
Depending on the grain size, microphotographs correspond to the entire thin section or to several zoomed numeric microphotographs. After redrawing each feldspar lath, the cosine director method of Harvey and Laxton (1980) was initially used to determine the preferred elongation axis of the plagioclases. In the absence of imbrication and for a low velocity gradient (as expected for lava flow emplacement on relatively weak slope), this axis is assumed to reflect the flow direction. Unfortunately, only two thin sections show plagioclase phenocrysts. Consequently, we performed systematic analysis using the intercept method (Launeau & Bouchez, 1992), which allows random shapes to be treated (Callot et al., 2001). After image filtering to sharpen their bounds, the plagioclase and opaque phases were individualized in two black and white (B&W) pictures for each microphotograph. The intercept software (Launeau & Robin, 1996) yielded the direction of maximum orientation of
the grain boundaries, which corresponds to the preferred elongation axis of the considered phase. The coherence between the two methods has been verified for two thin sections (Fig. 7d and f). Results are plotted as a rose diagram with a line indicating the researched preferred elongated axis of a ”mean” mineral and a bold line corresponding to the maximum axis of the distribution. The mean orientation defined with the method of Harvey and Laxton (1980), when it was usable, is represented by a dashed bold line.
The thin sections presented in Fig. 7, display poorly anisotropic distributions of the pre-ferred elongated axis of each phase (shape ratio SR on the order of 1.05). The maximum direction nearest to the mean orientation is thus interpreted as indicating the flow direc-tion. Relatively good agreement between the orientation of the minerals and the magnetic lineation (dashed bold lines on the left pictures) is observed for thin sections a, b, e and g. For sample f (Fig. 7), the contrast of color between the plagioclase laths was not pro-nounced enough to individualize them with image filtering. The N-S maximum orientation found after analyzing the filtered B&W picture supposed to correspond to the plagioclase phase then corresponds to an artifact of the digital treatment of the microphotograph. It can be due to noise included by the picture treatment as well as several groupings of plagioclase laths together with global shapes not systematically related to the flow emplacement. Con-sidering this problem, in that case the preferred elongated direction of the analyzed phases is parallel to the magnetic lineation.
On the contrary, the thin section c (Fig. 7) exhibits a maximum direction (bold line) perpendicular to the magnetic lineation (dashed bold line on the left picture) for both phases. This sample was actually indicated to present a magnetic lineation perpendicular to the interpreted flow direction. Combined with the analysis of thin section e (Fig. 7) that shows a good agreement between orientation of minerals and magnetic lineation, this observation confirms the emplacement direction obtained for the Mont de la Tourmente section (Plenier et al., 2002).
Sample d (Fig. 7) from the same section gives different results. For this thin section, Kmax is parallel to the flow direction but the elongated axes are again perpendicular to the
magnetic lineation. The flow direction deduced from this thin section should disagree with that deduced from the two other thin sections, the AMS data and the dip of the flows in the Mont de la Tourmente section. That refutes the possibility of the thin section analysis to furnish a systematic answer for a given flow direction. However, the direction for the opaque phase clearly mimics that of the redrawn plagioclase phenocrysts picture (bottom). That should suggest anisotropy of distribution of the ferromagnetic grains located along the plagioclase phenocrysts boundaries (Hargraves et al., 1991; Callot et al., 2001; Ferr´e et al., 2002) giving Kmax perpendicular to the flow direction. That does not correspond to the
measured AMS, which is then probably mainly carried by very small grains, non-discernible on the picture. We can however observe that the B&W picture of the plagioclase phase issued from image filtering furnish a bimodal distribution. This bimodality is related to the presence of plagioclases with perpendicularly oriented laths in the groundmass (not sampled in the redrawn picture) in the analyzed microphotograph. A ”rolling effect” (Jeffery, 1922; Tarling & Hrouda, 1993), which is known to preferentially influence the phenocrysts, can be expected for a 15◦dip as measured for the Mont de la Tourmente section. Hence, the
secondary maximum corresponding to the groundmass is therefore a better indicator of the flow direction. This secondary maximum direction is then in good agreement with the magnetic lineation.
6 DISCUSSION AND INTERPRETATION
6.1 Determination of the flow direction
The flow scale analysis of the AMS data nicely defines a mean magnetic fabric for 6 of the sections. However, more than 50 percent of the studied flows cannot be taken into account and consequently such analysis of section 4 was not possible. Grouping of all the AMS data for a section (section scale analysis) allows for consideration of each recorded data and more confidently represents the mean flow direction of the lava piles. These statistical approaches, being at least partly biased in presence of axes permutations, the analysis of density dia-grams, disregarding the intensity of the AMS directions, allows for better visualization of
the distribution. Combining the three complementary approaches used in this study, two alternative flow directions can be confidently inferred for most sections: NW-SE or NE-SW for section 1, NNW-SSE or WSW-ENE for sections 2, 3 and 5, NNE-SSW or WNW-ESE for section 6, and ENE-WSW or NNW-SSE for section 7. Section 4, with only 37 samples, does not allow reliable conclusion (NW-SE or SW-NE?). Owing to the permutations of axes observed at the flow scale, there are no a priori reasons for the flow direction to be indicated by Kmax. Indeed, if the majority of the samples from a same unit have a permutation of
the Kmax and Kint axes, the interpretation using Kmax would lead to a 90◦ error in the flow
direction estimation.
When all the AMS data have been obtained in the same part of the flow (bottom part in our case), knowing the dip of the section, it is theoretically possible to deduce its sense of flow by imbrication (Ca˜n´on Tapia et al., 1997; Ca˜n´on Tapia & Coe, 2000). Then, the deviation direction of the strongly dipping mean axis from the vertical, related to imbrication, could be used to try to select the direction and sense of flow between the two possible interpretations given above for some sections. The flow should have been towards the NE for section 1. The interpretation of flow remains ambiguous for the other sections, in particular section 7, more affected by axes permutations, displaying larger confidence ellipses and three mean directions relatively out of the horizontal plane. For sections 2, 3, 4 and 5, the degree of imbrication is low and the interpretation made using the imbrication may not be statistically significant considering the scatter of the vertical axes. In addition, computed flow experiments (Dragoni et al., 1997) with rotating rigid ellipsoidal magnetite in a viscous material subjected to a velocity gradient displays normal or reverse imbrication depending on the strain value for a given elongation ratio. These experiments may explain the presence of two maxima in the distribution of Kmin for section 6 (Fig. 6).
An alternative for inferring a flow direction from the AMS data is to use the vertical plane of symmetry of the distribution of susceptibility axes (Henry, 1980; Thompson et al., 1986). Although this method cannot be used for indicating a flow sense, the vertical plane of symmetry is usually relatively well highlighted by the scatter of the Kmin direction in the
density diagrams (right part of Fig. 6). Using this alternative approach, the flow direction should have been NE-SW for section 1, NNW-SSE or ENE-WSW for sections 2, 3, 4, 5 and 7, and NNE-SSW or WNW-ESE for section 6.
The determination of the symmetry of the distribution of the AMS directions is then also subject to uncertainties and there is, at this time, no reason to favor one of the two alternative interpretations. Unfortunately, analyses of thin sections are prone to the same ambiguities as AMS study, because preferred lengthening axis of minerals can be parallel or perpendicular to the flow direction. This appears also by the presence of several maxima on the rose distribution diagrams from thin sections. It is also interesting to note that sample d clearly has two families of opaque grains. The first type of grains mimic the orientation of plagioclase phenocrysts and have a preferred elongated axis almost perpendicular to flow direction whereas AMS is mainly carried by very small grains within the groundmass with Kmax parallel to the flow direction.
6.2 Comparison with field observations
For sections 1, 2 and 3, several geological observations argue for a common eruptive center located westerly of the Loranchet Peninsula (Nougier, 1970a): shallow western submarine plateau, global shallow dip toward the East or Northeast and a main morphology of ending flow at the eastern coast. Geomorphological observations (Nougier, 1970a) show that section 1 to 3 belong to the same volcanic province. Their magnetic fabric is similar and the same
interpretation of flow direction is therefore expected for the three sections. The NE to ENE flow sense, indicated by the clear imbrication of section 1, is coherent with the geological observations and in good agreement with the earlier interpretation indicated in the geological map (Nougier, 1970b). The northern eruptive center should then be expected presently below sea level and located W or WSW of the Loranchet Peninsula. It is noteworthy that the scatter of the minimum axis is parallel to the interpreted flow direction. The two AMS studies previously performed on the Kerguelen archipelago (Plenier et al., 2002; Henry et al., 2003) displayed a scatter of the minimum axis perpendicular to the interpreted flow direction. In
the absence of evidences for deducing a flow direction as systematically perpendicular to the scatter of the vertical axis, we decided to keep our interpretation based on geological observations. Measurements of AMS for lava flows from several localities with a flow direction independently well known would be of great interest for checking a possible systematic relationship between the scatter of the vertical axis and the flow direction.
For section 5, another independent eruptive center is defined in the western part of the Courbet Peninsula from clear geomorphological arguments like the thickness variation of the lava pile. In particular, a divergence of the dip, though not very marked, from a center located at Montagnes Vertes is described. Numerous dykes are also observed in this area. This section is thus very close to the supposed eruptive center. For that reason, both NNW-SSE and ENE-WSW flow directions are compatible with the occurrence of an eruptive center at Montagnes Vertes. Therefore, the sense of flow for the entire section can equally be interpreted as SSE or WSW.
Sections 4 and 6 are located at the limit between the Courbet peninsula and Cook glacier volcanic provinces.
Considering the consistency of the signal recorded for these sections, no mixture be-tween two magma sources is expected. The WNW-ESE possible flow direction determined for section 6 clearly favors an eruptive center located in the vicinity of the Cook glacier. Moreover, this flow direction is in better agreement with the 4◦dip toward the E observed
at this section and we thus interpret the flow sense as ESE. For section 4 we interpret the flow sense as probably being from WSW to ENE, considering an eruptive center under the Cook glacier, also in agreement with the observed dip.
Sections 7 belong to the same Cook volcanic province. A previous study (Plenier et al., 2002) showed that the eruption center for another section in the same area (section 9) was located under the Cook glacier (Nougier, 1970a). Owing a main morphology of ending flow at the eastern coast of the Foch island, the same eruptive center is strongly expected for producing the section 7 lava pile. The ENE flow sense that can be inferred using the imbri-cation for section 7 agrees better with these observations. Keeping the same interpretation
of flow sense, an eruptive center located in the neighborhood of the Soci´et´e de g´eographie peninsula cannot be totally excluded for that section.
Figure 8 displays the supposed eruptive center and volcanic province limits and summa-rizes the flow interpretation of each section. It also includes the preliminary interpretation of section 8 (Plenier et al., 2004) as well as previous interpretations from two other localities (added in Table 2): Sections 9 (Plenier et al., 2002) and 10 (Henry et al., 2003). The NNE, E and NNE flow senses have been determined for sections 8, 9 and 10 respectively, with comparable procedures as used in this study. It is noteworthy that the emplacement sense interpreted for section 9 is opposite to the imbrication indication. This section is close to the eruptive center located under the Cook glacier and presents a main dip to the E. The results of this lava pile thus strongly confirm that the imbrication is not always reliable for deducing sense of flow.
Although the lavas did not always follow a straight line during emplacement, the flow directions interpreted at each section allow refining the location of the corresponding eruptive center. This is particularly true for the northern sections, which constrain the localisation of the eruptive center expected by Nougier (1970a) in the southwestern part of the Loranchet peninsula. The combination of the 4, 6, 8, and 9 lava piles results confirms the location of an eruptive center under the Cook glacier. Section 7, belonging to the same volcanic province, may as well have its source located in the neighborhood of the Soci´et´e de g´eographie peninsula. Finally, the flow in section 10 defines an eruptive center in the Gaby Island direction. Section 5, however, is too close to the expected Montagnes Vertes eruptive center to be helpful in its precise localisation.
7 CONCLUSION
Magnetic fabric represents a reliable tool for studying emplacement conditions of lava flows. Because of an important scattering of the data, its interpretation implies the use of three different methods (statistical at flow and section scales and study of density contour diagrams of AMS data) and has to be based on a large number of samples. Owing to local flow
deviations relative to the mean slope, these samples have to be taken in several different flows to average the effects of these deviations. Combining the AMS results, two alternative flow directions for each section can be confidently obtained. It is then possible to use the imbrication of the vertical axis or the symmetry of the axes distribution to choose between the two alternatives. In that study, however, these two indicators failed to confidently select between the two flow directions. Unfortunately, the shape preferential orientations of mineral phases obtained from thin sections analysis are prone to the same uncertainties than the AMS data and cannot be used confidently to make a choice. Therefore, geomorphological and geological arguments were key information for specifying the direction and sense of flow. Our interpretation of emplacement sense is ENE for sections 2, 3, 4, and 7, NE for section 1, and ESE for section 6. Even though the lavas may not flowed straight from their eruptive center during emplacement, the results of this study allow to more precisely locate their respective sources.
ACKNOWLEDGMENTS
We are grateful to the ”Institut Polaire Paul Emile Victor” for providing all transport facilities and for the support of this project. Special thanks to Alain Lamalle, Roland Pagny and all our field friends. We thank Mireille Perrin for her help during sampling, Michel Pr´evot for scientific discussions, Charles Aubourg for reading the first version of this manuscript and two anonymous reviewers for their helpful comments. We also thank Christophe Nevado for preparing the thin sections. This work was partially supported by CNRS-INSU programme int´erieur Terre.
20 km
69°30' E
49°30' S
5
Ice Quaternary deposits Plio-quaternary Strato-volcanoes Plutonic complexes Tertiary flood basaltsMontagnes Vertes Nuageuses islands
6
9
8
3
2
1
10
Gaby island Cook Sté de géographie7
4
150 400 300 200 100 0 0 200 400 600 00 200 400 600 50 100 Su sce p ti b ili ty (a rb it ra ry u n it s) Temperature (°C) Temperature (°C) Su sce p ti b ili ty (a rb it ra ry u n it s) Flow Tem10 Sample 185c Flow Ruc14 Sample 101c a) d) c) b) ilmenite lamellae titanomaghemite ilmenite 20 µm 20 µm
N N Section 1 a) n=48 N Section 5 N d) n=56 N Section 6 N e) n=49 N Section 7 N f) n=24 N N Section 2 b) n=51 N Section 3 N c) n=55
Se c ti o n 1 N N N N n =27 1 -4 9 -1 2 1 3 -1 6 n =27 n =28 n =28 5 -8 Se c ti o n 2 N N N 3 -7 8 -1 2 1 3 -1 8 n = 3 6 n = 3 8 n = 3 5 Se c ti o n 3 N N N N 1 -5 6 -1 0 1 1 -1 5 1 6 -2 0 n =36 n =32 n =33 n =32 Se c ti o n 4 N 1 -3 n = 1 8 N 4 -6 n = 1 9 N N VA-VD VE-VH 1 -4 5 -8 n =26 n =25 n =24 n =24 Se c ti o n 5 N N Se c ti o n 6 N N N 1 -3 4 -6 7 -9 n = 2 1 n = 2 1 n = 2 1 Se c ti o n 7 N N N 1 -6 7 -1 2 1 3 -1 8 n =29 n =29 n =23
0 1. 0 1. 14 1. 27 1. 0 0. 0 1. 0 P ’ T N N 1. 0 1. 14 1. 2 P ’ T N 1. 0 1. 14 1. 2 1. 0 0. 0 1. 0 P ’ T N 1. 0 1. 14 1. 27 1. 0 0. 1. 0 P ’ T N 1. 0 1. 14 1. 2 1. 0 0. 0 1. 0 P ’ T N 1. 0 1. 14 1. 27 1. 0 0. 0 1. 0 P ’ T Section 1 Section 3 Section 2 Section 4 Section 5 Section 6 n=99 n=63 n=133 n=37 n=109 n=110 N 1. 0 1. 14 1. 27 1. 0 0. 0 1. 0 P ’ T Section 7 n=81 1. 0 0. 0 1. 0
N kmax N Section 1 N kmin N
n=110
N kmax N Section 2 N kmin N
n=109
N kmax N Section 3 N kmin N
n=133
N kmax N Section 4 N kmin N
n=37
N kmax N Section 5 N kmin N
n=99
N kmax N Section 6 N kmin N
n=63
N kmax N Section 7 N kmin N
0° Plagioclases Opaques 2 cm a) 0° mode : 15.76% mode : 2.49% SR : 1.05 SR : 1.12 b) 0° 0° mode : 30.40% mode : 19.52% SR : 1.02 SR : 1.05 c) 0° 0° mode : 5.10% mode : 38.59% SR : 1.06 SR : 1.03 d) 0° 0° mode : 3.22% mode : 1.26% SR : 1.65 SR : 3.18 0° mode : 2.52% SR : 2.59 e) e) 0° 0° mode : 17.60% mode : 37.02% SR : 1.12 SR : 1.01 f) 0° mode : 5.00% SR : 1.18 0° 0° mode : 7.82% SR : 1.15 SR : 3.58 g) mode : 1.27% 0° 0° mode : 36.68% mode : 29.60% SR : 1.05 SR : 1.04
20 km
69°30' E
49°30' S
Ice Quaternary deposits Supposed eruption centerSupposed limits of the volcanic units 1 2 3 8 5 6 9 10 7 4 Lo ran che t Foch Courbet
Table 1. Summary for Anisotropy of magnetic susceptibility results from the lava flow scale study.
Flow n/N Kmean s¯ Dec Inc E2:E1 P’ T
Section 1 (Port Christmas: 48.67◦S, 69.02◦E)
ca1 7/7 10.8 Max 1.009 292.5 1.9 7.7/9.4 1.018 -0.11 Int 0.999 23.4 24.7 9.3/18.3 Min 0.992 198.3 65.3 5.6/19.5 ca2 7/7 11.7 Max 1.004 112 17.2 5.6/36.7 1.007 -0.04 Int 1.000 18.4 11.5 29.4/35.3 Min 0.996 256.1 69.1 12.2/27.9 ca3 6/7 11.4 Max 1.003 292.4 6.8 11.7/73.2 1.008 0.57 Int 1.001 202.0 3.9 23.3/85.3 Min 0.995 82.7 82.2 12.5/25.0 ca6 7/7 8.4 Max 1.008 330.3 1.7 8.3/20.8 1.015 -0.10 Int 0.999 60.7 15.0 16.0/21.0 Min 0.993 234.0 74.9 7.9/16.6 ca7 7/7 8.5 Max 1.007 209.5 21.7 8.1/30.5 1.016 0.10 Int 1.000 300.1 1.6 26.5/37.8 Min 0.992 34.1 68.2 8.8/34.6 ca14 7/7 14.5 Max 1.003 320.5 11.9 8.8/12.9 1.007 0.31 Int 1.001 219.2 42.8 10.6/20.1 Min 0.996 62.6 44.8 8.6/21.0 ca16 7/7 12.9 Max 1.009 160.9 1.3 6.5/21.3 1.020 0.18 Int 1.001 251.4 19.6 9.3/21.2 Min 0.990 67.3 70.3 6.3/9.4 Whole 7/16 11.0 Max 1.005 320.4 1.1 6.1/23.8 1.010 0.28 section Int 1.001 230.3 7.6 9.5/24.4 Min 0.995 58.3 82.4 5.9/10.8
Section 2 (Mont des Ruches: 48.87◦S, 68.91◦E)
Ruc6 8/8 14.1 Max 1.016 164.9 7.0 8.3/14.7 1.031 -0.19
Int 0.998 257.8 22.5 8.9/14.1 Min 0.986 58.7 66.3 11.9/16.4
Flow n/N Kmean s¯ Dec Inc E2:E1 P’ T Ruc8 8/8 14.2 Max 1.022 148.9 9.5 10.2/79.4 1.064 0.72 Int 1.014 240.8 11.2 13.2/83.1 Min 0.965 19.6 75.3 8.4/14.5 Ruc9 9/11 31.9 Max 1.014 164.0 12.4 10.0/21.8 1.025 -0.36 Int 0.997 65.5 33.6 20.8/44.9 Min 0.989 271.3 53.5 11.8/43.6 Ruc12 7/7 28.4 Max 1.015 123.9 20.0 7.8/16.4 1.032 0.10 Int 1.001 30.4 9.6 15.8/31.6 Min 0.984 276.2 67.6 7.2/32.3 Ruc13 7/7 29.6 Max 1.017 123.2 20.2 14.9/90.0 1.033 -0.13 Int 0.999 216.6 9.1 31.6/90.0 Min 0.985 329.6 67.7 22.0/38.0 Ruc14 6/7 15.7 Max 1.017 197.1 58.7 10.9/33.2 1.034 -0.03 Int 1.000 320.8 18.6 14.9/43.4 Min 0.983 59.5 24.2 13.1/28.8 Ruc15 6/7 8.4 Max 1.015 230.9 19.0 11.1/49.8 1.040 0.52 Int 1.006 140.9 0.1 10.0/48.5 Min 0.978 50.7 71.0 10.6/17.5 Whole 7/18 18.5 Max 1.013 155.2 14.1 7.2/21.5 1.028 0.20 section Int 1.002 247.6 9.6 11.5/22.7 Min 0.986 10.7 72.9 7.0/13.2
Section 3 (Mont des Tempˆetes: 48.88◦S, 69.11◦E)
Temp1 6/7 17.5 Max 1.017 162.4 12.5 7.5/27.0 1.050 0.69 Int 1.010 254.9 11.1 6.9/27.1 Min 0.972 25.2 73.2 4.9/8.8 Temp4 7/7 4.1 Max 1.004 327.4 1.0 15.5/26.5 1.008 -0.08 Int 1.000 57.6 15.4 22.8/44.0 Min 0.996 233.8 74.6 14.7/42.6 Temp6 5/5 3.3 Max 1.001 18.5 8.5 26.0/53.4 1.003 0.23 Int 1.000 109.4 6.3 27.3/53.8
Flow n/N Kmean s¯ Dec Inc E2:E1 P’ T Min 0.998 235.6 79.4 21.5/31.7 Temp11 7/7 16.8 Max 1.009 200.0 9.8 31.6/42.5 1.018 0.07 Int 1.000 290.7 4.1 34.9/41.9 Min 0.991 42.8 79.3 33.3/35.4 Temp12 7/7 9.9 Max 1.022 184.8 3.3 11.0/90.0 1.046 0.12 Int 1.002 93.4 23.5 37.1/90.0 Min 0.977 282.4 66.3 11.7/46.1 Temp17 7/7 19.2 Max 1.003 163.6 8.4 20.8/62.6 1.007 0.25 Int 1.001 70.7 19.2 25.6/68.3 Min 0.996 276.1 68.9 23.7/37.8 Temp18 8/8 13.4 Max 1.006 337.4 8.2 11.6/22.7 1.011 -0.24 Int 0.999 243.2 27.1 22.7/43.6 Min 0.995 82.8 61.5 11.9/42.7 Temp20 8/8 6.0 Max 1.028 167.6 14.3 10.4/11.6 1.050 -0.51 Int 0.992 275.5 50.4 13.0/44.5 Min 0.981 66.9 36.0 9.0/45.4 Whole 8/20 9.8 Max 1.011 171.2 9.3 6.9/18.3 1.021 -0.15 section Int 0.999 261.7 3.2 14.1/21.5 Min 0.990 10.4 80.1 7.1/17.8
Section 5 (Mont Amery: 49.29◦S, 70.06◦E)
VA 6/6 53.3 Max 1.024 84.3 25.7 15.0/16.6 1.044 -0.41 Int 0.994 334.4 35.2 16.8/55.8 Min 0.982 201.8 43.8 13.0/57.2 VE 6/6 33.1 Max 1.011 15.3 6.2 13.5/62.0 1.029 0.58 Int 1.005 281.2 32.9 24.4/65.2 Min 0.984 114.8 56.4 12.4/24.5 VF 6/6 25.2 Max 1.017 10.3 2.2 11.1/30.8 1.040 0.30 Int 1.004 279.9 9.6 17.3/33.8 Min 0.979 113.3 80.2 8.5/21.2 Ame3 7/7 51.4 Max 1.025 346.8 10.5 6.1/19.3 1.069 0.64
Flow n/N Kmean s¯ Dec Inc E2:E1 P’ T Int 1.013 79.9 16.2 7.2/20.3 Min 0.962 225.1 70.5 6.1/9.3 Ame4 7/7 23.5 Max 1.028 149.7 62.2 14.5/18.1 1.053 -0.35 Int 0.994 328.2 27.8 12.6/45.0 Min 0.978 58.6 0.6 13.9/42.6 Ame5 7/7 23.2 Max 1.018 329.0 11.5 10.3/26.1 1.033 -0.31 Int 0.997 61.0 9.6 23.6/34.2 Min 0.986 189.8 75.0 12.0/33.1 Ame6 7/7 14.8 Max 1.021 151.9 8.1 5.1/11.6 1.041 -0.25 Int 0.997 14.9 79.0 11.7/25.5 Min 0.982 243.0 7.4 4.6/25.6 Ame7 5/7 31.4 Max 1.032 163.7 0.7 4.3/7.9 1.061 -0.29 Int 0.994 253.8 7.3 4.3/21.0 Min 0.974 68.5 82.7 6.6/21.1 Ame8 7/7 24.2 Max 1.011 315.7 9.4 8.2/12.8 1.024 0.25 Int 1.002 222.2 20.4 7.1/13.2 Min 0.987 69.2 67.3 7.0/13.2 Whole 9/16 28.4 Max 1.012 334.0 2.3 7.0/14.1 1.022 0.34 section Int 0.998 64.5 13.7 13.6/29.5 Min 0.990 234.6 76.1 7.0/29.0
Section 6 (Port Raymond: 49.34◦S, 69.80◦E)
ra2 7/7 22.6 Max 1.026 110.1 5.6 1.7/5.3 1.047 -0.56 Int 0.992 15.4 39.8 1.8/16.5 Min 0.982 206.7 49.7 5.2/16.5 ra3 7/7 50.7 Max 1.023 114.8 0.3 8.3/28.2 1.052 0.30 Int 1.005 204.9 20.4 29.8/46.9 Min 0.973 24.0 69.6 7.9/45.9 ra5 7/7 69.7 Max 1.028 113.9 8.7 7.6/10.7 1.050 -0.62 Int 0.990 13.6 49.3 10.0/56.6 Min 0.982 211.1 39.3 9.1/56.6
Flow n/N Kmean s¯ Dec Inc E2:E1 P’ T ra6 7/7 52.6 Max 1.026 274.5 2.2 10.4/32.9 1.070 0.60 Int 1.012 183.6 23.6 13.7/31.9 Min 0.962 9.5 66.3 6.9/17.1 ra7 7/7 42.4 Max 1.012 278.1 13.6 11.4/43.1 1.033 0.561 Int 1.006 181.1 26.9 15.5/44.7 Min 0.982 32.2 59.3 13.3/18.4 ra8 7/7 40.4 Max 1.018 272.6 10.2 7.0/14.0 1.044 0.38 Int 1.005 175.4 34.8 4.4/14.2 Min 0.976 16.6 53.3 5.4/7.7 ra9 7/7 42.7 Max 1.015 146.2 14.5 19.2/59.3 1.030 0.06 Int 1.000 55.8 1.6 23.6/60.0 Min 0.985 319.7 75.4 17.4/24.6 Whole 7/9 44.1 Max 1.020 112.1 3.5 4.8/7.8 1.040 0.02 section Int 1.000 203.5 22.4 7.8/98 Min 0.980 13.7 67.3 4.8/9.8
Section 7 (Mont Bureau: 48.97◦S, 69.35◦E)
fa3 5/7 27.2 Max 1.013 36.0 27.2 9.2/31.3 1.033 0.53 Int 1.005 295.8 19.0 13.6/32.0 Min 0.982 175.3 55.9 7.4/16.2 fa6 4/7 46.1 Max 1.014 348.4 40.9 9.9/31.6 1.028 0.04 Int 1.000 249.0 10.6 20.3/36.5 Min 0.986 147.4 47.2 23.6/33.1 fa7 5/7 6.4 Max 1.021 219.0 18.4 1.8/13.0 1.037 -0.65 Int 0.993 313.4 13.1 13.1/45.0 Min 0.987 77.0 67.1 3.3/44.9 fa8 4/7 37.0 Max 1.021 229.2 19.8 7.5/21.5 1.039 -0.40 Int 0.995 137.4 5.0 20.2/87.6 Min 0.984 33.9 69.5 9.5/76.5 fa10 6/7 14.3 Max 1.014 255.3 15.6 14.3/65.0 1.037 0.50 Int 1.006 350.0 16.4 25.1/63.7 Min 0.980 124.1 67.1 15.7/23.1
Flow n/N Kmean s¯ Dec Inc E2:E1 P’ T
Whole 5/18 19.7 Max 1.012 231.5 7.4 11.7/24.5 1.026 0.24
section Int 1.002 325.3 26.7 14.6/24.8
Min 0.986 127.3 62.1 10.1/16.0
n/N is the number of sample per data-set/total number of samples collected or the number of flow used/total number of flows collected. Kmean is the mean volume susceptibility (x10ˆ-3). ¯sis the eigenvalue of normalized mean susceptibility tensor. Dec and Inc are the declination and the inclination of the mean susceptibility axes, respectively. E2:E1 are the semiangles of minor and major axes of the 95% confidence ellipse determined using the bootstrap statistic (Constable & Tauxe, 1990), respectively. P’ and T are the corrected degree of anisotropy and the shape factor parameters respectively (Jelinek, 1981). The lava flows are labelled upward.
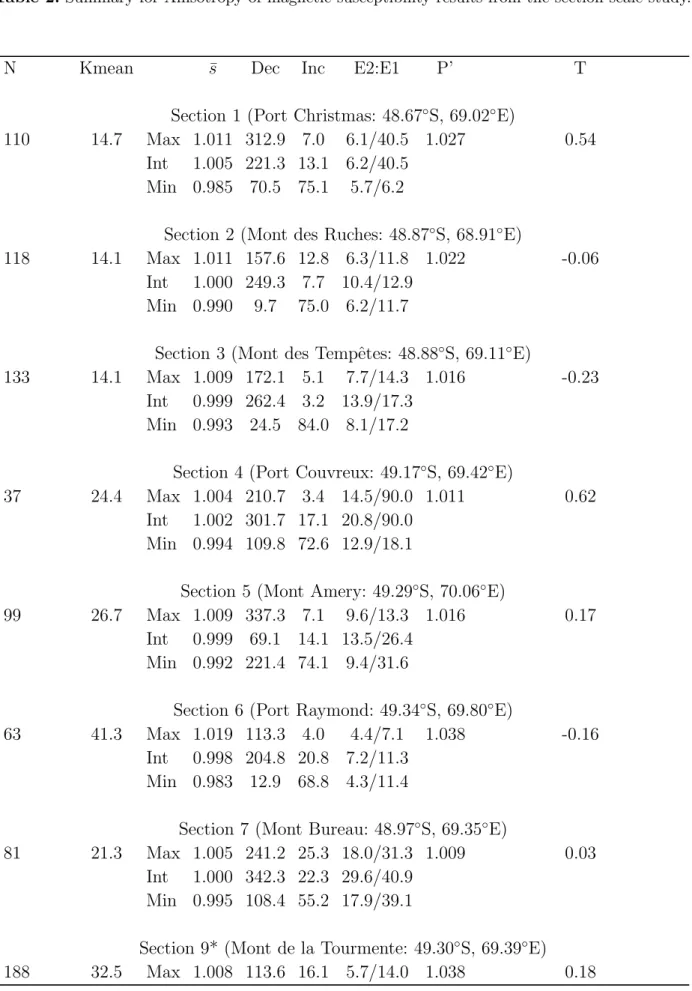
Table 2. Summary for Anisotropy of magnetic susceptibility results from the section scale study.
N Kmean s¯ Dec Inc E2:E1 P’ T
Section 1 (Port Christmas: 48.67◦S, 69.02◦E)
110 14.7 Max 1.011 312.9 7.0 6.1/40.5 1.027 0.54
Int 1.005 221.3 13.1 6.2/40.5 Min 0.985 70.5 75.1 5.7/6.2
Section 2 (Mont des Ruches: 48.87◦S, 68.91◦E)
118 14.1 Max 1.011 157.6 12.8 6.3/11.8 1.022 -0.06
Int 1.000 249.3 7.7 10.4/12.9 Min 0.990 9.7 75.0 6.2/11.7
Section 3 (Mont des Tempˆetes: 48.88◦S, 69.11◦E)
133 14.1 Max 1.009 172.1 5.1 7.7/14.3 1.016 -0.23
Int 0.999 262.4 3.2 13.9/17.3 Min 0.993 24.5 84.0 8.1/17.2
Section 4 (Port Couvreux: 49.17◦S, 69.42◦E)
37 24.4 Max 1.004 210.7 3.4 14.5/90.0 1.011 0.62
Int 1.002 301.7 17.1 20.8/90.0 Min 0.994 109.8 72.6 12.9/18.1
Section 5 (Mont Amery: 49.29◦S, 70.06◦E)
99 26.7 Max 1.009 337.3 7.1 9.6/13.3 1.016 0.17
Int 0.999 69.1 14.1 13.5/26.4 Min 0.992 221.4 74.1 9.4/31.6
Section 6 (Port Raymond: 49.34◦S, 69.80◦E)
63 41.3 Max 1.019 113.3 4.0 4.4/7.1 1.038 -0.16
Int 0.998 204.8 20.8 7.2/11.3 Min 0.983 12.9 68.8 4.3/11.4
Section 7 (Mont Bureau: 48.97◦S, 69.35◦E)
81 21.3 Max 1.005 241.2 25.3 18.0/31.3 1.009 0.03
Int 1.000 342.3 22.3 29.6/40.9 Min 0.995 108.4 55.2 17.9/39.1
Section 9* (Mont de la Tourmente: 49.30◦S, 69.39◦E)
N Kmean s¯ Dec Inc E2:E1 P’ T Int 1.002 209.3 18.9 7.5/14.0
Min 0.990 345.9 64.8 5.7/7.5
Section 10** (Port Jeanne d’Arc: 49.57◦S, 69.84◦E)
JU1 44 Max 1.008 201.0 11.0 13.3/27.4 1.016 -0.11
Min 0.993 353.0 77.0 12.3/23.5
JU5 108 Max 1.005 283.0 3.0 5.7/30.8 1.015 0.69
Min 0.992 29.0 79.0 5.7/7.5
N is the number of sample measured. Kmean is the mean volume susceptibility (x10ˆ-3). ¯sis the eigenvalue of normalized mean susceptibility tensor. Dec and Inc are the declination and the inclination of the mean susceptibility axes, respectively. E2:E1 are the semiangles of minor and major axes of the 95% confidence ellipse determined using the bootstrap statis-tic (Constable & Tauxe, 1990) or Hext-Jelinek statisstatis-tic (section 10 only), respectively. P’ and T are the corrected degree of anisotropy and the shape factor parameters respectively (Jelinek, 1981).* and ** after Plenier et al.(2002) and Henry et al.(2003) respectively.
REFERENCES
Borradaile, G., 1988. Magnetic susceptibility, petrofabric and strain–a review, Tectonophys., 156, 1–20.
Borradaile, G. & Henry, B., 1997. Tectonic applications of magnetic susceptibility and its anisotropy, Earth-Science Reviews, 42, 49–93.
Bouchez, J., 2000. Magnetic susceptibility anisotropy and fabrics in granites, C.R. Acad. Sci. Paris, 330, 1–14.
Ca˜n´on Tapia, E. & Coe, R., 2000. Rock magnetic evidence of inflation of a flood basalt lava flow, Bulletin of Volcanologie, 64(5), 289–302.
Ca˜n´on Tapia, E., Walker, G., & Herrero-Bervera, E., 1995. Magnetic fabric and flow direction in basaltic pahoehoe lava of Xitle volcano, Mexico., J. Volcanol. Geotherm. Res., 65, 249–263. Ca˜n´on Tapia, E., Walker, G., & Herrero-Bervera, E., 1996. The internal structure of lava flows –
insights from AMS measurements I: Near-vent a’a., J. Volcanol. Geotherm. Res., 70, 21–36. Ca˜n´on Tapia, E., Walker, G., & Herrero-Bervera, E., 1997. The internal structure of lava flows
– insights from AMS measurements II: Hawaiian pahoehoe, toothpaste lava and ’a’¯a, J. of Volcanol. and Geother. Res., 76(1-2), 19–46.
dykes from the east greenland volcanic margin inferred from magnetic fabric studies, Tectono-phys., 335, 313–329.
Constable, C. & Tauxe, L., 1990. The bootstrap for magnetic susceptibility tensors., J. Geophys. Res., 95(8), 383,395.
Doucet, S., Weis, D., Scoates, J., Nicolaysen, K., Frey, F., & Giret, A., 2002. The depleted mantle component in Kerguelen Archipelago basalts: Petrogenesis of tholeiitic-transitional basalts from the Loranchet Peninsula., J. Petrol., 43, 1341–1366.
Dragoni, M., Lanza, R., & Tallarico, A., 1997. Magnetic anisotropy produced by magma flow: theoritical model and experimental data from Ferrer dolerite sills (Antarctica), Geophys. J. Int., 128, 230–240.
Ferr´e, E. C., Bordarier, C., & Marsh, J., 2002. Magma flow inferred from AMS fabrics in a layered mafic sill, Insizwa, South Africa, Tectonophys., 354, 1–23.
Frey, F., Weis, D., Yang, H.-J., Nicolaysen, K., Leyrit, H., & Giret, A., 2000. Temporal geochem-ical trends in Kerguelen Archipelago basalts: evidence for decreasing magma supply from the Kerguelen plume., Chem. Geol., 164, 61–80.
Geoffroy, L., Callot, J., Aubourg, C., & Moreira, M., 2002. Magnetic and plagioclase linear fabric discrepancy in dykes: a new way to define the flow vector using magnetic foliation, Terra Nova, 14, 183–190.
Giret, A., 1986. G´eologie des Terres Australes Fran¸caises., C.N.F.R.A., 58, 17–41.
Giret, A., 1990. Typology, evolution, and origin of the Kerguelen plutonic series, Indian ocean: a review., Geol. J., 25, 239–247.
Glen, J., Renne, P., Milner, S., & Coe, R., 1997. Magma flow inferred from anisotropy of magnetic susceptibility in the coastal Paran`a-Etendeka igneous province: Evidence for rifting before flood volcanism, Geology, 25(12), 1131–1134.
Gr´egoire, V., de Saint Blanquat, M., N´ed´elec, A., & Bouchez, J., 1995. Shape anisotropy versus magnetic interactions of magnetite grains: experiments and application to AMS in granitic rocks, Geophys. Res. Lett., 22(20), 2765–2768.
Hargraves, R., Johnson, D., & Chan, C., 1991. Distribution anisotropy: The cause of AMS in igneous rocks?, Geophys. Res. Lett., 18, 2193–2196.
Harvey, P. & Laxton, P., 1980. The estimation of finite strain from the orientation distribution of passively deformed linear markers: eigenvalue relationships, Tectonophys., 70, 285–307. Henry, B., 1980. Contribution `a l’´etude des propri´et´es magn´etiques de roches magmatiques des
Alpes: Consequences structurales, r´egionales et g´en´erales, Ph.D. thesis, Paris, 528 pp.
Henry, B. & Plessard, C., 1997. New palaeomagnetic results from the Kerguelen Islands, Geophys. J. Int., 128(1), 73–83.
Henry, B., Plenier, G., & Camps, P., 2003. Post-emplacement tilting of lava flows inferred from magnetic fabric study: the example of Oligocene lavas in the Jeanne d’Arc Peninsula (Kerguelen Islands), J. of Volcanol. and Geother. Res., 127, 153–164.
Herrero-Bervera, E., Ca˜n´on Tapia, E., Walker, G., & Tanaka, H., 2002. Magnetic fabrics study and inferred flow directions of lavas of the Old Pali Road, O’ahu, Hawaii, J. of Volcanol. and Geother. Res., 118, 161–171.
Hext, G., 1963. The estimation of second-order tensors, with related tests and designs., Biometrika, 50, 353–373.
Hrouda, F., 1982. Magnetic anisotropy of rocks and its application in geology and geophysics., Geophys. Surv., 5, 37–82.
Jeffery, G., 1922. The motion of ellipsoidal particles immersed in a viscous fluid, Proc. R. Soc. London, 102, 161–179.
Jelinek, V., 1978. Statistical processing of magnetic susceptibility measured in groups of specimens., Stud. Geophys. Geod., 22, 50–62.
Jelinek, V., 1981. Characterization of the magnetic fabric of rocks, Tectonophys., 79, T63–T67. Knight, M. & Walker, G., 1988. Magma flow directions in flows of the Koolau Complex, Oahu,
determined from magnetic fabric studies, J. Geophys. Res., 93, 4308–4319.
Kolofikova, O., 1976. Geological interpretation of measurement of magnetic properties of basalts on example of the chribsky les lava flow of the Veljy Roudny volcano (Nizky Jesenik Mts.)(in Czech.), Cas. Mineral. Geol., 21, 387–396.
Launeau, P. & Bouchez, J., 1992. Mode et orientation pr´ef´erentielle de forme des granites par analyse d’images num´eriques, Bull. Soc. g´eol. France, 163(6), 721–732.
Launeau, P. & Robin, P., 1996. Fabric analysis using the intercept method, Tectonophys., 267, 91–119.
Leyrit, H., Bardintzeff, J., Verdier, O., Giret, A., & Brousse, R., 1990. Les presqu’ˆiles Jeanne d’Arc et Ronarc’h : zone test pour une cartographie g´eologique au 1/100 000 des ˆiles Kerguelen, Compt. Rend. Acad. Sci. Paris, 311(II), 561–566.
Lienert, B., 1991. Monte Carlo simulation of errors in the anisotropy of magnetic susceptibility: a second-rank symmetric tensor., J. Geophys. Res., 96, 19,539–19,544.
Merle, O., 1998. Internal strain within lava flows from analogue modelling, J. of Volcanol. and Geother. Res., 81, 189–206.
Morris, A., 2000. Magnetic fabric and palaeomagnetic analyses of the Plio-Quaternary calc-alkaline series of Aegina Island, South Aegean volcanic arc, Greece, Earth Planet. Sci. Letts., 176, 91– 105.
basalts from the Kerguelen Archipelago, southern Indian Ocean: implications for Cenozoic eruption rates of the Kerguelen plume., Earth Planet. Sci. Letts., 174, 313–328.
Nougier, J., 1970. Contribution a l’´etude g´eologique et g´eomorphologique des ˆiles Kerguelen, C.N.F.R.A., 27, 440pp and 256pp, 2 tomes.
Nougier, J., 1970. Terres Australes et Antarctique Fran¸caises (T.A.A.F.), Kerguelen Islands recon-naissance map, 1:200 000, Instit. Geograph. Nat’l., Paris.
Plenier, G., Camps, P., Henry, B., & Nicolaysen, K., 2002. Palaeomagnetic study of Oligocene (24-30 Ma) lava flows from the Kerguelen Archipelago (southern Indian Ocean): directional analysis and magnetostratigraphy, Phys. Earth Planet. Int., 133, 127–146.
Plenier, G., Camps, P., Coe, R., & Perrin, M., 2003. Absolute palaeointensity of Oligocene (24-30 Ma) lava flows from the Kerguelen Archipelago (southern Indian Ocean), Geophys. J. Int., 154, 877–890.
Plenier, G., Bascou, J., Gattacceca, J., Camps, P., Henry, B., & Rochette, P., 2004. An example of inverse magnetic fabric in a lava pile from the Kerguelen Archipelago (southern Indian Ocean), in preparation.
Rochette, P., Jackson, M., & Aubourg, C., 1992. Rock magnetism and the interpretation of anisotropy of magnetic susceptibility., Rev. Geophys., 30(3), 209–226.
Tarling, D. & Hrouda, F., 1993. The Magnetic Anisotropy of Rocks, Chapman and Hall, London. Tauxe, L., Gee, J., & Staudigel, H., 1998. Flow directions in dikes from AMS data: The bootstrap
way, J. Geophys. Res., 103, 17,775–17,790.
Thompson, J., Guillaume, A., & Daly, L., 1986. Paleomagnetism of the Permian volcanic rocks of Moissey (French Jura): implications for the paleofield and tectonic evolution, Geophys. J. Roy. Astr. Soc., 86, 103–117.
Ventura, G., 2001. The strain path and emplacement mechanism of lava flows: an example from Salina (southern Tyrrhenian Sea, Italy), Earth Planet. Sci. Letts., 188, 229–240.
Weis, D. & Giret, A., 1994. Kerguelen plutonic complexes: Sr, nd, pb isotopic study and inferences about their sources, age and geodynamic setting., Mem. Soc. G´eol. Fr., 166, 47–59.
Weis, D., Damasceno, D., Frey, F., Nicolaysen, K., & Giret, A., 1998. Temporal isotopic variations in the Kerguelen plume: evidence from the Kerguelen Archipelago., Miner. Mag., 62A, 1643– 1644.
Yang, H.-J., Frey, F., Weis, D., Giret, A., Pyle, D., & Michon, G., 1998. Petrogenesis of the flood basalts forming the northern Kerguelen Archipelago: Implications for the Kerguelen plume., J. Petrol., 39(4), 711–748.
Zhu, R., Shi, C., & Liu, Q., 2003. Anisotropy of magnetic susceptibility of Hannuoba basalt, northern China: Constraints on the vent position of the lava sequences, Geophys. Res. Lett.,