HAL Id: hal-02959507
https://hal.archives-ouvertes.fr/hal-02959507
Submitted on 6 Oct 2020HAL is a multi-disciplinary open access archive for the deposit and dissemination of sci-entific research documents, whether they are pub-lished or not. The documents may come from teaching and research institutions in France or abroad, or from public or private research centers.
L’archive ouverte pluridisciplinaire HAL, est destinée au dépôt et à la diffusion de documents scientifiques de niveau recherche, publiés ou non, émanant des établissements d’enseignement et de recherche français ou étrangers, des laboratoires publics ou privés.
Characterization of the Petrophysical Properties of the
Timahdit Oil Shale Layers in Morocco
Hanane Sghiouri El Idrissi, Abderrahim Samaouali, Younes El Rhaffari, Salah
El Alami, Yves Géraud
To cite this version:
Hanane Sghiouri El Idrissi, Abderrahim Samaouali, Younes El Rhaffari, Salah El Alami, Yves Géraud. Characterization of the Petrophysical Properties of the Timahdit Oil Shale Layers in Morocco. Geosciences, Geological Survey of Iran, 2020, 10 (9), pp.337. �10.3390/geosciences10090337�. �hal-02959507�
Characterization of the Petrophysical Properties of the
Timahdit Oil Shale Layers in Morocco
Hanane Sghiouri El Idrissi 1,*, Abderrahim Samaouali 1, Younes El Rhaffari 1, Salah El Alami 1 and Yves
Geraud 2
1 Team Thermodynamic-Energy, Energy Research Center, Department of Physics, Faculty of Science, Mohammed V
University, 4 Avenue Ibn Batouta, B.P. 1014, Rabat 10090, Morocco; abderrahimsamaouali@yahoo.fr (A.S.); ayounes1@hotmail.com (Y.E.R.); sah10.alami@gmail.com (S.E.A.)
2 National School of Geology, University of Lorraine, UMR 7359-Géo Ressources, Rue du Doyen Marcel Roudault TSA
70605, 54518 Vandoeuvre Les Nancy CEDEX, France; yves.geraud@univ-lorraine.fr * Correspondence: hanane_sghiourielidrissi@um5.ac.ma; Tel.: +212-631130044
Abstract: In this work, we study the variability of the lithological composition and organic matter content of samples were taken from the different layers M, X and Y of the Timahdit oil shale in Morocco, in order to experimentally analyze the impact of this variability on petrophysical measurements. The objective of this study is to predict the properties of the layers, including their thermal conductivity, thermal diffusivity, porosity and P and S wave velocities. The results of the study of the impact of the organic matter content of the samples on the petrophysical measurements show that, regardless of the organic matter content, thermal conductivity and diffusivity remain insensitive, while P and S wave velocities decrease linearly and porosity increases with increasing organic matter content. On the other hand, the study of the organic matter variability content is consistent with the velocity ratio, so can be used as an organic matter indicator of the layers. Conductivity and thermal diffusivity are almost invariant to the variability of the organic matter.
Keywords: Timahdit; oil shale; layers; thermal conductivity; thermal diffusivity; porosity; velocity P; velocity S; petrophysics
1. Introduction
Although “oil shale” is used to refer to fine-grained sedimentary rocks that are black, grey or brown in color, have a bitumen odor when ruptured and contain an organic material called “kerogen”, oil shale should not be confused with shale oil and shale gas. The valorization of oil shale as an alternative energy resource for fuel production is of great importance and enables consolidation of energy security and reduces the dependence on supply. Consequently, reserves exist in many countries of the world, including the United States, Russia and China.
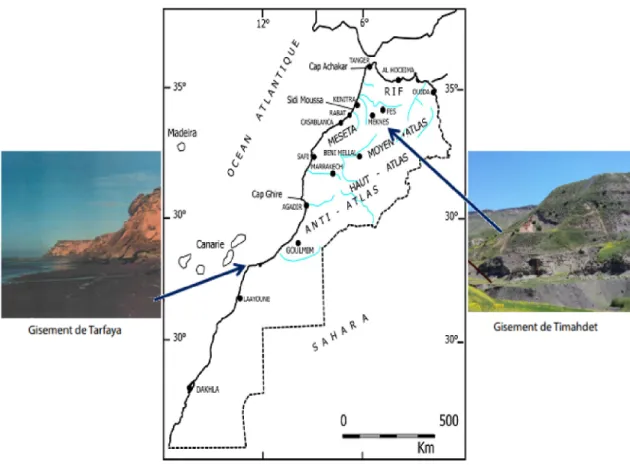
In Morocco, oil shale reserves, which account for about 15% of the world’s reserves, are divided into three deposits of different lithological composition and variable organic properties [1]. These deposits (named 3T), Figure 1 are located in the regions: Tangier, Tarfaya and Timahdit (the main site of our study). The Timahdit oil shale deposits are sedimentary rocks which contain a large amount of kerogen and, as a national alternative energy resource, the Timahdit oil shale has been the subject of numerous studies by academics and the private sector, in local and international cooperation [1–4].
These studies, which focused on methods for extracting the oil contained in shale rocks and on their physico-chemical characterization, made it possible to evaluate the volume of hydrocarbons that can be extracted by pyrolysis or direct combustion, with good energy production efficiency and a reduction in undesirable contaminants from being released into the environment. Depending on the organic matter content of the ore, a non-oxidative heat treatment at 400–500 ◦C has shown that these rocks are capable of
releasing hydrocarbon-rich oils: the production of a barrel of oil from Timahdit oil shales will require 2 to 3 tons of rock, on average [5,6].
While the results obtained by chemical approaches are conclusive as to the ability of Timahdit oil shales to release oils by pyrolysis, the development of a physical approach based on the analysis of their petro-physical behavior is of practical importance in determining their energetic character. This is the context of our study: the petrophysical properties are determined by measurements on samples taken from the different M, X and Y layers of the deposit and are dependent on the variability of the lithological composition of the oil shale layers and their organic matter content. For each dry layer, five samples were used to determine thermal conductivity λ, thermal diffusivity D, seismic compressional wave propagation velocities Vp, shear wave propagation velocities Vs, and porosity. Conductivity and thermal diffusivity were determined
by the Conductivity Scanner Method (TCS), P and S wave propagation velocities by Ultrasonic Testing (UTM), and porosity by mercury injection. A comparison of the results of the petrophysical behavior of the different layers highlighted the usefulness of these parameters, which could possibly be used as indicators of the organic matter content of the layers.
2. Study Area
2.1. Geological Description
Located in a mountainous volcanic region of the Moroccan Middle Atlas (Figure 2), the Timahdit site (33.24◦ N, 5.06◦ W and 1800 m above sea level) covers an area of 1000 km2 with a warm temperate climate,
2.4 ◦C in winter to 21.7 ◦C in summer. The geological age of the oil shales ranges from Cambrian to Tertiary
[7,8]. Reference [9] indicated that low hydrocarbon yields and high capital costs may be associated with extracting oil from the Timahdit oil shales. The Timahdit oil shale kerogen is mainly composed of organic matter, the basic analysis of which gives the atomic ratios H/C = 1.31 and O/C = 0.10, which is characteristic of a type II kerogen [6]. Depending on their position in relation to the stratification plane, oil shales are generally composed of four types of layers, known by the designations: M, X, Y and T. As they move from one layer to another, the variation in the organic matter content they contain generates a variation in the quantity of oil that can be extracted.
2.2. Sampling
In order to study the petrophysical behavior of the rock, blocks with a mass of 2 to 4 kg were taken from the various layers of the deposit (Figure 3). These samples were taken in March 2017 and the analysis was carried out in April 2017 at the Laboratory of the University of Lorraine (Ecole Nationale Supérieure de Géologie in Nancy, France).
Using a water-cooled electric saw, samples measuring 5 cm × 3.5 cm × 5 cm were obtained by cutting boulders from the three layers M, X and Y. For the study of the dry shale, five samples per layer were dried under ventilation for 48 h in an electric oven, at a constant temperature of 75 ◦C. Fifteen samples were, thus,
prepared for testing. 3. Materials and Methods
The different lithologies of the sedimentary layers making up oil shales lead to a variability in their intrinsic properties (mineralogy, rigidity, porosity, permeability, grading, anisotropy, etc.). To this variability is added the natural action of diverse, surrounding phenomena, such as geological, hydrogeological, tectonic and seismic factors. The establishment of a disparity in their organic matter content could lead to a difference in their petrophysical behavior. A study of the thermal (thermal conductivity λ and thermal diffusivity D), acoustic (seismic wave propagation velocities Vp and Vs) and Mercury P injection porosity
properties of the different layers will make it possible to highlight the degree of possible difference in their behavior as a function of their organic matter content. To this end, we have used the Thermal Conductivity Scanner Method (TCS) to study the thermal properties, the Ultrasonic Test Method (UTM) to study the acoustic properties and, finally, the Mercury injection method to study porosity. These three methods were carried at the Nancy Geophysics Laboratory [10–14].
3.1. Thermal Conductivity Scanner Method (TCS)
The TCS method is based on the variety of surface temperatures of a sample, due to a known and controlled heat input [15]. This high-precision method, which uses an optical scanner, was developed by Professor Yuri Popov (Moscow National Academy of Geological Prospecting) as a new method applied in Earth science and thermal physics [16–19]. The meter used consists of a portable unit that supports two sensory heat sensors and a temperature source with controlled intensity, with a maximum displacement of the moving part is 65 cm (Figure 4). The temperature is measured before and after exposure to heat. The constant distance between the heat source (so that a rate of movement moves at a constant velocity speed V = 4.99 mm/s of the portable device) and the temperature sensors, together with a constant rate of movement of the handheld unit and the temperature sensors, allows the temperature rise of the sample to be related to its thermal conductivity λ and thermal diffusivity D. The range of measurable thermal
conductivities is between 0.2 and 70 W/m × K, the measurement error is less than 3% [12,18,20,21], the measurable thermal diffusivity is between 0.6 and 3.0 × 10⁻⁶ m2 s−1 and the measurement error is less than
5% [19]. To make the measurements, the samples were simply placed on the device and both currents were recorded. The result is detected as the action of the thermal conductivity change patterns and the thermal diffusivity D for the thickness of the sample.
3.2. Ultrasonic Test Method (UTM)
The technique for measuring the velocities of the ultrasonic waves in the materials consists of producing a non-destructive vibration wave on one side of the material under study for a certain period of time. The measurement method used in our study was a signal transceiver from a Proceq Pundit Lab device, which complies with European Standard EN 12504-4. The frequency used for the measurement of Vp and Vs
was 250 kHz. As the wave propagates, it passes through a length L in the sample, the resolution is 0.1 µs, the optimized power supply pulse 250 V, the non-volatile memory is >500 measured values and the pulse velocity measurements are affected by different factors. They are well described in SB 1881: Part 203, where the moisture content of concrete and temperature are two key factors [23], then the vibration pulse is
converted into an electrical signal using a receiver (transducer). As soon as the measured value remains stable for 3 s, a beep sounds and the propagation velocity V = L/τ of the ultrasonic wave is displayed. The waves emitted into the sample are the longitudinal compression wave P, called the primary wave, representing the vibration of the particles parallel to the direction of propagation of the wave, and the transverse shear wave S, called the secondary wave, representing the vibration of the particles perpendicular to the direction of propagation [24]. They used the well-known relationship between Vs and compression
wave velocity Vp [25].
3.3. Mercury Injection Porosity
The method of measuring the high pressure depends on the phenomenon of the capillary depression of mercury, where mercury leaks into the pores under pressure. The amount of mercury leaking into the porosity system is generally interpreted as the total pore volume of the sample being measured. The
measurements are carried out on a Micromeritics AutoPore II 922O porosimeter which is characterized by an accuracy of ±1% [26]. The relationship between the actual pressure P and the radius of the porous cylinder R is expressed in the Washburn Equation (1) [27]:
2σ cos Φ
P = (1)
R
where P (Pa) is mercury pressure, R (nm) is the radius of the capillary tube or the distance of the pore walls in slit-shaped pore, σ is the surface tension of mercury (480 × 10−3 N m−1) and Φ is the contact angle (141.3◦) for
the non-wetting fluid.
These porosity measurements were performed using a device called an Auto Pore IV 9500 V1.09 Serial:825 which allows the injection of mercury at pressures between 0.0036 and 219.978 MPa. The access threshold is, therefore, between 341.7016 and 0.00566 µm. This technique determines the connected pore volume and its distribution as a function of the injection pressure and access thresholds. The samples were dried at 60 ◦C for 48 h, weighed and placed in an injection cell. After a degreasing step under a mercury
vacuum of 50 µmHg, the injection cell was filled with mercury, then the vacuum was gradually broken down to atmospheric pressure. The volume of mercury injected into the sample was measured for low pressures (between 0.0036 and 0.2739 MPa) and high pressures (between 0.2739 and 219.978 MPa). The pressure increases were carried out in steps; after each step, the volume of mercury injected is measured. From these data, it is possible to determine the saturation curve as a function of the injection pressure. The
measurement precision is about 4% [27]. 4. Results and Discussion
Due to the multitude of intrinsic properties of the different layers that make up oil shale rocks, it is almost impossible, at first glance, to detect their fuzzy boundaries or to establish the order of their
superposition in the rock. Chromatographic analyses [28] have confirmed that the classification of the layers in ascending order of their organic matter content is as follows (see Table 1).
Analyses of the Y and M layers showed that their organic matter (OM) contents are 32.3% and 31.9% for SiO2, 39.2% and 41.4% for CaO, 7.9% and 7.6% for Al2O3 and 3.4% and 2.2% for Fe2O3, respectively [9,29].
This shows that the Y layer contains more organic matter than the M layer, with the exception of the CaO molecule.
According to the experimental protocols described above, and on the basis of this classification, we determined the thermal properties (thermal conductivity λ and thermal diffusivity D) and the acoustic properties (Vp and Vs) of the three layers M, X and Y, respectively. The results obtained after processing the
measured data for the five samples have been averaged and presented in Table 2.
4.1. Thermal and Acoustic Properties of the M, X and Y Layers
Table 2 summarizes the results of the measurements of the thermal λ and D parameters, as well as the acoustic parameters Vp and Vs for the three layers M, X and Y.
Table 2 presents the results obtained from the thermal (conductivity λ and thermal diffusivity D) and acoustic (propagation velocities of the P, S waves is the velocity ratio) properties for different layers of the M oil shale, X and Y, and the mean velocities. Values ± 0.08, ±0.04, ±33, etc. on Tables 2 and 3 are the absolute uncertainties and mean deviations, calculated using Excel.
The analysis of the results obtained confirms the relevance of our measurements with regard to the stabilities of thermal conductivity λ and thermal diffusivity D which, taking into account measurement inaccuracies, remained fairly constant whichever layer was studied. Indeed, the results of the studies on the CaO and SiO2 content of the Timahdit oil shales showed that the CaO/SiO2 ratio decreases from 1.29 for the
M layer to 1.21 for the Y layer [9,29], and is also consistent with the results obtained by other researchers who have shown that when the CaO/SiO2 ratio increases, thermal conductivity and diffusivity show more
stable values [30]. The contradiction with the results found by [31,32] is essentially related to the location and experimental conditions. Based on our results we obtained by measurement, it appears that both parameters λ and D cannot be used as indicators of the organic matter content (OM).
Concerning the acoustic parameters, Vp and Vs, the results obtained show that the highest values
correspond to layer M, while the lowest values are obtained for layer Y; the values obtained for layer X are intermediate. This leads us to classify the P and S wave velocities of the layers as follows:
Vp (M-layer) > Vp (X-layer) > Vp (Y-layer) (2)
Vs (M-layer) > Vs (X-layer) > Vs (Y-layer) (3)
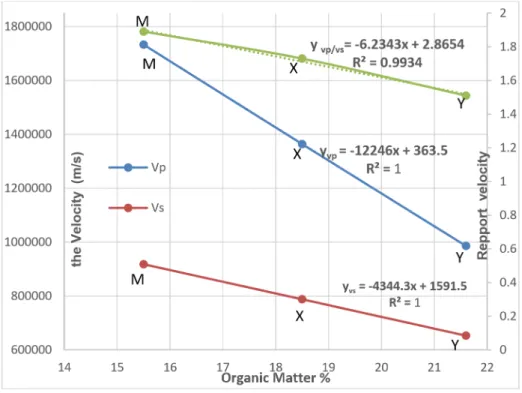
Figure 5, which shows the variations in velocities Vp and Vs as a function of the organic matter content of
layers M, X and Y, confirms that as one moves from layer M to layer Y, velocities Vp and Vs decrease. The
slope of decrease of the values of Vp is greater than that of the values of Vs.
Moreover, although the results obtained show that, for a given layer, the compression velocity (P wave) is always higher than the shear velocity (S wave), the differences between the velocities of the P wave as it passes from one layer to another are not the same as for the S wave. We used the equations and coefficients of determination R2, to measure the quality of the prediction of a linear regression such that:
yVp = −12246x + 3630.5
with a coefficient R2 = 1 and y
Vp(m × s−1); x(%)
(4)
yVs = −4344.3x + 1591.5
with a coefficient R2 = 1 and y
Vs(m × s−1); x(%)
(5)
y(Vp/Vs) = −6.2343x + 2.865 (6)
with a coefficient R2 = 0.993 and yVp/Vs(m × s−1); x(%).
Therefore, it seems to us that the ratio of velocities Vp/Vs (which is an adimensional factor) could be
more decisive as a parameter for predicting the Organic Matter content of the layers than by considering the velocity Vp and Vs, separately. Indeed, the velocities Vp and Vs contain variations of acoustic origin (related to
the K and µ modules) but also those of mineral origin (related to the density of the ρ layer). The ratio of Vp/Vs
eliminates variations of mineral origin and reflects the acoustic character of the layer better than Vp and/or
Vs. According to the values given in Table 2, the ranking of the Vp/Vs ratios are as follows:
Vp Vp Vp
(M − layer) > (X − layer) > (Y − layer) (7)
Vs Vs Vs
This ranking shows that the Vp/Vs ratio decreases significantly with OM and a determination coefficient
R2 = 0.993 (see Figure 5). The V
p/Vs ratio can, therefore, be used as an indicator of the organic matter content
4.2. Porosity and Gear Ratio Properties of the M, X and Y Layers
Table 3 summarizes the results of the velocity ratio Vp/Vs and porosity as a function of organic matter
for the three layers M, X and Y.
Table 3 presents the values obtained for mercury porosity and the ratio of acoustic velocities. For layer M we found a porosity of (10.29% ± 0.1%), for layer X a porosity of (11.94% ± 0.1%), and for layer Y a porosity of (13.83% ± 0.1%). On the other hand, the ratio of the propagation velocities Vp/Vs gives the opposite—the
high values correspond to the M layer of 1.89 while the lowest values are obtained for the Y layer at 1.51 and the X layer always remains intermediate at a value of 1.73.
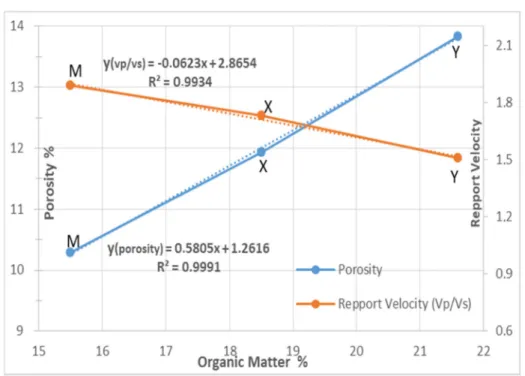
Figure 6 shows the variations in porosity and the ratio of velocities to organic matter content of the M, X and Y for three layers.
This confirms that, when moving from layer M to layer Y with the equations and coefficients of determination R2, to measure the quality of the linear regression prediction, the ratio V
p/Vs decreases (see
Figure 6).
With an equation: y(Vp/Vs) = −6.2343x + 2.865 with a coefficient R2 = 0.993.
Porosity increases with the organic matter content.
(8)
y(porosity) = +0.5805x + 0.0126 (9)
with R2 = 0.999.
The results of Figure 6 show that for the M, X and Y layers, the velocity ratio Vp/Vs decreases when the
organic matter increases. The correlation between porosity and organic matter indicates that as the porosity values increase in the rock, it is clear that the organic matter also increases. 5. Conclusions
In this work, the petro-physical properties of 15 samples were measured and analyzed. On the basis of these results, values of the organic matter content of layers M, X and Y of the Timahdit oil shale
were 15.5%, 18.5% and 21.6% respectively [28]. The analysis of the results obtained confirmed that, taking into account inaccuracies in the measurements and whichever layer was studied, the thermal conductivity λ and thermal diffusivity D remain remarkably stable, whereas from layer M to layer Y, the velocities Vp and Vs
decrease linearly, with values of Vp being systematically higher than those of Vs. The porosities show that the
values are high in relation to organic matter. An examination of the variation of the Vp/Vs ratio as a function
of the OM content shows that this variation is all the more important as the OM content is low. With reference to Wang [33], the Vp/Vs ratio is higher when it exceeds 30% calcite content for Timahdit oil shales
[29,34]. The mineralogy of the M and Y layers is 41% and 39% calcite, respectively. This confirms our results regarding the significant decrease from 1.89 to 1.51 in the Vp/Vs ratio between the M and Y layers. The Vp/Vs
ratio can, therefore, be used as an indicator of the organic matter content of the layers.
Author Contributions: Conceptualization, H.S.E.I. and A.S.; methodology, H.S.E.I. Redaction-Original draft, H.S.E.I. and Y.E.R.; software, H.S.E.I.; Resources Y.G.; Supervision A.S.; data curation, H.S.E.I. and Y.E.R.; Editing-revision and revision, H.S.E.I. and A.S.; geological positioning S.E.A. All authors have read and agreed to the published version of the
manuscript.
Funding: This research received no external funding.
Acknowledgments: This work was carried out within the framework of the Integrated Action Project PHC Toubkal/15/18 Campus France: 32427VH. We would like to express our deep gratitude to our partners from the University of Lorraine, National School of Geology, Georessources Nancy (France), for their kind scientific collaboration and participation in the development of this project.
Conflicts of Interest: The authors declare no conflict of interest.
References
1. Ambles, A.; Dupas, G.; Jacquesy, J.C.; Vitorovic, D. Chemical characterization of the kerogen from Moroccan Timahdit oil shale by analysis of oxidation products. Org. Geochem. 1988, 13, 1031–1038. [CrossRef]
2. Sadiki, A.; Kaminsky, W.; Halim, H.; Bekri, O. Fluidised bed pyrolysis of Moroccan oil shales using the hamburg pyrolysis process. JAAP 2003, 70, 427–435. [CrossRef]
3. Yang, Y.; Lu, X.; Wang, Q. Investigation on the co-combustion of low calorific oil shale and its semi-coke by using thermogravimetric analysis. ECM 2017, 136, 99–107. [CrossRef]
4. Zhou, C.; Liu, G.; Wang, X.; Qi, C. Co-combustion of bituminous coal and biomass fuel blends:
Thermochemical characterization, potential utilization and environmental advantage. Bioresour. Technol. 2016,
218, 418–427. [CrossRef] [PubMed]
5. Saoiabi, A. Contribution to the Physico-Chemical Study of the Oil Shales of Timahdit Morocco; Mohammed V University Faculty of Sciences: Rabat, Morocco, 1988.
6. Saoiabi, A. Oil shales of Timahdit (Morocco) Composition and Physicochemical Properties. Proc. Acad. Sci. Ser. IIC
Chem. 2001, 351–360. [CrossRef]
7. ONHYM. Hydrocarbure Conventionnels-Timahdite (Morocco). Available online: http://www.onhym.com/ pdf/Publications/Depliant%20Schistes%20Bitumineux (accessed on 13 July 2020).
8. Dyni, J.R. Geology and recources of some world oil-shale deposits. USGS Sci. A Chang. World 2003, 20, 223. 9. Barkia, H.; Belkbir, L.; Jayaweera, S. Non-isothermal kinetics of gasification by CO2 of residual carbon from timahdit
and tarfaya oil shale kerogens. JTAC 2004, 76, 623–632.
10. Carslaw, H.S. Conduction of Heat in Solids; Oxford University Press: Oxford, UK, 1986.
11. Yasar, E.; Erdogan, Y. Correlating sound velocity with the density, compressive strength and Young’s modulus of carbonate rocks. IJRMMS 2004, 41, 871–875. [CrossRef]
12. Rosner, M. Petrophysical Study and Modeling of the Effects of Heat Transfers between Rock and Fluid in the
Geotermic Context of Soultz-Sous-Fôrets; Louis Pasteur University: Strasbourg, France, 2007.
13. Zinszner, B. A Geoscientist’s Guid to Petrophysics; Technic: Paris, France, 2007.
14. Brotons, V.; Tomás, R.; Ivorra, S.; Grediaga, A.; Martínez-Martínez, J.; Benavente, D.; Gómez-Heras, M. Improved correlation between the static and dynamic elastic modulus of different types of rocks. Mater. Struct. 2016, 49, 3021–3037. [CrossRef]
15. Haffen, S.; Géraud, Y.; Rosener, M.; Diraison, M. Thermal conductivity and porosity maps for different materials: A combined case study of granite and sandstone. Geothermics 2017, 66, 143–150. [CrossRef]
16. Popov, Y.A.; Semionov, V.G.; Korosteliov, V.M.; Berezin, V.V. Noncontact evaluation of thermal conductivity of rocks with the aid of a mobile heat source, Izvestiya. Phys. Solid Earth 1983, 19, 563–567.
17. Popov, Y.A.; Berezin, V.V.; Semionov, V.G.; Korosteliov, V.M. Complex detailed investigations of the thermal properties of rocks on the basis of a moving point source, Izvestiya. Phys. Solid Earth 1985, 21, 64–70.
18. Popov,Y.A.; Pribnow,D.; Sass,J.H.; Williams,C.F.; Burkhardt,H.Characterizationofrockthermalconductivity by high resolution optical scanning. Geothermics 1999, 28, 253–276. [CrossRef]
19. Popov, Y.; Beardsmore, G.; Clauser, C.; Roy, S. ISRM Suggested methods for determining the thermal properties of rocks from laboratory tests at atmospheric pressure. Roches Mech. Rock Eng. 2016, 49, 4179–4207. [CrossRef] 20. Samaouali,A.ProcessofAlterationandTransferofFluidsinStonesChellah–RabatMonumentLimestone; Mohammed V
University Faculty of Sciences: Rabat, Morocco, 2011.
21. El Rhaffari, Y. Thermophysical Characterization of Building Materials: Case of the Stones of Historical Monuments of
Rabat-Morocco; Mohammed V University Faculty of Sciences: Rabat, Morocco, 2016.
22. Thermal Conductivity Scanning. Available online: http://www.tcscan.de/ (accessed on 13 July 2020).
23. Protecting the Built World with Software, Sensors and Data. Available online: https://www.proceq.com/ (accessed on 13 July 2020).
24. Mtthieu, A. Multi Sale Study of Stone de Cay by Salt Crystallization in Porous Networks; University of Cergy-Pontoise: Cergy, France, 2007.
25. Ry, R.V.; Cummins, P.; Widiyantoro, S. Shallow Shear-Wave Velocity Beneath Jakarta, Indonesia Revealed by Body-Wave Polarization Analysis. Geosciences 2019, 9, 386. [CrossRef]
26. AutoPore®V Series. Available online: https://www.micromeritics.com/Repository/Files/AutoPore_V_Series_ Specification_Sheet.pdf (accessed on 13 July 2020).
27. Rahmouni, A.; Boulanouar, A.; Boukalouch, M.; Géraud, Y.; Samaouali, A.; Harnafi, M.; Sebbani, J. Relationships between porosity and permeability of calcarenite rocks based on laboratory measurements. J. Mater. Environ. Sci. 2014, 5, 931–936.
28. Moine, E.C. New Approach to the Non-Isothermal Kinetic Study of Pyrolysis and Oxidation of Oil Shal of Morocco
29. Ziyad, M.; Garnier, J.P.P.; Halim, M. Nonisothermal kinetics of H2S and H2 generation from Timahdit oil shale. Fuel 1986, 65, 715–720. [CrossRef]
30. Kang, Y.; Morita, K. Thermal conductivity of the CaO–Al2O3–SiO2 system. ISIJ Int. 2006, 46, 420–426. [CrossRef] 31. Rajeshwar, K.; Dubow, J.; Rosenvold, R. Dependence of thermal conductivity on organic content for Green River oil
shales. Ind. Eng. Chem. Prod. Res. Dev. 1980, 19, 629–632. [CrossRef]
32. Popov, E.; Popov, Y.; Romushkevich, R.; Spasennykh, M.; Kozlova, E. Detailed Profiling Organic Carbon Content of
Oil Shales with Thermal Core Logging Technique; Sixth EAGE Shale Workshop: Bordeaux, France, 2019. [CrossRef] 33. Wang, X.Q.; Schubnel, A.; Fortin, J.; David, E.C.; Guéguen, Y.; Ge, H.K. High Vp/Vs ratio: Saturated cracks or
anisotropy effects? Geophys. Res. Lett. 2012, 39. [CrossRef]
34. Riffaud, J. Constribution to the modelling of P and S wave propagation velocities in clay sedimentary farmations.
Figure 1. Location of the main oil shale deposits in Morocco.
Figure 3. Samples of oil shale M, Y and X layers of the Timahdit deposit.
Figure 4. The thermal conductivity scanner [21,22].
Table 1. Classification of layers according to organic matter content. Diapers M X Y T Organic matter (%) 15.5 18.5 21.6
-Table 2. Physical properties of layers M, X and Y. Diapers Conductivity λ(W × m−1 K−1) Diffusivity D (ms−1) 2 Velocity VCompression p (m s−1)
Shear Velocity Vs (m s−1) The Repport Velocity Vp/Vs M 0.84 ± 0.08 0.41 ± 0.04 1733 ± 33 918 ± 29 1.89 ± 0.10 X 0.82 ± 0.08 0.45 ± 0.04 1364 ± 20 788 ± 12 1.73 ± 0.05 Y 0.82 ± 0.08 0.46 ± 0.04 986 ± 13 653 ± 6 1.51 ± 0.03
Table 3. Physical properties of layers M, X and Y. Diapers Porosity (%) Velocity Ratio (Vp/Vs)
M 10.29 ± 0.1 1.89 ± 0.10 X 11.94 ± 0.1 1.73 ± 0.05 Y 13.83 ± 0.1 1.51 ± 0.03