HAL Id: cea-02556263
https://hal-cea.archives-ouvertes.fr/cea-02556263
Submitted on 27 Apr 2020
HAL is a multi-disciplinary open access
archive for the deposit and dissemination of
sci-entific research documents, whether they are
pub-lished or not. The documents may come from
teaching and research institutions in France or
abroad, or from public or private research centers.
L’archive ouverte pluridisciplinaire HAL, est
destinée au dépôt et à la diffusion de documents
scientifiques de niveau recherche, publiés ou non,
émanant des établissements d’enseignement et de
recherche français ou étrangers, des laboratoires
publics ou privés.
Monte Carlo PENRADIO software for dose calculation
in medical imaging
Camille Adrien, Mercedes Lòpez Noriega, Guillaume Bonniaud, Jean-Marc
Bordy, Cindy Le Loirec, Bénédicte Poumarède
To cite this version:
Camille Adrien, Mercedes Lòpez Noriega, Guillaume Bonniaud, Jean-Marc Bordy, Cindy Le Loirec,
et al.. Monte Carlo PENRADIO software for dose calculation in medical imaging. Joint International
Conference on Supercomputing in Nuclear Applications + Monte Carlo (SNA + MC 2013), Oct 2013,
Paris, France. pp.01601, �10.1051/snamc/201401601�. �cea-02556263�
Monte Carlo PENRADIO software for dose calculation in medical imaging
Camille Adrien1, Mercedes Lòpez Noriega1, Guillaume Bonniaud2, Jean-Marc Bordy1, Cindy Le Loirec1, and Bénédicte
Poumarede1
1CEA, LIST, F-91191 Gif-sur-Yvette, France
2Centre de Medecine Nucleaire du Morbihan, Centre Hospitalier Bretagne Atlantique et Centre d Oncologie Saint-Yves, F-56000 Vannes,
France
The increase on the collective radiation dose due to the large number of medical imaging exams has led the medical physics community to deeply consider the amount of dose delivered and its associated risks in these exams. For this purpose we have developed a Monte Carlo tool, PENRADIO, based on a modified version of PENELOPE code 2006 release, to obtain an accurate individualized radiation dose in conventional and interventional radiography and in computed tomography (CT). This tool has been validated showing excellent agreement between the measured and simulated organ doses in the case of a hip conventional radiography and a coronography. We expect the same accuracy in further results for other localizations and CT examinations.
KEYWORDS: Monte Carlo simulation, PENELOPE, Medical Imaging, Radiation Dose
I. Introduction
The significant rise of medical imaging exams in the past few years has led to an increase in the collective dose due to irradiation.(1–3) The medical physics community agreed
that this increase must be accompanied by a strong understanding of the radiation dose and its associated risks.(4–7) A controversial article announced that around
1.5% of all cancers in the United States may be attributable to the radiation from computed tomography (CT) examinations.(5) Even if this is an overestimation, it
points out the necessity of convenient tools to evaluate the associated dose of medical radiation.
Commonly, non-individualized indices are used to estimate the radiation dose (CT dose index (CTDI), dose-length product (DLP), dose-area product (DAP), entry dose, etc . . . ). The effective dose was first introduced as a measurement of dose for radioprotection, reflecting the radiation detriment. However it is mainly used to directly compare various radiation types and exposures but doesn’t reflect the actual absorbed dose.
Several programs, devoted to a range of applications, have been developed and provide the common dose index (CTDI, DLP, dose-surface product), organ and tissue absorbed and/or effective dose.
• For conventional radiography (CR): PCXMC estimates the organ dose, the effective dose and its associated risk in CR for 29 organs and various types of numerical phantoms.(8)XDOSE and CHILDDOSE are based on the
same principle. The CALDose_X calculates the common dose index in radiology and estimates the organ doses.(9)
• For CT examinations: ImPACT, Eff-Dose(10) and Org-Dose(11) give CTDI and DLP for several CT.
Im-pactMC provides a dose delivered estimation after examination.(12) Several research teams use Monte
Carlo (MC) simulations for CT examinations.(13–16) For
instance, the Duke University Medical Center has developed a tool for estimating organ absorbed dose and effective dose based on the PENELOPE code and using adaptive anthropomorphic numerical phantoms.(16)
Most of already existing tools don’t take the person biological specificities into account and thus, only provide common dose index and effective dose rather than an actual dose delivered. Therefore our goal is not only to gather in a single software all already proposed features but also to replace common dose index with actual organ absorbed dosis. For that purpose we decided to include in a new MC tool, PENRADIO, the possibility of introducing individual specificities in order to obtain personalized results. The present MC program, dedicated to medical x-ray imaging procedures, is based on a modified version of PENELOPE code 2006 release.(17) It allows the
calcula-tion of an accurate individualized radiacalcula-tion dose in voxelized numerical phantoms. We start by presenting the tools and validation methodology for CR and interventional radiog-raphy (IR) as well as preliminary results. Then, CT tool developments are shown.
II. Method
1. The PENRADIO Software
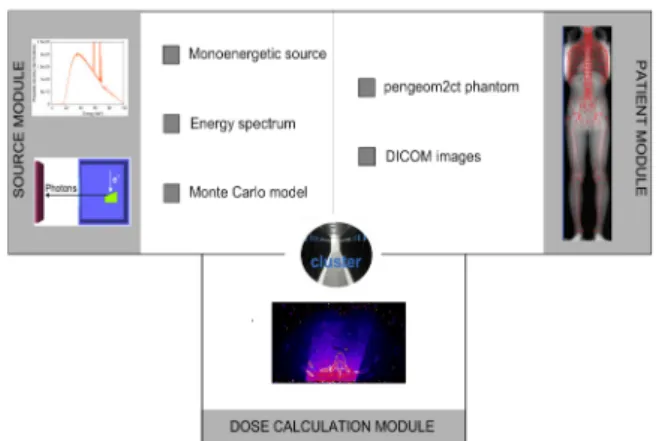
The PENRADIO software (Figure 1) is based on PENSSART, a software initially developed for safety in radiotherapy.(18)
The program uses PENELOPE code 2006 release allowing for particle transport in voxelized geometries. The PENSSART C
software is divided into three modules:
• The dose calculation module is the core of the program. It was designed to perform MC dose calculations within voxelized geometries. To add this new functionality to PENELOPE a specific main program was developed in C++. The physics initially developed in PENELOPE remain unchanged and a ray-tracing algorithm was added for efficient navigation in the voxelized geometry. Results are provided in the form of two output matrices storing the dose absorbed in the medium and the statistical uncer-tainty for each voxel. The dose absorbed in the medium can be expressed in eV/g/shower or in Gray. Normal-ization factors(19) are usually computed for simulation
results conversion to absolute dose values. We have chosen another method to determine the absolute dose values. When a phase space file (PSF) is used as an input, we can use:
Dabs,Gy=1.6 · 10−19· 1000 · Nelec· DMC,eV/g/shw (1)
with Nelecthe number of electrons corresponding to the
mAs used for the image acquisition, thus:
Nelec= A · s/1.6 · 10−19 (2)
When an energy spectrum is used, the result is given as the absorbed dose per initial photons. In addition to the number of initial electrons provided by the examination acquisition protocol, the tube yield yT X, ratio of photons
leaving the tube to initial electrons impinging the anode, has to be determined. The absolute absorbed dose can hence be obtained as follows:
Dabs,Gy=1.6 · 10−19· 1000 · Nphotons· DMC,eV/g/shw (3)
Dabs,Gy=1.6 · 10−19· 1000 · yT X· Nelec· DMC,eV/g/shw (4)
• The patient module allows the implementation of complex geometries. The user can convert quadratic geometries normally used in PENELOPE into voxelized geometries by using a routine provided in PENCT(20)
(such geometries will be called pengeom2ct phantoms1).
A conversion process to transform patient CT images into data usable by the MC dose computation module has also been implemented.(18)
• The radiation source module allows the simulation of dif-ferent kinds of radiation source going from simple sources such as monoenergetic beams to more complex sources like PSF resulting from a complete MC modeling of the x-ray tube. To generate such PSF, the module uses the PENELOPE code with a new version of the main
program PENMAIN in which the selective
bremsstrahlung splitting was implemented for simulations efficiency increase.
1F. Salvat: private communication
Figure 1: PENRADIO units and connections for dose calculation.
2. Dose calculation in CR and IR
In CR and IR information provided in the technical notes of the manufacturer is sufficient to perform a complete MC model of a X-ray tube.
2.1. Monte Carlo simulations
A CR tube (Philips DiDi TH2 CS4) and an IR tube (Philips MRC 200 0508 ROT-GS 1003) were simulated with PENELOPE according to the information provided in the technical notes. For the purpose of this study, several PSF corresponding to the maximal field size at the tube output were generated:
• two PSF for the 77 kVp and the 102 kVp of the CR tube; • five PSF: four from 70 to 85 kVp by steps of 5 kVp and
one for the 95 kVp for the IR tube.
Simulation with PENELOPE is controlled by different parameters: the absorption energies Eabs for electrons,
photons and positrons, C1 and C2 determining the mean
free path between hard elastic events and the maximum average fractional energy loss in a single step, WCC and WCR
which are cutoff energies for hard inelastic interactions and hard bremsstrahlung emissions respectively. The simulation parameters are defined as a function of Emax, the maximum
energy of the electron such as Eabs,electron = Eabs,positron =
Emax/100, Eabs,photon= Emax/1000, WCC = Emax/100, WCR=
Emax/1000, C1 = C2 = 0.2 for anode material and 0.1 for
others.
2.2. Validation of the MC models
The main parameters of the MC model have been adjusted and validated using half value layers (HVL). The UNFORS detector has been used to measure the HVL of each simulated beam. The measurements have been compared with MC simulations performed with several aluminium filtrations. For each filtration the air Kinetic Energy Released per unit MAss (KERMA) has been calculated. Plotting air KERMA variations as a function of the aluminium filtration allows HVL determination.
Web of Conferences
2.3. Simulation of organ doses
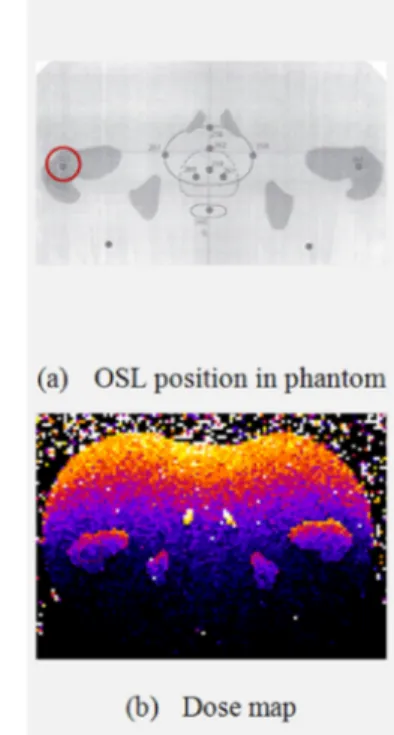
Physical anthropomorphic phantoms (CIRS ATOM dosimetry phantoms) and their DICOM images have been used to compare measured and simulated radiation doses in the case of a hip CR (Table 1) and in the case of a cardiac IR (Table 2). Measurements were performed with Optically Stimulated Luminescence (OSL) dosimeters(21) while the PENRADIO
software was used to determine the dose in some organs of interest.(22, 23) Information about the calibration and the
correction of the OSL readings is reported in the Appendix.
HighVoltage (kVp) Charge (mAs)
77 25.2
102 6.91
Table 1: CR acquisition tube parameters.
HighVoltage (kVp) Charge (mAs) Acquisition Mode
73 154 Graphy 70 100 Graphy 73 128 Graphy 73 64 Graphy 74 89 Graphy 93 13 Scopy 72 101 Graphy 77 165 Graphy 74 119 Graphy
Table 2: IR acquisition tube parameters.
3. Tool adaptation for CT exams
The full MC modeling of the GE Lightspeed VCT 64 CT tube is impossible with the information provided in the technical notes of the manufacturer, especially because of the particular shape of the bowtie filters. To overcome this problem, we have im-plemented in C++ the method proposed by Turner et al.(24)
Their study presents a method for generating x-ray source models based on experimental data. The so-called "Turner method" enables us to get equivalent spectra and bowtie filters.
3.1. Experimental determination of the X-ray tube spec-trum
The equivalent inherent filtration of the tube has been determined using a program based on Turner(24)work. Three
inputs are mandatory to run the developed program: a) the first and second half value layers (HVL1and HVL2);
b) an initial tungsten anode x-ray energy spectrum; c) an arbitrarily chosen material used for filtration.
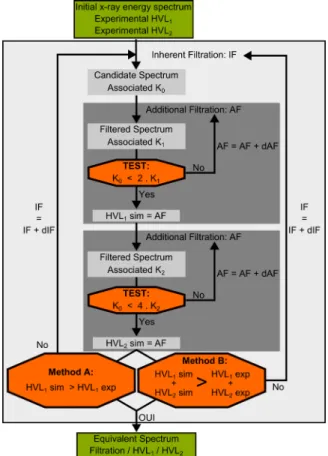
The following steps, reported in the flowchart in Figure 2, are used to get an equivalent spectrum:
1. The input energy spectrum is filtered assuming exponential attenuation by an initial thin sheet of alu-minium (IF) providing a candidate spectrum and its asso-ciated KERMA (K0).
2. Then the candidate spectrum is repetitively filtered by increasing the aluminium sheet thickness (AF) and its associated KERMA (K1) is calculated until K0 = 2.K1.
The simulated HVL1is set to the global additional sheet
thickness used to verify this condition.
3. The second step is repeated to evaluate the simulated HVL2which fulfils the condition K0=4.K2.
4. Then comparison between experimental and computed data has to be made: either only HVL1 values are
compared (Method A) or the sum of both HVL1
and HVL2 values (Method B). If experimental and
simulated data are similar, the equivalent spectrum is found. Otherwise, a new thicker initial sheet of aluminium is tested (step 1).
To run the Turner method we chose to use two different spectra to initialize the process, one softly filtered obtained with the Spekcalc tool,(25)the other unfiltered
using MC simulation in order to compare the influence of the primary spectrum in the simulation process. MC simulation using PENELOPE based on the technical notes pro-vides both the MC spectrum and the PSF of the CT head. PSF matches a 4 cm x 50 cm field size at a distance of 54.1 cm from the source for the 120 kVp voltage. The simulation parameters are defined as Eabs,electron= Eabs,positron =1000 eV,
Eabs,photon=100 eV, WCC= WCR=100 eV and C1= C2 =0.2.
Figure 2: Flowchart for the experimental determination of the CT model.
Both Spekcalc and PENELOPE equivalent spectra have been used in the PENRADIO software to determine the
simulated air KERMA (Kair,sim) at the CT isocenter. In a
static mode, simulated values and the experimental KERMA measured with a NE-2571 ionization chamber have been compared to determine the best suited method to model the X-ray tube.
3.2. Experimental determination of two bowtie filters The determination of an equivalent bowtie filter consists in obtaining the aluminium thickness as a function of θ which attenuates the equivalent spectrum in the same manner that the actual bowtie filter. The equivalent bowtie filter has also been determined using a program based on Turner(24) work. Two
inputs are necessary to run the program:
a) the equivalent spectrum previously generated; b) experimental profile measurements.
The following steps are repeated for each angle:
1. the ratio (R) of the measured point at θito the measured
central points is computed.
2. KERMA (K0) associated to the equivalent spectrum is
calculated.
3. The equivalent spectrum is repetitively filtered by increasing the aluminium sheet thickness (eAl) and its
associated KERMA (K1) is calculated until K0= R.K1.
4. The aluminium thickness for θiis set to eAl;
Both head and body bowtie filter shapes have been determined and designed with PENGEOM, the PENELOPE package that handles the geometry.
3.3. Implementation of the rotation in PENRADIO To model the effect of x-ray tube motion during an axial or helical scan, the position and direction of each particle stored in the input PSF were transformed before the particle was released for transport in the patient or phantom. Rotational and translational transformations were performed according to the following equations:(16)
β = α · RAND (5)
d = β/2π · s + z0 (6)
with α the total gantry angle rotation during the scan, RAND a random value between 0 and 1, s the table increment per gantry rotation and z0the start location of the scan. For single axial
scans, α and s equal 2π and 0, respectively.
III. Results
Results of dose calculations with the PENRADIO software in CR, IR and CT as well as their validation are presented.
1. Dose calculation in CR and IR 1.1. Validation of the MC models
The results obtained for the validation of the CR and IR tubes are reported in Table 3. The difference between the measurements and the simulations varies between 0.2 and 5.5%.
CR IR
graphy scopy
Potential 77 kV 102 kV 74 kV 85 kV
Exp. data (mm Al) 3.70 4.85 4.68 9.37
Sim. data (mm Al) 3.65 5.00 4.95 9.35
Deviation (%) 1.35 3.10 5.50 0.20
Table 3: Measured and simulated HVL used to validate the CR and IR tubes.
1.2. Simulation of organ doses
Measured and simulated doses in the case of a hip conventional radiography and in the case of a fluorography during a cardiac interventional radiology procedure are presented in Table 4, Figure 3 and Figure 4. Errors about 20% are tolerated for medical imaging examinations.
Localization Measured Dose (mGy) Simulated Dose (mGy) Error (%)
Hip 0.233 0.29 ± 0.03 23.6
Lung 0.584 0.56 ± 0.05 3.5
Table 4: Measured and simulated dose for a hip conventional ra-diography and a fluorography in a cardiac interventional radiog-raphy.
Figure 3: Male patient in a hip conventional radiography exami-nation at 77 kV.
Web of Conferences
Figure 4: Female patient in cardiac interventional radiography examination at 68 kV.
2. Tool adaptation for CT exams 2.1. Equivalent Spectra
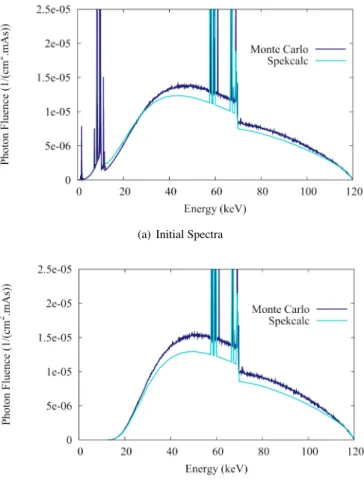
Both Spekcalc and MC initial and equivalent spectra are shown in Figure 5. Values of inherent filtration, first and second HVL are reported in Table 5. Values highly depend on the test performed but not on the spectrum type:
• When only the first HVL is used to determine the inherent filtration, the algorithm converges on the experimental value for the first HVL and a deviation of 7.7% is obtained for the second HVL estimation which are identical for both Spekcalc and MC spectra.
• When both HVL are used together for
inherent filtration determination, a deviation of 6.6% and 5.0% can be noticed for the first and the second HVL, respectively. Both HVL values are comparable to each other for both Spekcalc and MC used spectra.
Due to the common use of maximal potential and first HVL to qualify a x-ray tube and a greater global error for the method including both HVL, in the following we chose to use equivalent spectra obtained with the algorithm based on a comparison only of the first HVLs.
Exp. Spekcalc Monte Carlo
Method A B A B
Filtration (mm Al) 2.10 1.67 1.94 1.51
First HVL (mm Al) 6.08 6.08 5.68 6.08 5.69
Second HVL (mm Al) 8.23 8.86 8.64 8.87 8.63
Table 5: Results obtained for the inherent filtration.
Measured air KERMA has been compared to simulated values based on both Spekcalc and MC equivalent spectra
(a) Initial Spectra
(b) Equivalent Spectra
Figure 5: Initial and filtered spectra obtained with the iterative process.
obtained using Method A (Table 6). Simulated values are given in eV/g/photon and are converted into Gray using Equation 3. yT X was set to 3.147 10−5 for the equivalent
filtration of 1.94 mm in aluminium (MC spectrum) and set to 3.144 10−5 for the equivalent filtration of 2.10 mm in
aluminium (Spekcalc spectrum).
Dabs,Gy= yT X· 1.6 · 10−19· 1000 · Nelec· DMC,eV/g/shw (4)
Despite the good agreement on the inherent filtration and the two HVL, we note discrepancies of about 25% between the two simulated values (Table 6). The results obtained with the Spekcalc spectrum are closer to the measurements. Further investigations have to be performed to understand these discrepancies. One explanation could be the low interaction probability in air.
Measurements (mGy) 574 ± 15
Monte Carlo (mGy) 714 ± 29
Spekcalc (mGy) 571 ± 25
Table 6: Results obtained for the air KERMA.
2.2. Equivalent Bowtie Filter
Body bowtie filters were designed to cover a large field of view (FOV) corresponding to adult abdominal CT. Head bowtie filters were designed to cover a small FOV corresponding to
head CT or pediatric abdominal CT. According to the fact that in Figure 6, the head bowtie filter (6(a)) appears narrower than the body bowtie filter (6(b)) which corroborates theoretical expectation.
(a) Head bowtie filter
(b) Body bowtie filter
Figure 6: PENGEOM 3D bowtie filter visualisation.
2.3. Geometric validation of the rotation
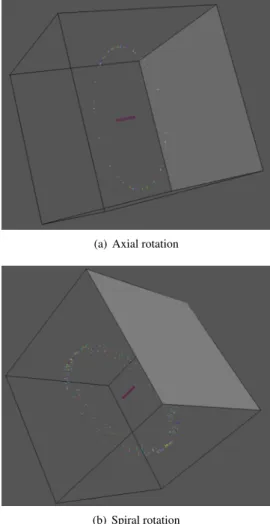
In Figure 7, multicolour points into the box represent photon emission point. Purple rectangle matches the ionization chamber used for measurements. As we can observe in Figure 7(a) points constitute a circle around the ionization chamber corresponding to an axial CT scan. Figure 7(b) shows a spiral rotation around the ionization chamber. Geometric validations for axial and spiral rotation look promising for further investigations in CT simulations.
IV. Conclusions
The first results obtained with the PENRADIO software are encouraging. The validation of the program is part of the ongoing work for several phantoms and examination procedures in conventional and interventional radiography as well as in CT exams. We expect the same accuracy in the results that we have obtained up to now.
Appendix: Calibration and correction of OSL
read-ings
1. OSL calibration
There are two calibration curves according to the lumines-cent signal used at the time of reading: beam 1 for high doses and beam 2 for low doses. Readings corrected from the sensitivity of each OSL are used. Once this calibration is made the uncorrected air dose is obtained.
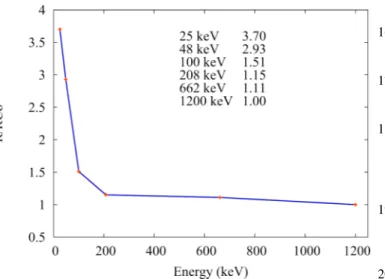
2. Energy response
We determine the average energy of photons arriving on the OSL with a Monte Carlo simulation. The correction factor
(a) Axial rotation
(b) Spiral rotation
Figure 7: Geometric validation of CT rotation.
Figure 8: OSL calibrations.
is determined using the curve (Figure 9) obtained in a preliminary study performed with a cobalt beam. We then obtain the corrected air dose.
Acknowledgments
The authors thank ESPRIMED for partially funding this work. Web of Conferences
Figure 9: Energy dependance of OSL detectors.
References
1) P. C. Shrimpton, M. C. Hillier, M. A. Lewis, and M. Dunn, “Doses from computed tomography (CT) examinations in the UK - 2003 review,” National Radiological Protection Board (2005). 2) R. Fazel et al., “Exposure to low-dose ionizing raditaion from
medical imaging procedures,” The New England Journal of Medicine, 361, 9, 849-857 (2009).
3) C. Etard, S. Sinno-Tellier, and B. Aubert, “Exposition de la population franÃ˘gaise aux rayonnements ionisants liÃl’e aux actes de diagnostic mÃl’dical en 2007,” (2010).
4) J. Giles, “Study warns of ’avoidable’ risks of CT scans,” Nature, 431, 7007, 391 (2004).
5) D. J. Brenner and E. J. Hall, “Computed tomography - an increas-ing source of radiation exposure,” The New England Journal of Medicine, 357, 22, 2277-2284 (2007).
6) A. B. de Gonzalez et al., “Projected cancer risks from computed tomographic scans performed in the United States in 2007,” Arch Intern Med, 169, 22, 2071-2077 (2009).
7) A. A. of Physicists in Medicine (AAPM), “The measurement, reporting, and management of radiation dose in CT, AAPM report 96,” (2008).
8) http://www.stuk.fi.
9) R. Kramer, “CALDose_X - a software tool for the assessmentn of organ and tissue absorbed doses, effective dose and cancer risks in diagnostic radiology,” Phys Med Biol, 53, 6437-6459 (2008). 10) “Eff-dose software, X-ray Radiology Dosimetry Program Using NRPB-SR262 National Board Of Health, Denmark, National Institute of Radiation Hygiene,” (1995).
11) E. K. Osei and R. Barnett, “Software for the estimation of organ equivalent and effective doses from diagnostic radiology proce-dures,” J. Radiol. Prot, 29, 361-376 (2009).
12) B. Schmitt and W. Kalender, “A fast voxel-based Monte Carlo method for scanner- and patient-specific dose calculations in computed tomography,” Med. Phys, 36, 2898-2914 (2009). 13) J. Jarry, J. J. DeMarco, C. H. Cagnon, and M. F. McNitt-Gray, “A
Monte Carlo based method to estimate radiation dose from spiral CT: from phantom testing to patient-specific models,” Phys. Med. Bio., 48, 2645-2663 (2009).
14) J. J. DeMarco et al., “A Monte Carlo based method to estimate radiation dose from Multidetector CT : Cylindrical and Anthro-pomorphic Phantoms,” Phys. Med. Bio., 50, 3989-4004 (2005). 15) P. Deak, M. V. Straten, P. C. Shrimpton, M. Zankl, and W. A.
Kalender, “Validation of a Monte Carlo tool for patient-specific dose simulations in multi-slice computed tomography,” European
Society of Radiology, 18, 759-772 (2008).
16) X. Li et al., “Patient-specific radiation dose and cancer risk estimation in CT: Part I. Development and validation of a Monte Carlo program,” Medical Physics, 38, 397-407 (2011).
17) F. Salvat, J. F. Varea, and J. Sempau, PENELOPE 2006, A Code System for Monte Carlo Simulation of Electron and Photon Transport, OECD, (Barcelona, Spain) (2006).
18) C. L. Loirec, J. C. G. Hernandez, G. Bonniaud, B. Poumarede, and D. Lazaro, “Dosimetric verification of PENSSART, a new Monte Carlo dose calculation system based on PENELOPE and dedicated to patientspecific treatment quality control,” MCTP2012 -May 15-18 2012 - Sevilla - Spain(2012).
19) J. DeMarco et al., “A Monte Carlo based method to estimate radiation dose from multidetector CT (MDCT): cylindrical and anthropomorphic phantoms,” Physics in Medicine and Biology, 50, 3989-4004 (2005).
20) G. Bueno and O. Deniz, “Fast Monte Carlo simulation on a vox-elized human phantom deformed to a patient,” Medical Physics, 36, 5162-5174 (2009).
21) P. Jursinic, “Characterization of optically stimulated lumines-cent dosimeters, OSLDs, for clinical dosimetric measurements,” Medical Physics, 34, 4594-4604 (2007).
22) ICRP, “The 1990 Recommendations of the international commis-sion on radiological protection,” 1990.
23) ICRP, “The 2007 Recommendations of the international commis-sion on radiological protection,” 2007.
24) C. Turner, D. Zhan, H. Kim, and et al., “A method to generate equivalent energy spectra and filtration models based on measure-ment for multidetector CT Monte Carlo dosimetry simulations,” Medical Physics, 36, 2154-2164 (2009).
25) G. Poludniowski, “Calculation of x-ray spectra emerging from an x-ray tube. Part II. X-ray production and filtration in x-ray targets.,” Medical Physics, 34, 2175-2186 (2007).
![[PDF] Cours generale pour debuter la programmation avec le langage C | Cours langage c](data:image/gif;base64,R0lGODlhAQABAIAAAP///wAAACH5BAEAAAAALAAAAAABAAEAAAICRAEAOw==)