HAL Id: hal-02396450
https://hal.archives-ouvertes.fr/hal-02396450
Submitted on 6 Dec 2019
HAL is a multi-disciplinary open access
archive for the deposit and dissemination of
sci-entific research documents, whether they are
pub-lished or not. The documents may come from
teaching and research institutions in France or
abroad, or from public or private research centers.
L’archive ouverte pluridisciplinaire HAL, est
destinée au dépôt et à la diffusion de documents
scientifiques de niveau recherche, publiés ou non,
émanant des établissements d’enseignement et de
recherche français ou étrangers, des laboratoires
publics ou privés.
Vegetation cover changes analysis at the Cameroonian
shores of Lake Chad and its hinterland (2000-2018)
Paul Gérard Gbetkom, Sébastien Gadal, Ahmed El Aboudi, Julien Andrieu,
Alfred Homère Ngandam Mfondoum, Mamane Barkawi Mansour Badamassi
To cite this version:
Paul Gérard Gbetkom, Sébastien Gadal, Ahmed El Aboudi, Julien Andrieu, Alfred Homère Ngandam
Mfondoum, et al.. Vegetation cover changes analysis at the Cameroonian shores of Lake Chad and its
hinterland (2000-2018). 3rd International Land Use Symposium 2019: Trends and projections, Dec
2019, Paris, France. 2019. �hal-02396450�
A. Man Kendall Correlation
Figure 5 : variations in chlorophyll activity of vegetation classes
D. Classification of Principals’ Components Analysis
The reclassification of all principal components by the unsupervised’s Kmeans
algorithm has helped to categorize vegetation according to their seasonal cycle
and their proximity to the lake. Annual vegetation dominates the northern part of the lake, the outer shores and the hinterland. Flood and permanent vegetation are present in the rest of
the lake part.
During the first half of the study period the growth of the vegetation of the hinterland reaches its maximum at the beginning of August. Between 2010 and 2018,
this maximum move
towards the second half
of August and the
floodable vegetation
doubles in quantity. Figure 6 : differents types of vegetation
Figure 7 : variations in chlorophyll activity of differents types of vegetation
Paul Gérard GBETKOM 1,2*, Sébastien GADAL1, Ahmed El ABOUDI2, Julien ANDRIEU3, Alfred Homère NGANDAM MFONDOUM4, Mamane Barkawi MANSOUR BADAMASSI2
1. Aix-Marseille Univ, CNRS, ESPACE UMR 7300, Univ Nice Sophia Antipolis, Avignon Univ, 13545 Aix-en-Provence, France, paul-gerard.gbetkom@etu.univ-amu.fr; sebastien.gadal@univ-amu.fr 2. Laboratory of Botanic, Mycology and Environment, University Mohammed V Rabat, 1014, 4 avenue ibn battouta Rabat Morocco; elaboudi@gmail.com, barkawimansour@yahoo.fr 3. Univ Nice Sophia Antipolis, CNRS, ESPACE UMR 7300, Aix-Marseille Univ, Avignon Univ, Nice, France, 4. StatsN’Maps, Private Consulting Firm, 19002 Dallas Parkway, suite 1536, Dallas, Texas 75287, USA; stats.n.maps.expertise@gmail.com; ngandamh@yahoo.com
The landscape of Makari well-drained, is dominated by stable and progressive trends (83.1%). The landscape units of Bodo Kouda and Lake Chad poorly drained, are dominated by stable and regressive trends (87.47% and 93.3% respectively). The landscape of Dana witch is also poorly drained is dominated by stable and progressive trends 78.43 %.
Figure 3 : spatial correlation between vegetation trends and soils characteristics
B. Principals Components Analysis
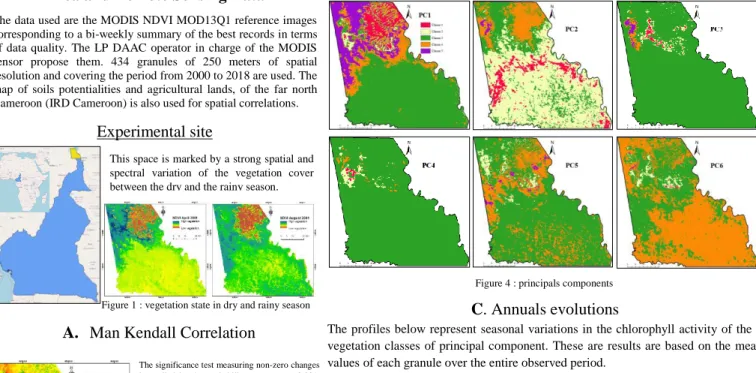
The principal component analysis applied to the 434 images summarizes the information of these images into 8 principal components of 5 classes each. The first component concentrates 82.66% of the information, the second 3.15%, the third 2.2%, the fourth 1.44%, the fifth 0.9%, and the sixth 0.46%.
Figure 4 : principals components
C. Annuals evolutions
The profiles below represent seasonal variations in the chlorophyll activity of the 5 vegetation classes of principal component. These are results are based on the mean values of each granule over the entire observed period.
Vegetation dynamics: Re-greening
Since the great droughts of the 1970s, the monitoring of vegetation cover in arid regions is a major environmental challenge. Satellite images played an important role in the study of these droughts. In 90s, images of NOAA (1981) and MODIS (2000) sensors have been coupled with weather data to study the “regreening” of Sahel started with the improvement of climatic conditions. However, observations carried out at local scales show trends of evolution sometimes different from the results obtained in the Sahel. This study explores the quantification of changes in vegetation cover at the Cameroonian shores of Lake Chad and its hinterland. Its two complementary goals are the mapping of vegetation cover; and the statistical changes analysis to assess the degree of correlation between visual, quantified trends, and environmental parameters.
Area and Remote Sensing Data
The data used are the MODIS NDVI MOD13Q1 reference images corresponding to a bi-weekly summary of the best records in terms of data quality. The LP DAAC operator in charge of the MODIS sensor propose them. 434 granules of 250 meters of spatial resolution and covering the period from 2000 to 2018 are used. The map of soils potentialities and agricultural lands, of the far north Cameroon (IRD Cameroon) is also used for spatial correlations.
Experimental site
Figure 1 : vegetation state in dry and rainy season
0 1000 2000 3000 4000 5000 6000 0 1000 2000 3000 4000 5000 6000 7000 8000 -1000 0 1000 2000 3000 4000 5000 6000 -2000 -1000 0 1000 2000 3000 4000 5000 6000 7000 8000 gr an u le -0 0 1 gr an u le -0 1 7 gr an u le -0 3 3 gr an u le -0 4 9 gr an u le -0 6 5 gr an u le -0 8 1 gr an u le -0 9 7 gr an u le -1 1 3 gr an u le -1 2 9 gr an u le -1 4 5 gr an u le -1 6 1 gr an u le -1 7 7 gr an u le -1 9 3 gr an u le -2 0 9 gr an u le -2 2 5 gr an u le -2 4 1 gr an u le -2 5 7 gr an u le -2 7 3 gr an u le -2 8 9 gr an u le -3 0 5 gr an u le -3 2 1 gr an u le -3 3 7 gr an u le -3 5 3 -2000 -1000 0 1000 2000 3000 4000 5000 6000 7000 8000 gr an u le -0 0 1 gr an u le -0 1 7 gr an u le -0 3 3 gr an u le -0 4 9 gr an u le -0 6 5 gr an u le -0 8 1 gr an u le -0 9 7 gr an u le -1 1 3 gr an u le -1 2 9 gr an u le -1 4 5 gr an u le -1 6 1 gr an u le -1 7 7 gr an u le -1 9 3 gr an u le -2 0 9 gr an u le -2 2 5 gr an u le -2 4 1 gr an u le -2 5 7 gr an u le -2 7 3 gr an u le -2 8 9 gr an u le -3 0 5 gr an u le -3 2 1 gr an u le -3 3 7 gr an u le -3 5 3 0 20 40 60 terroir de Makari terroir de Dana terroir du lac Tchad terroir de Bodo Kouda
important decrease decrease stability increase important increase
-4000 -2000 0 2000 4000 6000 8000 0 1000 2000 3000 4000 5000 6000 7000 8000 0 1000 2000 3000 4000 5000 6000
Vegetation cover changes analysis at the Cameroonian shores of Lake Chad and its hinterland– period 2000-2018
ILUS 2019, PARIS 04-06 December 2019
The significance test measuring non-zero changes is applied by the probability measure p <0.001. The progression means the transformation of water or bare soils spaces into vegetation. The opposite refers to regression.
Positive trends: 13. 29%
Negative trends: 21. 61%
Stability: 65. 08 % Strongest evolutions trends in the lake part. Regression and stability dominate in the hinterland where trends are weak.
This space is marked by a strong spatial and spectral variation of the vegetation cover between the dry and the rainy season.
Conclusion
The three trends in vegetation cover are observed in the lake part, while the hinterland of the study area is dominated by stable and regressive trends. The vegetation trends of well drained landscape are stable and progressive unlike of the poorly drained landscape where the trends are stable and regressive. The classification of the principal components shows that the vegetation of the hinterland is essentially composed of annual vegetation while floodable and perennial vegetation is located in lake part.
PC1
PC4
PC2 PC3
PC5 PC6
References
Seignobos, Christian, and Olivier Iyébi-Mandjek. 2000. ‘Atlas de La Province Extrême-Nord Cameroun’. Paris : Yaoundé: Institut de recherche pour le développement.
Cécile Dardel. Entre désertification et reverdissement du Sahel : Diagnostic des observations spatiales et in situ. Géophysique. Université Paul Sabatier - Toulouse III, 2014.
Figure 2: vegetation trends 2000 to 2018