HAL Id: halshs-00851443
https://halshs.archives-ouvertes.fr/halshs-00851443
Preprint submitted on 14 Feb 2014
HAL is a multi-disciplinary open access
L’archive ouverte pluridisciplinaire HAL, est
A typology of gated communities in US Western
Metropolitan Areas – working paper
Renaud Le Goix, Elena Vesselinov
To cite this version:
Renaud Le Goix, Elena Vesselinov. A typology of gated communities in US Western Metropolitan
Areas – working paper. 2012. �halshs-00851443�
A typology of gated communities in US Western
Metropolitan Areas
- working paper -
∗
Renaud Le Goix
Associate Professor
University Paris 1 Panth´
eon-Sorbonne
Department of Geography
rlegoix@univ-paris1.fr
Elena Vesselinov
Department of Sociology
Queens College and the Graduate Center
elena.vesselinov@qc.cuny.edu
19 novembre 2012
†
Abstract
This working paper investigates the social dimensions of gated communities in
US western metropolitan areas, and investigates their contribution to segregation
patterns at the metropolitan level. On the basis of a socio-economic typology at
the block group level, we analyze the socio-economic patterns associated with gated
residential streets in 20 metropolitan areas in the western US (in California, and in
Las Vegas and Phoenix). We use geographically referenced data at the gated street
level to build a database of gated streets and gated block groups. This definition
of gated block groups and gated streets is then compared with the results of a
multivariate analysis investigating socioeconomic patterns in three aspects: race and
ethnicity, economic class and age in 2010 census. The results show a contrasting
understanding of their contribution to segregation patterns: whereas larger gated
communities are more likely to be ”retirement communities”, the stronger trend
relates to the amplitude of the diffusion of both large and small gated communities
within the wealthier neighborhoods. But the analysis of smaller gated developments
demonstrates the really diverse and wide spectrum of the gated and private realm
of residential neighborhoods.
Keywords: segregation, inequality, US metropolitan areas, gated communities,
spatial analysis.
∗
This paper was prepared with funding from a National Institute of Child Health and Human
De-velopment – NIH Grant, titled ‘Socio-Economic Impact of Gated Communities on American Cities’
(5R03HD056093-02). This support is gratefully acknowledged.
1
Introduction
From the early academic and public debates about gated communities until now scholars
and observers have discussed the link between gating and segregation. Not surprisingly
there is a wide continuum of arguments from scholars supporting the idea that gating is
in fact a process which contributes to residential integration, to scholars believing that it
is a form of exclusion and segregation. This paper investigates the social dimensions of
gated communities in US western metropolitan areas, and investigates their contribution
to segregation patterns at the metropolitan level. On the basis of a socio-economic
typology at the block group level, we analyze the socio-economic patterns associated
with gated residential streets in 20 metropolitan areas in the western US (in California,
and in Las Vegas and Phoenix). We use geographically referenced data at the gated
street level to implement a database of gated streets and gated block groups. This
definition of gated block groups and gated streets is then compared with the results of
a multivariate analysis investigating socioeconomic patterns in three aspects: race and
ethnicity, economic class and age in 2010 census. We compare socio-economic patterns
in gated communities and in the rest of metropolitan areas.
We first outline the backgrounds, i.e. the links between gated communities and
segregation, and especially discuss how the private urban governance organize the
gov-ernance and social structure with an interlocking of spatial, legal, social system, that
yield increased selection of residents. A second section describes the methodology used
to prepare of geo-referenced dataset of gated communities (gated streets and gated block
groups) and the data used to perform of multivariate analysis of socio-economic patterns.
We discuss the results, at the gated block group level, and also at the block group with
some gated streets level, and by doing so we propose an analysis of several profiles of
metropolitan areas in terms of significance of socio-economic patterns associated with
gated enclaves.
2
Backgrounds: gated communities and segregation
Gated communities are territories of exclusiveness, building up by design social
homo-geneity on security, snob values, fear of crimes, symbolic and physical distance from
others. But all these attributes are not truly independent, as they derive from the
con-tractual agreement binding all property owners. Questions raised about their alleged
effects usually address their efficiency on preservation of the tidiness and value of the
neighborhood, and ultimately on segregation patterns. Gated communities in US
west-ern metropolitan areas account for a substantial part of newly built subdivisions since
the last three decades, and there has been a need for empirical assessment of how they
have contributed to a reshaping a suburban social dimensions by means of walls and
gates. The Community Association of America estimated in 2002 that 47 million
Amer-icans had been living in 231,000 community associations and that 50% of all new homes
— of these private local government areas are gated.
This articulates with debates on fragmentation and privatization that shape and
de-fines the residential suburban-scape. Gated communities are residential schemes
(Com-mon Interest Developments, CIDs) organizing the governance and social structure with
an interlocking of spatial, legal, social system (Le Goix and Webster 2008).
•
On morphology: gated communities are built as enclaves and have physical enclosures,
secluding some collective urban space (parks, sidewalks, streets, common grounds, golf
courses...) (Blakely and Snyder, 1997).
•
Legally: property rights are implemented in POAs, and private governance structure
are designed to exclude others (i.e. selecting residents) (Kennedy 1995; McKenzie
1994; McKenzie 2003; McKenzie 2006; Owens 1997).
•
Socially: securitization forms are embedding social strategies to seek “comfort” and
social homogeneity (Low 2003; Low 2006).
Since Blakely and Snyder’s seminal book, there has been a noticeable consensus
among the authors who describe the security logic as a nonnegotiable requirement in
contemporary urbanism and architecture, and all agree that ‘both the privatization of
public space and the fortification of urban realm, in response to the fear of crime, has
contributed significantly to the rise of the contemporary gated community phenomena’
(Bagaeen and Uduku 2010) in different national contexts. On the one hand, a strong
thesis is therefore the link between security and fear of others — sometimes distinguished
from the desire for security of person and property (Low 2001; Low 2003). On the other
hand, gated communities, as a member of the wider family of private urban governance,
derive in the United States from a long history of exclusive regulations being
imple-mented both in planning and land-use documents, but more significantly in the legal
structuring of residential associations by means of restrictive covenants (Fox-Gotham
2000; Kennedy 1995; Kirby, Harlan, Larsen, Hackett, Bolin, Nelson, Rex, and Wolf
2006). In a Tieboutean world, residential preferences and economic rationale prevail,
and gated communities are understood as an exit-option from the public realm, from
the over-regulated and overcrowded cities, with their inefficiency in providing community
services (Cs´efalvay and Webster 2012). This has been thoroughly discussed under the
terminology of “club economy” (Lee and Webster 2006; Webster 2007; Webster 2002).
This also explicitly contributes to social selection of prospective buyers. There are
mul-tiple and concurring evidences, based on diverse methodologies, of the price premium of
gated communities over non-gated private neighborhood. On average, GCs are known
to generate a price premium, and to better guaranty the homogeneity of property
val-ues within the neighborhood and to better protect valval-ues on the long run than other
non-gated private neighborhoods in the US. (Bible and Hsieh 2001; Lacour-Little and
Malpezzi 2001; Le Goix and Vesselinov 2012).
Several authors have therefore demonstrated the link between proprietary
neighbor-hoods and segregation, either in the Los Angeles area (Le Goix 2005), or in a more
general contexts such as planned communities (Gordon, 2004) and new towns (Kato
2006). Private governance and the organization of property rights by the means of
CC&R’s lead to a implicit selection processes of the owners. The effect of gated
com-munities on social homogeneity (Le Goix 2005; Vesselinov, Cazessus, and Falk 2007; Wu
2005) has been well established. Social homogeneity is achieved through design
guide-lines, age restrictions or a selective club membership, and yields a measurable effect on
local segregation: in the US, gated communities tend to segregate more by age (Life
cycle and age polarization), and by socio-ethnic status (White vs. Hispanics, correlated
with wealth and age), and do not locally influence segregation patterns in terms of racial
segregation.
3
Methodology
3.1
A georeferenced dataset of gated communities
We have identified the exact location of GCs in a set of an initial set of 31 metropolitan
areas (MSAs and PMSAs), available through Thomas Guides
R
1
. We then match the
newly constructed data for GCs with Census data at block group level. Using data from
2010 US Census, we will then allow to identify the characteristics of the population living
within and outside of the gated areas. This paper presents, compares and discusses the
results for the 11 metropolitan areas for which the analysis yielded significant results.
In all other areas, the quality of the sample did not allow to significantly conclude.
3.2
A multivariate analysis of socio-economic patterns in gated streets
We use a geographically referenced dataset covering metropolitan areas in the western
US. Our dataset is based on a ratio of gated streets by block groups (BG), constructed
with proprietary dataThese data come from Thomas Bros. Maps
. The company
R
publishes interactive maps that identify private streets. Access to vector maps allows
spatial queries of gated streets, in order to identify gated neighborhoods. The files also
contain information related to military bases, airfields, airports, prisons, amusement
parks and colleges, some of which may also contain private streets with restricted access..
Aerial photographs from the usual on-line providers (Google Earth, MapQuest) have
been also used, and has been helpful in visualizing residential physical patterns and the
presence of gates. Field survey data collection have also contributed to identify GCs as
opposed to nonresidential gated areas, and to control for the overall quality of data.
In order to produce an accurate typology of gated communities, the analysis will sort
them out of their more general socio-economic contexts. Therefore, the methodology
1
Bakersfield, CA; Chico–Paradise, CA; Fresno, CA; Las Vegas, NV–AZ ; Los Angeles–Long Beach,
CA; Merced, CA; Modesto, CA; Oakland, CA; Orange County, CA; Phoenix–Mesa, AZ ; Redding, CA;
Reno, NV; Riverside–San Bernardino, CA; Sacramento, CA; Salinas, CA; San Diego, CA; San
Fran-cisco, CA; San Jose, CA; San Luis Obispo–Atascadero–Paso Robles, CA; Santa Barbara–Santa Maria–
consists in classifying, by the means of a hierarchical cluster analysis over a principal
component analysis, all block groups within the studied MSAs, except block groups with
quartered population. Three main characteristics of the socioeconomic differentiation
are analyzed, using the following variables for each block group, extracted US Census
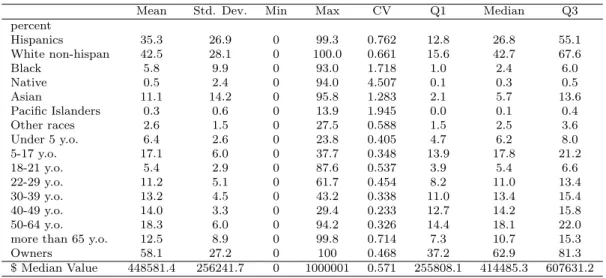
2010 (SF1) and American Community Survey 2010 (5 years estimate) (Table 1). It
is of importance to mention that our proprietary database of gated block groups and
block groups with gated streets had originally been designed according to 2000 census
block groups geographies. Consequently, we have retropolated 2010 census data into
2000 block group entities, for the means of our comparisons with gated communities.
This has been performed by the means of an surface-based average weighted means
computation of 2010 census data.
•
Socioeconomic status: median property value; owner-occupied housing units (% of
housing units),
•
Ethnicity: White non-Hispanic persons; Black persons; Hispanic and Latinos
ethnic-ity; Asian origins; Native American origins, Others (% of population 2000),
•
Age: less than 5 years old; 5-17 y.o., 18-21 y.o.; 22-29 y.o.; 30-39 y.o.; 40-49 y.o.; 50-64
y.o.; more than 65 y.o. (% of population).
Table 1: Univariate statistics of 2010 census data in block groups (all MSAs)
Mean
Std. Dev.
Min
Max
CV
Q1
Median
Q3
percent
Hispanics
35.3
26.9
0
99.3
0.762
12.8
26.8
55.1
White non-hispan
42.5
28.1
0
100.0
0.661
15.6
42.7
67.6
Black
5.8
9.9
0
93.0
1.718
1.0
2.4
6.0
Native
0.5
2.4
0
94.0
4.507
0.1
0.3
0.5
Asian
11.1
14.2
0
95.8
1.283
2.1
5.7
13.6
Pacific Islanders
0.3
0.6
0
13.9
1.945
0.0
0.1
0.4
Other races
2.6
1.5
0
27.5
0.588
1.5
2.5
3.6
Under 5 y.o.
6.4
2.6
0
23.8
0.405
4.7
6.2
8.0
5-17 y.o.
17.1
6.0
0
37.7
0.348
13.9
17.8
21.2
18-21 y.o.
5.4
2.9
0
87.6
0.537
3.9
5.4
6.6
22-29 y.o.
11.2
5.1
0
61.7
0.454
8.2
11.0
13.4
30-39 y.o.
13.2
4.5
0
43.2
0.338
11.0
13.4
15.4
40-49 y.o.
14.0
3.3
0
29.4
0.233
12.7
14.2
15.8
50-64 y.o.
18.3
6.0
0
94.2
0.326
14.4
18.1
22.0
more than 65 y.o.
12.5
8.9
0
99.8
0.714
7.3
10.7
15.3
Owners
58.1
27.2
0
100
0.468
37.2
62.9
81.3
$ Median Value
448581.4
256241.7
0
1000001
0.571
255808.1
414485.3
607631.2
4
Results
To present the results, we then distinguish three levels, describing the different
topolog-ical distance and geographies we use:
•
The BG with some gated streets (below the 50% threshold).
•
The other BG within the metropolitan area.
After a general analysis of the socio-economic typology by block groups, we elaborate a
more detailed analysis at the gated block group level, and also at the block group with
some gated streets level. We discuss the results with a focus on how some metropolitan
areas differ in terms of significance of socio-economic patterns associated with gated
enclaves.
4.1
A socio-economic typology by block groups
The four principal axis extracted (62.94% of total cumulative Eigenvalues) describe the
main dimensions of socio-spatial segregation in the metropolitan areas. Figure 1
sum-marizes the factorial coordinates of variables. Each factor describes a specific dimension
of socio-economic differentiation.
PCA : Scatterplot of variables
Factor 1 (x) * Factor 2 (y)
y -0.5 -0.4 -0.3 -0.2 -0.1 0.0 0.1 0.2 0.3 0.4 0.5 0.6 0.7 0.8 x -0.85 -0.70 -0.55 -0.40 -0.25 -0.10 0.05 0.20 0.35 0.50 0.65 0.80
PCA : Scatterplot of variables
Factor 3 (x) * Factor 4 (y)
y -0.3 -0.2 -0.1 0.0 0.1 0.2 0.3 0.4 0.5 0.6 0.7 x -0.50 -0.35 -0.20 -0.05 0.10 0.25 0.40 0.55 0.70 0.85
Figure 1: Principal components analysis of socio-economic variables in 2010.
Block group geography, in metropolitan statistical areas. Proportion of Eigenvalues:
F1=0.31, F2=0.13, F3=0.10; F4=0.07
Factor 1 describes distance on White vs. Hispanic status, correlated with wealth and
age status. On average, it discriminates areas with an over-representation of wealthier
and older (more than 40 y.o.) White population with a dominant owner status, from
areas where Hispanic and younger populations are overrepresented. Factor 2 summarizes
the spectrum of life-cycle combined with ownership status. On the one hand, block
groups are better described by pure owner-occupied status of households ; on the other
hand, population between 22-39 y.o. are over-represented, with a secondary component
of asian and other race status. Factor 3 also conveys interpretations on life-cycle and
segregation is finally characterized by factor 4. Everything else being equal (in terms of
property values, age and ownership status), it clearly discriminates White population on
the one hand of the spectrum, and Black and Pacific Islanders populations on the other
hand.
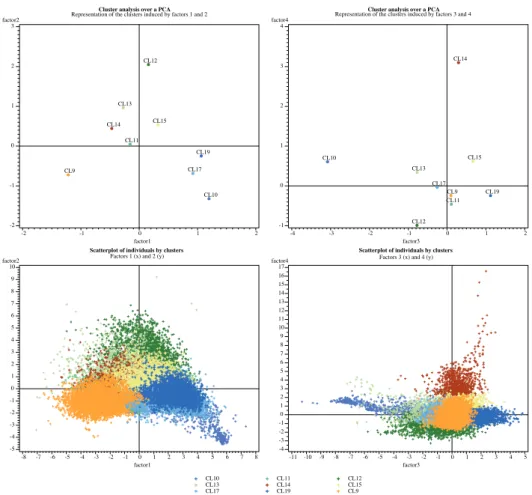
We then extract summarizing clusters from the PCA factors, by the means of a
hier-archical cluster analysis (Figure 2). The best fit of 9 clusters explains 65% of intergroup
variance, and distinguish:
•
An average profile of mixed White and Hispanic neighborhoods (as on Table 1), in
which ownership of high property values predominates as the most significant
dis-criminant characteristics, along with an overrepresentation of more than 40 years-old
(CL11);
•
Young adults mixed neighborhoods, where 22-39 y.o., Whites and Asians are
overrep-resented, and owners underrepresented (CL 12);
•
Mixed neighborhoods, with a younger population, average values and less owners, and
a higher share of African-americans and Asians among Whites and Hispanics (CL 13);
•
Affluent White neighborhoods, with an over-representation of Whites, along with
higher property values, owners, families with children 5-17 (CL19);
•
The end of the life-cycle: elderlies and owners. Racial mix with an over-representation
of Whites and higher property values (CL17);
•
Retirement neighborhoods, with an overrepresentation of 65+, non-Hispanic White
and mostly owner-occupied neighborhoods (CL 10);
•
Hispanic neighborhoods (younger population, lower value, fewer owners) (CL9);
•
Minority neighborhoods, with an n overrepresentation of Blacks, younger, less owner
status, and lower property values (CL14);
•
Asian neighborhoods, with a dominant profile of 22-49 y.o. and a relative median
profile (CL15).
4.2
Socio-economic characteristics of gated block groups
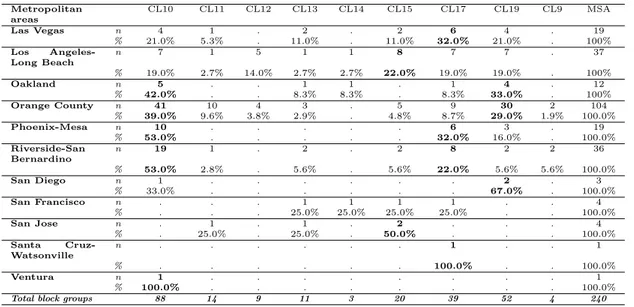
As in Table 2, across the 11 metropolitan areas in which we have a significant subset of
the 240 gated block groups. The largest share — 88 block groups, 36% of total — belong
to the cluster describing retirement communities (CL10), followed by gated block groups
that corresponds to the affluent white neighborhoods (CL19), as well as block groups
described by an overrepresentation of elderlies and owners, with higher property values
(CL17). Those three clusters summarize the socio-economic characteristics for 74% of
the largest gated enclaves than fit entire block groups. But Asian neighborhoods (CL15)
represent a share of 8.3%, and other clusters demonstrate the wide social spectrum of
gated neighborhoods, that are found in every socio-economic contexts.
Cluster analysis over a PCA Representation of the clusters induced by factors 1 and 2 factor2 -2 -1 0 1 2 3 factor1 -2 -1 0 1 2 CL10 CL11 CL12 CL13 CL14 CL15 CL17 CL19 CL9
Cluster analysis over a PCA Representation of the clusters induced by factors 3 and 4 factor4 -1 0 1 2 3 4 factor3 -4 -3 -2 -1 0 1 2 CL10 CL11 CL12 CL13 CL14 CL15 CL17 CL19 CL9
Scatterplot of individuals by clusters Factors 1 (x) and 2 (y)
CL10 CL11 CL12 CL13 CL14 CL15 CL17 CL19 CL9 factor2 -5 -4 -3 -2 -1 0 1 2 3 4 5 6 7 8 9 10 factor1 -8 -7 -6 -5 -4 -3 -2 -1 0 1 2 3 4 5 6 7 8
Scatterplot of individuals by clusters Factors 3 (x) and 4 (y) factor4 -4 -3 -2 -1 0 1 2 3 4 5 6 7 8 9 10 11 12 13 14 15 16 17 factor3 -11 -10 -9 -8 -7 -6 -5 -4 -3 -2 -1 0 1 2 3 4 5
Figure 2: Cluster analysis over the PCA, factors 1 to 4, by block groups.
Scatterplots of cluster centro¨ıds (top) and individuals (down)
Table 2: Gated block groups by socio-economic typology
Metropolitan areas CL10 CL11 CL12 CL13 CL14 CL15 CL17 CL19 CL9 MSA Las Vegas n 4 1 . 2 . 2 6 4 . 19 % 21.0% 5.3% . 11.0% . 11.0% 32.0% 21.0% . 100% Los Angeles-Long Beach n 7 1 5 1 1 8 7 7 . 37 % 19.0% 2.7% 14.0% 2.7% 2.7% 22.0% 19.0% 19.0% . 100% Oakland n 5 . . 1 1 . 1 4 . 12 % 42.0% . . 8.3% 8.3% . 8.3% 33.0% . 100% Orange County n 41 10 4 3 . 5 9 30 2 104 % 39.0% 9.6% 3.8% 2.9% . 4.8% 8.7% 29.0% 1.9% 100.0% Phoenix-Mesa n 10 . . . 6 3 . 19 % 53.0% . . . 32.0% 16.0% . 100.0% Riverside-San Bernardino n 19 1 . 2 . 2 8 2 2 36 % 53.0% 2.8% . 5.6% . 5.6% 22.0% 5.6% 5.6% 100.0% San Diego n 1 . . . 2 . 3 % 33.0% . . . 67.0% . 100.0% San Francisco n . . . 1 1 1 1 . . 4 % . . . 25.0% 25.0% 25.0% 25.0% . . 100.0% San Jose n . 1 . 1 . 2 . . . 4 % . 25.0% . 25.0% . 50.0% . . . 100.0% Santa Cruz-Watsonville n . . . 1 . . 1 % . . . 100.0% . . 100.0% Ventura n 1 . . . 1 % 100.0% . . . 100.0%Total block groups 88 14 9 11 3 20 39 52 4 240
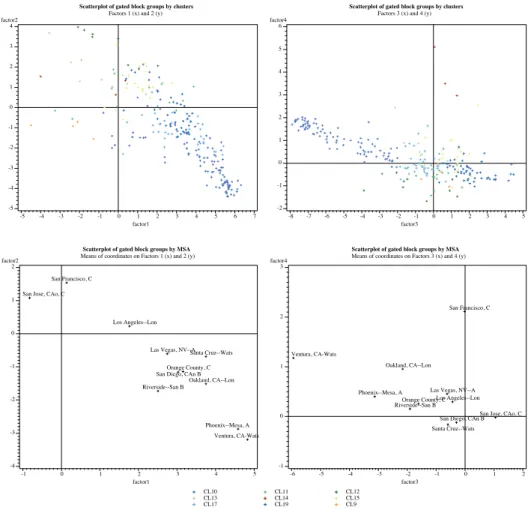
But data also show that different patterns are found across the different metropolitan
areas (Table 2). Figure 3 illustrates this point, and compares on the one hand the
typology of gated block groups only (top) and the centro¨ıds of gated block groups in
MSA, plotted on the four factorial axis. It is therefore possible to delineate four groups
of metropolitan areas, according to the local significance of gated block groups on social
patterns.
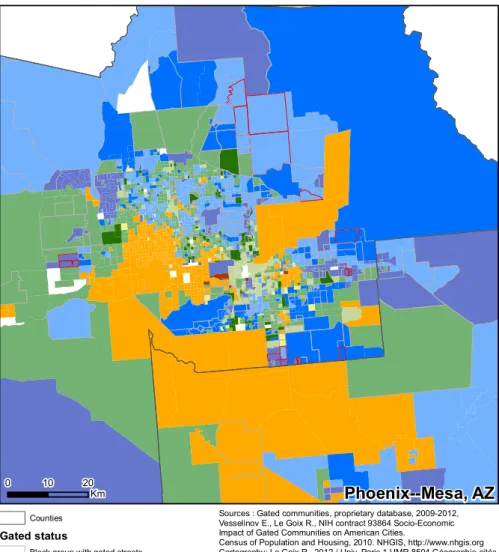
Phoenix and Mesa metropolitan (Figure 10) area represents the quintessence of a
metropolitan area in which larger gated developments are essentially retirement
commu-nities (CL10, 53%) and commucommu-nities for the older and wealthier share of the population
(CL17). Santa Cruz (Figure 18) and Ventura County (Figure 20), with only 1 large GC
each, also relate to this category. In San Diego (Figure 14), larger gated communities
either belong to the retirement category, or to the more affluent neighborhoods with an
overrepresentation of White families (CL19).
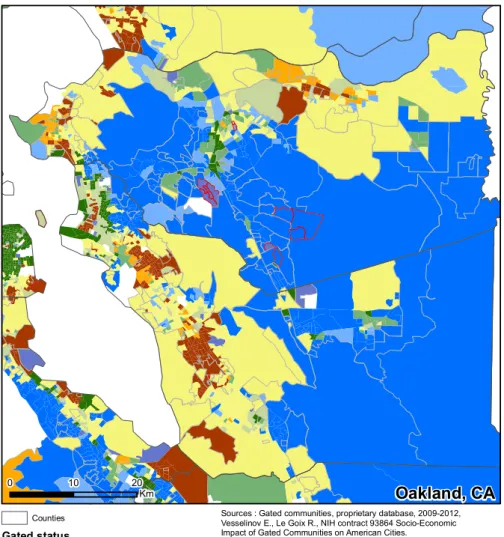
Riverside-San Bernardino (Figure 11), Orange County (Figure 9) and Oakland
(Fig-ure 8), although dominated by retirement communities, nevertheless show a more diverse
context for different types of gated neighborhoods: the more affluent White
neighbor-hoods (CL19) represent a significant share of large gated enclaves, up to 33%, along
with either more mixed neighborhoods (CL11 and CL13), Asian neighborhoods (CL 15)
and gated communities matching the residential market of Hispanics, and retirement
communities, in the Palm Springs area of Riverside-San Bernardino metropolitan area.
Both areas of Los Angeles (Figure 7), Las Vegas (Figure 6) show a more diverse
metropolitan model, in which larger gated communities are more likely to be found within
the richer White neighborhoods (19 and 21% respectively), but the whole spectrum
of the neighborhoods typology is covered by gated block groups, especially retirement
communities (CL10) and communities for the older and wealthier share of the population
(CL17), but also either mixed neighborhoods (CL11 and CL13) or Asian neighborhoods
(CL 15).
In San Francisco and San Jose, the small total number of gated block groups show
on the one hand the relative weakness of the phenomenon of large gated enclaves fitting
block groups geographies in these local contexts. On the other hand, it is nevertheless
significant that they all belong either to clusters describing the mixed neighborhoods of
Whites and Hispanics owners (CL11), the mixed and much younger neighborhoods with
average property values and less ownership (CL13), minority neighborhoods (CL14),
and more significantly asian neighborhoods (CL15) described by a relative median social
profile (Figures 15 and 16).
Scatterplot of gated block groups by clusters Factors 1 (x) and 2 (y) factor2 -5 -4 -3 -2 -1 0 1 2 3 4 factor1 -5 -4 -3 -2 -1 0 1 2 3 4 5 6 7
Scatterplot of gated block groups by clusters Factors 3 (x) and 4 (y) factor4 -2 -1 0 1 2 3 4 5 6 factor3 -8 -7 -6 -5 -4 -3 -2 -1 0 1 2 3 4 5 Scatterplot of gated block groups by MSA
Means of coordinates on Factors 1 (x) and 2 (y) factor2 -4 -3 -2 -1 0 1 2 factor1 -1 0 1 2 3 4 5 Las Vegas, NV--A
Los Angeles--Lon
Oakland, CA--Lon Orange County, C
Phoenix--Mesa, A Riverside--San B
San Diego, CAn B San Francisco, C
San Jose, CAo, C
Santa Cruz--Wats
Ventura, CA-Wats
Scatterplot of gated block groups by MSA Means of coordinates on Factors 3 (x) and 4 (y) factor4 -1 0 1 2 3 factor3 -6 -5 -4 -3 -2 -1 0 1 2 Las Vegas, NV--A
Los Angeles--Lon Oakland, CA--Lon
Orange County, C Phoenix--Mesa, A
Riverside--San B San Diego, CAn B
San Francisco, C
San Jose, CAo, C Santa Cruz--Wats Ventura, CA-Wats
CL10 CL11 CL12 CL13 CL14 CL15 CL17 CL19 CL9
4.3
Block groups with gated streets: smaller gated communities are more diverse in
kind
Not surprisingly, smaller gated communities are more diverse in kind (Table ). When
considering block groups in which gated roads represent less than 50% of the
residen-tial road network, the first trend in amplitude is the overrepresentation of CL17 and
CL19, i.e. the older and wealthier share of the population, and the more affluent White
neighborhoods (44% of the 2563 block groups with gated roads, and on Table ). Strong
tendencies are found in Asian neighborhoods (CL15, 12.5%), in the mixed neighborhoods
of Whites and Hispanics owners (CL11, 15.5%), the mixed and much younger
neighbor-hoods with average property values and less ownership (CL13, 7.4%), and significantly
enough in mostly Hispanic, more modest and younger block groups (CL9, 7.2%).
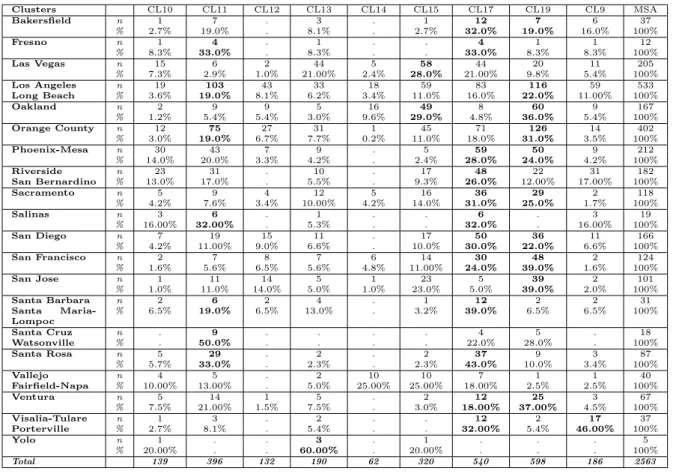
Table 3: Block groups with gated streets by socio-economic typology
Clusters CL10 CL11 CL12 CL13 CL14 CL15 CL17 CL19 CL9 MSA Bakersfield n 1 7 . 3 . 1 12 7 6 37 % 2.7% 19.0% . 8.1% . 2.7% 32.0% 19.0% 16.0% 100% Fresno n 1 4 . 1 . . 4 1 1 12 % 8.3% 33.0% . 8.3% . . 33.0% 8.3% 8.3% 100% Las Vegas n 15 6 2 44 5 58 44 20 11 205 % 7.3% 2.9% 1.0% 21.00% 2.4% 28.0% 21.00% 9.8% 5.4% 100% Los Angeles n 19 103 43 33 18 59 83 116 59 533 Long Beach % 3.6% 19.0% 8.1% 6.2% 3.4% 11.0% 16.0% 22.0% 11.00% 100% Oakland n 2 9 9 5 16 49 8 60 9 167 % 1.2% 5.4% 5.4% 3.0% 9.6% 29.0% 4.8% 36.0% 5.4% 100% Orange County n 12 75 27 31 1 45 71 126 14 402 % 3.0% 19.0% 6.7% 7.7% 0.2% 11.0% 18.0% 31.0% 3.5% 100% Phoenix-Mesa n 30 43 7 9 . 5 59 50 9 212 % 14.0% 20.0% 3.3% 4.2% . 2.4% 28.0% 24.0% 4.2% 100% Riverside n 23 31 . 10 . 17 48 22 31 182 San Bernardino % 13.0% 17.0% . 5.5% . 9.3% 26.0% 12.00% 17.00% 100% Sacramento n 5 9 4 12 5 16 36 29 2 118 % 4.2% 7.6% 3.4% 10.00% 4.2% 14.0% 31.0% 25.0% 1.7% 100% Salinas n 3 6 . 1 . . 6 . 3 19 % 16.00% 32.00% . 5.3% . . 32.0% . 16.00% 100% San Diego n 7 19 15 11 . 17 50 36 11 166 % 4.2% 11.00% 9.0% 6.6% . 10.0% 30.0% 22.0% 6.6% 100% San Francisco n 2 7 8 7 6 14 30 48 2 124 % 1.6% 5.6% 6.5% 5.6% 4.8% 11.00% 24.0% 39.0% 1.6% 100% San Jose n 1 11 14 5 1 23 5 39 2 101 % 1.0% 11.0% 14.0% 5.0% 1.0% 23.0% 5.0% 39.0% 2.0% 100% Santa Barbara n 2 6 2 4 . 1 12 2 2 31 Santa Maria-Lompoc % 6.5% 19.0% 6.5% 13.0% . 3.2% 39.0% 6.5% 6.5% 100% Santa Cruz n . 9 . . . . 4 5 . 18 Watsonville % . 50.0% . . . . 22.0% 28.0% . 100% Santa Rosa n 5 29 . 2 . 2 37 9 3 87 % 5.7% 33.0% . 2.3% . 2.3% 43.0% 10.0% 3.4% 100% Vallejo n 4 5 . 2 10 10 7 1 1 40 Fairfield-Napa % 10.00% 13.00% . 5.0% 25.00% 25.00% 18.00% 2.5% 2.5% 100% Ventura n 5 14 1 5 . 2 12 25 3 67 % 7.5% 21.00% 1.5% 7.5% . 3.0% 18.00% 37.00% 4.5% 100% Visalia-Tulare n 1 3 . 2 . . 12 2 17 37 Porterville % 2.7% 8.1% . 5.4% . . 32.00% 5.4% 46.00% 100% Yolo n 1 . . 3 . 1 . . . 5 % 20.00% . . 60.00% . 20.00% . . . 100% Total 139 396 132 190 62 320 540 598 186 2563
As a result, the share of block groups with gated streets belonging to the ”retirement
communities” category falls under the threshold of 5.4% (CL10), whereas it is the
domi-nant trend in absolute values for large gated enclaves. Furthermore, larger metropolitan
areas are on this respect less differentiated: they all follow the average trend with an
overrepresentation of block groups with gated streets within the clusters CL17 and 19,
along with an under-representation of retirement communities. An overrepresentation of
gated streets within the different types of average profile neighborhoods (CL11), within
mostly hispanic (CL9) or Asian (CL15) neighborhoods, also describe the trends that
af-fect larger metropolitan areas, for instance in Los Angles, San Diego, Orange, Phoenix,
Riverside-San Bernardino, San Jose, Ventura.
Smaller metropolitan areas, such as Santa Barbara, Salinas, Vallejo and Santa Cruz
show more specific profiles, where smaller gated commutes are very likely to be found
within the average profile of mixed White and Hispanic neighborhoods, in which
owner-ship of high property values predominates as the most significant discriminant
charac-teristics, along with an overrepresentation of more than 40 years-old (CL11);
5
Conclusion
In this investigation of the the socio-economic dimensions of gated communities in US
Western metropolitan areas, data show a contrasting understanding on their
contribu-tion to segregacontribu-tion patterns at the metropolitan level. The results show a contrasting
understanding on their contribution to segregation patterns. On the one hand,
regard-ing larger gated communities defined such as areas with more than 50% gated roads by
block groups (therefore fitting block group boundaries), data show the
overrepresenta-tion of both retirement communities, and wealthier White neighborhoods with older and
owner-occupied households, that describe more than 74% of the total subset of gated
block groups. Larger gated communities are more likely to be ”retirement
communi-ties”, the stronger trend relating to the amplitude of the diffusion of both large and
small gated communities within the wealthier neighborhoods. Metropolitan areas
differ-entiates according to the amplitude of the ”retirement communities” phenomenon (as
in Phoenix), and the contribution of gated communities to the affluent White
neighbor-hoods genre (as in Orange County, Riverside San Bernardino, Oakland). Some larger
metropolitan areas, such as Los Angeles, San Francisco or Las Vegas, have more diverse
profiles. On the other hand, our results demonstrate the social diffusion of gated
com-munities among other areas. Smaller gated comcom-munities (fitting our category ”block
groups with gated streets”) are often under-investigated, but are located within
con-texts and block groups which are more diverse in kind, as on table . Even though small
gated enclaves among wealthier and mostly White and aging neighborhood remain a
dominant structure, smaller gated communities are related with an overrepresentation
of gated streets within the different types of average profile neighborhoods, within mostly
hispanic or Asian neighborhoods, especially in Los Angles, San Diego, Orange, Phoenix,
Riverside-San Bernardino, San Jose, Ventura. These results contrast with the common
understanding of gated communities, homes of the riches and retired, which is partially
true for larger and highly visible gated enclaves that are found for instance in Orange
County and Phoenix. In this research, data show the really diverse and wide spectrum
of the gated and private realm of residential neighborhoods.
References
Bagaeen, S. and O. Uduku (2010). Gated communities: social sustainability in contemporary
and historical gated developments. London: Earthscan.
Bible, D. S. and C. Hsieh (2001). Gated communities and residential property values. Appraisal
Journal 69 (2), 140–145.
Cs´efalvay, Z. and C. Webster (2012). Gates or no gates? a cross-european enquiry into the
driving forces behind gated communities. Regional Studies 46 (3), 293–308.
Fox-Gotham, K. (2000). Urban space, restrictive covenants and the origins of racial segregation
in a us city, 1900-50. International Journal of Urban and Regional Research 24 (3), 616–633.
Kato, Y. (2006). Planning and social diversity: Residential segregation in american new towns.
Urban Studies (Routledge) 43 (12), 2285–2299.
Kennedy, D. J. (1995). Residential associations as state actors : Regulating the impact of gated
communities on nonmembers. Yale Law Journal 105 (3), pp.761–793.
Kirby, A., S. L. Harlan, L. Larsen, E. J. Hackett, B. Bolin, A. Nelson, T. Rex, and S. Wolf
(2006). Examining the significance of housing enclaves in the metropolitan united states of
america. Housing, Theory and Society 23 (1), 19–33.
Lacour-Little, M. and S. Malpezzi (2001, June 10, 2001). Gated communities and property
values. Research report, Wells Fargo Home Mortgage and Department of Real Estate and
Urban Land Economics - University of Wisconsin.
Le Goix, R. (2005). Gated communities: Sprawl and social segregation in southern california.
Housing Studies 20 (2), 323 – 343.
Le Goix, R. and E. Vesselinov (2012). Gated communities and house prices: Suburban change
in southern california, 1980–2008. Journal (forthcoming).
Le Goix, R. and C. J. Webster (2008). Gated communities. Geography Compass 2 (4), 1189–
1214.
Lee, S. and C. Webster (2006). Enclosure of the urban commons. GeoJournal 66 (1-2), 27–42.
Low, S. (2001). The edge and the center: Gated communities and the discourse of urban fear.
American Anthropologist 103 (1), 45–58.
Low, S. (2003). Behind the gates : life, security, and the pursuit of happiness in fortress
America. New York: Routledge.
Low, S. (2006). Towards a theory of urban fragmentation: A cross-cultural analysis of fear,
privatization, and the state. Cybergeo (349).
McKenzie, E. (1994). Privatopia: Homeowner Associations and the Rise of Residential Private
Government. New Haven CO ; London: Yale University Press.
McKenzie, E. (2003). Common interest housing in the communities of tomorrow. Housing
Policy Debates 14 (1-2), 203–234.
McKenzie, E. (2006). The dynamics of privatopia: Private residential governance in the usa.
Owens, J. B. (1997). Westec story : Gated communities and the fourth amendment. American
Criminal Law Review 34 (3), 1127–1160.
Sanchez, T. and R. E. Lang (2005). Security vs. status ? a first lool at the census’ gated
community data. Journal of Planning Education and Research 24 (3), 281–291.
Vesselinov, E., M. Cazessus, and W. Falk (2007). Gated communities and spatial inequality.
Journal of Urban Affairs 29 (2), 109–127.
Webster, C. (2007). Property rights, public space and urban design. Town Planning
Re-view 78 (1), 81–101.
Webster, C. J. (2002). Property rights and the public realm: Gates, green belts, and
gemein-schaft. Environment and Planning B: Planning and Design 29 (3), 397–412.
Wu, F. (2005). Rediscovering the ’gate” under market transition: From work-unit compounds
to commodity housing enclaves. Housing Studies 20 (2), 235 – 254.
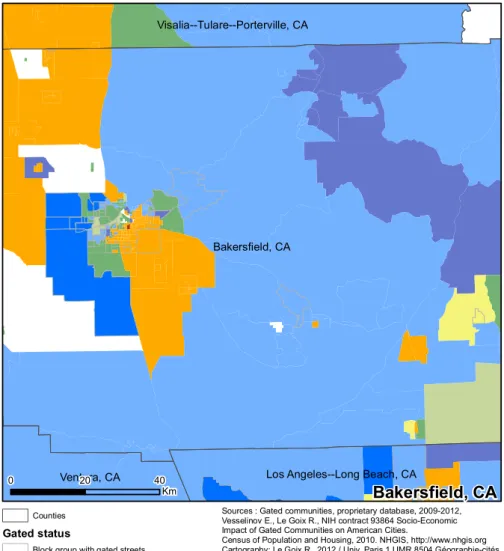
Ventura, CA
Los Angeles--Long Beach, CA
Bakersfield, CA
Visalia--Tulare--Porterville, CA
Bakersfield, CA
0 20 40 Km CountiesGated status
Block group with gated streets Gated block group (>50 % gated streets)
Socio-economic typology (2010)
N/A
Retirement neighborhoods. An overrepresentation of 65+, White and owners (CL10) Average profile neighborhoods, White and or Hispanics, mostly owners (CL11) Young adult mixed neighborhoods. 22-39 y.o., White, Asian, less owners (CL12) Mixed neighborhoods, with average values and less owners (CL13)
Minority neighborhoods. An overrepresentation of Blacks, younger, less owner status, lower property values (CL14) Asian neighborhoods.With a dominant profile of 22-49 y.o. and a relative median profile (CL15)
The end of the life-cycle: elderlies and owners. Racial mix with a White overrepresentationn and higher property values (CL17) Affluent White neighborhoods. White, higher property values, owners, families with children 5-17 (CL19)
Hispanic neighborhoods (younger population, lower value, fewer owners) (CL9)
Sources : Gated communities, proprietary database, 2009-2012, Vesselinov E., Le Goix R., NIH contract 93864 Socio-Economic Impact of Gated Communities on American Cities.
Census of Population and Housing, 2010. NHGIS, http://www.nhgis.org Cartography: Le Goix R., 2012 / Univ. Paris 1 UMR 8504 Géographie-cités.
Fresno, CA
Merced, CA
Visalia--Tulare--Porterville, CA
Fresno, CA
0 10 20 Km CountiesGated status
Block group with gated streets Gated block group (>50 % gated streets)
Socio-economic typology (2010)
N/A
Retirement neighborhoods. An overrepresentation of 65+, White and owners (CL10) Average profile neighborhoods, White and or Hispanics, mostly owners (CL11) Young adult mixed neighborhoods. 22-39 y.o., White, Asian, less owners (CL12) Mixed neighborhoods, with average values and less owners (CL13)
Minority neighborhoods. An overrepresentation of Blacks, younger, less owner status, lower property values (CL14) Asian neighborhoods.With a dominant profile of 22-49 y.o. and a relative median profile (CL15)
The end of the life-cycle: elderlies and owners. Racial mix with a White overrepresentationn and higher property values (CL17) Affluent White neighborhoods. White, higher property values, owners, families with children 5-17 (CL19)
Hispanic neighborhoods (younger population, lower value, fewer owners) (CL9)
Sources : Gated communities, proprietary database, 2009-2012, Vesselinov E., Le Goix R., NIH contract 93864 Socio-Economic Impact of Gated Communities on American Cities.
Census of Population and Housing, 2010. NHGIS, http://www.nhgis.org Cartography: Le Goix R., 2012 / Univ. Paris 1 UMR 8504 Géographie-cités.
Las Vegas, NV--AZ
Las Vegas
0 10 20 Km CountiesGated status
Block group with gated streets Gated block group (>50 % gated streets)
Socio-economic typology (2010)
N/A
Retirement neighborhoods. An overrepresentation of 65+, White and owners (CL10) Average profile neighborhoods, White and or Hispanics, mostly owners (CL11) Young adult mixed neighborhoods. 22-39 y.o., White, Asian, less owners (CL12) Mixed neighborhoods, with average values and less owners (CL13)
Minority neighborhoods. An overrepresentation of Blacks, younger, less owner status, lower property values (CL14) Asian neighborhoods.With a dominant profile of 22-49 y.o. and a relative median profile (CL15)
The end of the life-cycle: elderlies and owners. Racial mix with a White overrepresentationn and higher property values (CL17) Affluent White neighborhoods. White, higher property values, owners, families with children 5-17 (CL19)
Hispanic neighborhoods (younger population, lower value, fewer owners) (CL9)
Sources : Gated communities, proprietary database, 2009-2012, Vesselinov E., Le Goix R., NIH contract 93864 Socio-Economic Impact of Gated Communities on American Cities.
Census of Population and Housing, 2010. NHGIS, http://www.nhgis.org Cartography: Le Goix R., 2012 / Univ. Paris 1 UMR 8504 Géographie-cités.
Los Angeles, CA
0 10 20
Km Counties
Gated status
Block group with gated streets Gated block group (>50 % gated streets)
Socio-economic typology (2010)
N/A
Retirement neighborhoods. An overrepresentation of 65+, White and owners (CL10) Average profile neighborhoods, White and or Hispanics, mostly owners (CL11) Young adult mixed neighborhoods. 22-39 y.o., White, Asian, less owners (CL12) Mixed neighborhoods, with average values and less owners (CL13)
Minority neighborhoods. An overrepresentation of Blacks, younger, less owner status, lower property values (CL14) Asian neighborhoods.With a dominant profile of 22-49 y.o. and a relative median profile (CL15)
The end of the life-cycle: elderlies and owners. Racial mix with a White overrepresentationn and higher property values (CL17) Affluent White neighborhoods. White, higher property values, owners, families with children 5-17 (CL19)
Hispanic neighborhoods (younger population, lower value, fewer owners) (CL9)
Sources : Gated communities, proprietary database, 2009-2012, Vesselinov E., Le Goix R., NIH contract 93864 Socio-Economic Impact of Gated Communities on American Cities.
Census of Population and Housing, 2010. NHGIS, http://www.nhgis.org Cartography: Le Goix R., 2012 / Univ. Paris 1 UMR 8504 Géographie-cités.
Oakland, CA
0 10 20
Km Counties
Gated status
Block group with gated streets Gated block group (>50 % gated streets)
Socio-economic typology (2010)
N/A
Retirement neighborhoods. An overrepresentation of 65+, White and owners (CL10) Average profile neighborhoods, White and or Hispanics, mostly owners (CL11) Young adult mixed neighborhoods. 22-39 y.o., White, Asian, less owners (CL12) Mixed neighborhoods, with average values and less owners (CL13)
Minority neighborhoods. An overrepresentation of Blacks, younger, less owner status, lower property values (CL14) Asian neighborhoods.With a dominant profile of 22-49 y.o. and a relative median profile (CL15)
The end of the life-cycle: elderlies and owners. Racial mix with a White overrepresentationn and higher property values (CL17) Affluent White neighborhoods. White, higher property values, owners, families with children 5-17 (CL19)
Hispanic neighborhoods (younger population, lower value, fewer owners) (CL9)
Sources : Gated communities, proprietary database, 2009-2012, Vesselinov E., Le Goix R., NIH contract 93864 Socio-Economic Impact of Gated Communities on American Cities.
Census of Population and Housing, 2010. NHGIS, http://www.nhgis.org Cartography: Le Goix R., 2012 / Univ. Paris 1 UMR 8504 Géographie-cités.
Orange County, CA
0 5 10
Km Counties
Gated status
Block group with gated streets Gated block group (>50 % gated streets)
Socio-economic typology (2010)
N/A
Retirement neighborhoods. An overrepresentation of 65+, White and owners (CL10) Average profile neighborhoods, White and or Hispanics, mostly owners (CL11) Young adult mixed neighborhoods. 22-39 y.o., White, Asian, less owners (CL12) Mixed neighborhoods, with average values and less owners (CL13)
Minority neighborhoods. An overrepresentation of Blacks, younger, less owner status, lower property values (CL14) Asian neighborhoods.With a dominant profile of 22-49 y.o. and a relative median profile (CL15)
The end of the life-cycle: elderlies and owners. Racial mix with a White overrepresentationn and higher property values (CL17) Affluent White neighborhoods. White, higher property values, owners, families with children 5-17 (CL19)
Hispanic neighborhoods (younger population, lower value, fewer owners) (CL9)
Sources : Gated communities, proprietary database, 2009-2012, Vesselinov E., Le Goix R., NIH contract 93864 Socio-Economic Impact of Gated Communities on American Cities.
Census of Population and Housing, 2010. NHGIS, http://www.nhgis.org Cartography: Le Goix R., 2012 / Univ. Paris 1 UMR 8504 Géographie-cités.
Phoenix--Mesa, AZ
0 10 20
Km Counties
Gated status
Block group with gated streets Gated block group (>50 % gated streets)
Socio-economic typology (2010)
N/A
Retirement neighborhoods. An overrepresentation of 65+, White and owners (CL10) Average profile neighborhoods, White and or Hispanics, mostly owners (CL11) Young adult mixed neighborhoods. 22-39 y.o., White, Asian, less owners (CL12) Mixed neighborhoods, with average values and less owners (CL13)
Minority neighborhoods. An overrepresentation of Blacks, younger, less owner status, lower property values (CL14) Asian neighborhoods.With a dominant profile of 22-49 y.o. and a relative median profile (CL15)
The end of the life-cycle: elderlies and owners. Racial mix with a White overrepresentationn and higher property values (CL17) Affluent White neighborhoods. White, higher property values, owners, families with children 5-17 (CL19)
Hispanic neighborhoods (younger population, lower value, fewer owners) (CL9)
Sources : Gated communities, proprietary database, 2009-2012, Vesselinov E., Le Goix R., NIH contract 93864 Socio-Economic Impact of Gated Communities on American Cities.
Census of Population and Housing, 2010. NHGIS, http://www.nhgis.org Cartography: Le Goix R., 2012 / Univ. Paris 1 UMR 8504 Géographie-cités.
Riverside--San Bernardino, CA
0 10 20
Km Counties
Gated status
Block group with gated streets Gated block group (>50 % gated streets)
Socio-economic typology (2010)
N/A
Retirement neighborhoods. An overrepresentation of 65+, White and owners (CL10) Average profile neighborhoods, White and or Hispanics, mostly owners (CL11) Young adult mixed neighborhoods. 22-39 y.o., White, Asian, less owners (CL12) Mixed neighborhoods, with average values and less owners (CL13)
Minority neighborhoods. An overrepresentation of Blacks, younger, less owner status, lower property values (CL14) Asian neighborhoods.With a dominant profile of 22-49 y.o. and a relative median profile (CL15)
The end of the life-cycle: elderlies and owners. Racial mix with a White overrepresentationn and higher property values (CL17) Affluent White neighborhoods. White, higher property values, owners, families with children 5-17 (CL19)
Hispanic neighborhoods (younger population, lower value, fewer owners) (CL9)
Sources : Gated communities, proprietary database, 2009-2012, Vesselinov E., Le Goix R., NIH contract 93864 Socio-Economic Impact of Gated Communities on American Cities.
Census of Population and Housing, 2010. NHGIS, http://www.nhgis.org Cartography: Le Goix R., 2012 / Univ. Paris 1 UMR 8504 Géographie-cités.
Placer
El Dorado
Sacramento
Yolo
Amador
Sutter
Yuba
Nevada
Calaveras
Solano
San Joaquin
San Joaquin
Sacramento, CA
0 10 20
Km Counties
Gated status
Block group with gated streets Gated block group (>50 % gated streets)
Socio-economic typology (2010)
N/A
Retirement neighborhoods. An overrepresentation of 65+, White and owners (CL10) Average profile neighborhoods, White and or Hispanics, mostly owners (CL11) Young adult mixed neighborhoods. 22-39 y.o., White, Asian, less owners (CL12) Mixed neighborhoods, with average values and less owners (CL13)
Minority neighborhoods. An overrepresentation of Blacks, younger, less owner status, lower property values (CL14) Asian neighborhoods.With a dominant profile of 22-49 y.o. and a relative median profile (CL15)
The end of the life-cycle: elderlies and owners. Racial mix with a White overrepresentationn and higher property values (CL17) Affluent White neighborhoods. White, higher property values, owners, families with children 5-17 (CL19)
Hispanic neighborhoods (younger population, lower value, fewer owners) (CL9)
Sources : Gated communities, proprietary database, 2009-2012, Vesselinov E., Le Goix R., NIH contract 93864 Socio-Economic Impact of Gated Communities on American Cities.
Census of Population and Housing, 2010. NHGIS, http://www.nhgis.org Cartography: Le Goix R., 2012 / Univ. Paris 1 UMR 8504 Géographie-cités.
Monterey
San Benito
Merced
Fresno
Santa Cruz Santa Clara
Santa Clara
Salinas, CA
0 10 20
Km Counties
Gated status
Block group with gated streets Gated block group (>50 % gated streets)
Socio-economic typology (2010)
N/A
Retirement neighborhoods. An overrepresentation of 65+, White and owners (CL10) Average profile neighborhoods, White and or Hispanics, mostly owners (CL11) Young adult mixed neighborhoods. 22-39 y.o., White, Asian, less owners (CL12) Mixed neighborhoods, with average values and less owners (CL13)
Minority neighborhoods. An overrepresentation of Blacks, younger, less owner status, lower property values (CL14) Asian neighborhoods.With a dominant profile of 22-49 y.o. and a relative median profile (CL15)
The end of the life-cycle: elderlies and owners. Racial mix with a White overrepresentationn and higher property values (CL17) Affluent White neighborhoods. White, higher property values, owners, families with children 5-17 (CL19)
Hispanic neighborhoods (younger population, lower value, fewer owners) (CL9)
Sources : Gated communities, proprietary database, 2009-2012, Vesselinov E., Le Goix R., NIH contract 93864 Socio-Economic Impact of Gated Communities on American Cities.
Census of Population and Housing, 2010. NHGIS, http://www.nhgis.org Cartography: Le Goix R., 2012 / Univ. Paris 1 UMR 8504 Géographie-cités.
San Diego
Riverside
Orange
San Diego, CA
0 10 20 Km CountiesGated status
Block group with gated streets Gated block group (>50 % gated streets)
Socio-economic typology (2010)
N/A
Retirement neighborhoods. An overrepresentation of 65+, White and owners (CL10) Average profile neighborhoods, White and or Hispanics, mostly owners (CL11) Young adult mixed neighborhoods. 22-39 y.o., White, Asian, less owners (CL12) Mixed neighborhoods, with average values and less owners (CL13)
Minority neighborhoods. An overrepresentation of Blacks, younger, less owner status, lower property values (CL14) Asian neighborhoods.With a dominant profile of 22-49 y.o. and a relative median profile (CL15)
The end of the life-cycle: elderlies and owners. Racial mix with a White overrepresentationn and higher property values (CL17) Affluent White neighborhoods. White, higher property values, owners, families with children 5-17 (CL19)
Hispanic neighborhoods (younger population, lower value, fewer owners) (CL9)
Sources : Gated communities, proprietary database, 2009-2012, Vesselinov E., Le Goix R., NIH contract 93864 Socio-Economic Impact of Gated Communities on American Cities.
Census of Population and Housing, 2010. NHGIS, http://www.nhgis.org Cartography: Le Goix R., 2012 / Univ. Paris 1 UMR 8504 Géographie-cités.
San Francisco, CA
0 10 20
Km Counties
Gated status
Block group with gated streets Gated block group (>50 % gated streets)
Socio-economic typology (2010)
N/A
Retirement neighborhoods. An overrepresentation of 65+, White and owners (CL10) Average profile neighborhoods, White and or Hispanics, mostly owners (CL11) Young adult mixed neighborhoods. 22-39 y.o., White, Asian, less owners (CL12) Mixed neighborhoods, with average values and less owners (CL13)
Minority neighborhoods. An overrepresentation of Blacks, younger, less owner status, lower property values (CL14) Asian neighborhoods.With a dominant profile of 22-49 y.o. and a relative median profile (CL15)
The end of the life-cycle: elderlies and owners. Racial mix with a White overrepresentationn and higher property values (CL17) Affluent White neighborhoods. White, higher property values, owners, families with children 5-17 (CL19)
Hispanic neighborhoods (younger population, lower value, fewer owners) (CL9)
Sources : Gated communities, proprietary database, 2009-2012, Vesselinov E., Le Goix R., NIH contract 93864 Socio-Economic Impact of Gated Communities on American Cities.
Census of Population and Housing, 2010. NHGIS, http://www.nhgis.org Cartography: Le Goix R., 2012 / Univ. Paris 1 UMR 8504 Géographie-cités.
San Jose, CA
0 5 10
Km Counties
Gated status
Block group with gated streets Gated block group (>50 % gated streets)
Socio-economic typology (2010)
N/A
Retirement neighborhoods. An overrepresentation of 65+, White and owners (CL10) Average profile neighborhoods, White and or Hispanics, mostly owners (CL11) Young adult mixed neighborhoods. 22-39 y.o., White, Asian, less owners (CL12) Mixed neighborhoods, with average values and less owners (CL13)
Minority neighborhoods. An overrepresentation of Blacks, younger, less owner status, lower property values (CL14) Asian neighborhoods.With a dominant profile of 22-49 y.o. and a relative median profile (CL15)
The end of the life-cycle: elderlies and owners. Racial mix with a White overrepresentationn and higher property values (CL17) Affluent White neighborhoods. White, higher property values, owners, families with children 5-17 (CL19)
Hispanic neighborhoods (younger population, lower value, fewer owners) (CL9)
Sources : Gated communities, proprietary database, 2009-2012, Vesselinov E., Le Goix R., NIH contract 93864 Socio-Economic Impact of Gated Communities on American Cities.
Census of Population and Housing, 2010. NHGIS, http://www.nhgis.org Cartography: Le Goix R., 2012 / Univ. Paris 1 UMR 8504 Géographie-cités.
Santa Barbara
San Luis Obispo
Kern
Ventura
Santa Barbara, CA
0 10 20 Km CountiesGated status
Block group with gated streets Gated block group (>50 % gated streets)
Socio-economic typology (2010)
N/A
Retirement neighborhoods. An overrepresentation of 65+, White and owners (CL10) Average profile neighborhoods, White and or Hispanics, mostly owners (CL11) Young adult mixed neighborhoods. 22-39 y.o., White, Asian, less owners (CL12) Mixed neighborhoods, with average values and less owners (CL13)
Minority neighborhoods. An overrepresentation of Blacks, younger, less owner status, lower property values (CL14) Asian neighborhoods.With a dominant profile of 22-49 y.o. and a relative median profile (CL15)
The end of the life-cycle: elderlies and owners. Racial mix with a White overrepresentationn and higher property values (CL17) Affluent White neighborhoods. White, higher property values, owners, families with children 5-17 (CL19)
Hispanic neighborhoods (younger population, lower value, fewer owners) (CL9)
Sources : Gated communities, proprietary database, 2009-2012, Vesselinov E., Le Goix R., NIH contract 93864 Socio-Economic Impact of Gated Communities on American Cities.
Census of Population and Housing, 2010. NHGIS, http://www.nhgis.org Cartography: Le Goix R., 2012 / Univ. Paris 1 UMR 8504 Géographie-cités.
Santa Clara
Santa Cruz
San Mateo
Monterey
San Benito
Santa Cruz-Watsonville, CA
0 10 20 Km CountiesGated status
Block group with gated streets Gated block group (>50 % gated streets)
Socio-economic typology (2010)
N/A
Retirement neighborhoods. An overrepresentation of 65+, White and owners (CL10) Average profile neighborhoods, White and or Hispanics, mostly owners (CL11) Young adult mixed neighborhoods. 22-39 y.o., White, Asian, less owners (CL12) Mixed neighborhoods, with average values and less owners (CL13)
Minority neighborhoods. An overrepresentation of Blacks, younger, less owner status, lower property values (CL14) Asian neighborhoods.With a dominant profile of 22-49 y.o. and a relative median profile (CL15)
The end of the life-cycle: elderlies and owners. Racial mix with a White overrepresentationn and higher property values (CL17) Affluent White neighborhoods. White, higher property values, owners, families with children 5-17 (CL19)
Hispanic neighborhoods (younger population, lower value, fewer owners) (CL9)
Sources : Gated communities, proprietary database, 2009-2012, Vesselinov E., Le Goix R., NIH contract 93864 Socio-Economic Impact of Gated Communities on American Cities.
Census of Population and Housing, 2010. NHGIS, http://www.nhgis.org Cartography: Le Goix R., 2012 / Univ. Paris 1 UMR 8504 Géographie-cités.
Sonoma
Yolo
Napa
Solano
Marin
Lake
Contra Costa
Alameda
Mendocino
San Francisco
Sacramento
Marin
Sutter
San Francisco
Santa Rosa, CA
Vallejo--Fairfield--Napa, CA
0 10 20
Km Counties
Gated status
Block group with gated streets Gated block group (>50 % gated streets)
Socio-economic typology (2010)
N/A
Retirement neighborhoods. An overrepresentation of 65+, White and owners (CL10) Average profile neighborhoods, White and or Hispanics, mostly owners (CL11) Young adult mixed neighborhoods. 22-39 y.o., White, Asian, less owners (CL12) Mixed neighborhoods, with average values and less owners (CL13)
Minority neighborhoods. An overrepresentation of Blacks, younger, less owner status, lower property values (CL14) Asian neighborhoods.With a dominant profile of 22-49 y.o. and a relative median profile (CL15)
The end of the life-cycle: elderlies and owners. Racial mix with a White overrepresentationn and higher property values (CL17) Affluent White neighborhoods. White, higher property values, owners, families with children 5-17 (CL19)
Hispanic neighborhoods (younger population, lower value, fewer owners) (CL9)
Sources : Gated communities, proprietary database, 2009-2012, Vesselinov E., Le Goix R., NIH contract 93864 Socio-Economic Impact of Gated Communities on American Cities.
Census of Population and Housing, 2010. NHGIS, http://www.nhgis.org Cartography: Le Goix R., 2012 / Univ. Paris 1 UMR 8504 Géographie-cités.
Ventura
Los Angeles
Kern
Santa Barbara
Santa Barbara
San Luis Obispo
Ventura
Ventura, CA
0 10 20
Km Counties
Gated status
Block group with gated streets Gated block group (>50 % gated streets)
Socio-economic typology (2010)
N/A
Retirement neighborhoods. An overrepresentation of 65+, White and owners (CL10) Average profile neighborhoods, White and or Hispanics, mostly owners (CL11) Young adult mixed neighborhoods. 22-39 y.o., White, Asian, less owners (CL12) Mixed neighborhoods, with average values and less owners (CL13)
Minority neighborhoods. An overrepresentation of Blacks, younger, less owner status, lower property values (CL14) Asian neighborhoods.With a dominant profile of 22-49 y.o. and a relative median profile (CL15)
The end of the life-cycle: elderlies and owners. Racial mix with a White overrepresentationn and higher property values (CL17) Affluent White neighborhoods. White, higher property values, owners, families with children 5-17 (CL19)
Hispanic neighborhoods (younger population, lower value, fewer owners) (CL9)
Sources : Gated communities, proprietary database, 2009-2012, Vesselinov E., Le Goix R., NIH contract 93864 Socio-Economic Impact of Gated Communities on American Cities.
Census of Population and Housing, 2010. NHGIS, http://www.nhgis.org Cartography: Le Goix R., 2012 / Univ. Paris 1 UMR 8504 Géographie-cités.
Tulare
Kern
Inyo
Fresno
Kings
Visalia--Tulare--Porterville, CA
0 10 20 Km CountiesGated status
Block group with gated streets Gated block group (>50 % gated streets)
Socio-economic typology (2010)
N/A
Retirement neighborhoods. An overrepresentation of 65+, White and owners (CL10) Average profile neighborhoods, White and or Hispanics, mostly owners (CL11) Young adult mixed neighborhoods. 22-39 y.o., White, Asian, less owners (CL12) Mixed neighborhoods, with average values and less owners (CL13)
Minority neighborhoods. An overrepresentation of Blacks, younger, less owner status, lower property values (CL14) Asian neighborhoods.With a dominant profile of 22-49 y.o. and a relative median profile (CL15)
The end of the life-cycle: elderlies and owners. Racial mix with a White overrepresentationn and higher property values (CL17) Affluent White neighborhoods. White, higher property values, owners, families with children 5-17 (CL19)
Hispanic neighborhoods (younger population, lower value, fewer owners) (CL9)
Sources : Gated communities, proprietary database, 2009-2012, Vesselinov E., Le Goix R., NIH contract 93864 Socio-Economic Impact of Gated Communities on American Cities.
Census of Population and Housing, 2010. NHGIS, http://www.nhgis.org Cartography: Le Goix R., 2012 / Univ. Paris 1 UMR 8504 Géographie-cités.