HAL Id: hal-02399004
https://hal.archives-ouvertes.fr/hal-02399004v2
Submitted on 11 Dec 2019
HAL is a multi-disciplinary open access
archive for the deposit and dissemination of
sci-entific research documents, whether they are
pub-lished or not. The documents may come from
teaching and research institutions in France or
abroad, or from public or private research centers.
L’archive ouverte pluridisciplinaire HAL, est
destinée au dépôt et à la diffusion de documents
scientifiques de niveau recherche, publiés ou non,
émanant des établissements d’enseignement et de
recherche français ou étrangers, des laboratoires
publics ou privés.
subsidence and quiescence at Ambrym (Vanuatu): the
influence of regional tectonics
Tara Shreve, Raphael Grandin, Marie Boichu, Esline Garaebiti, Yves
Moussallam, Valérie Ballu, Francisco Delgado, Frédérique Leclerc, Martin
Vallée, Nicolas Henriot, et al.
To cite this version:
Tara Shreve, Raphael Grandin, Marie Boichu, Esline Garaebiti, Yves Moussallam, et al.. From
prodi-gious volcanic degassing to caldera subsidence and quiescence at Ambrym (Vanuatu): the influence of
regional tectonics. Scientific Reports, Nature Publishing Group, 2019, 9, pp.18868.
�10.1038/s41598-019-55141-7�. �hal-02399004v2�
from prodigious volcanic degassing
to caldera subsidence and
quiescence at Ambrym (Vanuatu):
the influence of regional tectonics
tara Shreve
1*, Raphaël Grandin
1*, Marie Boichu
2,3, esline Garaebiti
4, Yves Moussallam
5,6,
Valérie Ballu
7, francisco Delgado
1, frédérique Leclerc
8, Martin Vallée
1, nicolas Henriot
2,
Sandrine cevuard
4, Dan tari
4, pierre Lebellegard
9& Bernard pelletier
9Eruptive activity shapes volcanic edifices. The formation of broad caldera depressions is often associated with major collapse events, emplacing conspicuous pyroclastic deposits. However, caldera subsidence may also proceed silently by magma withdrawal at depth, more difficult to detect. Ambrym, a basaltic volcanic island, hosts a 12-km wide caldera and several intensely-degassing lava lakes confined to intra-caldera cones. Using satellite remote sensing of deformation, gas emissions and thermal anomalies, combined with seismicity and ground observations, we show that in December 2018 an intra-caldera eruption at Ambrym preceded normal faulting with >2 m of associated uplift along the eastern rift zone and 2.5 m of caldera-wide subsidence. Deformation was caused by lateral migration of >0.4 cubic kilometers of magma into the rift zone, extinguishing the lava lakes, and feeding a submarine eruption in the rift edge. Recurring rifting episodes, favored by stress induced by the D’Entrecasteaux Ridge collision against the New Hebrides arc, lead to progressive subsidence of Ambrym’s caldera and concurrent draining of the lava lakes. Although counterintuitive, convergent margin systems can induce rift zone volcanism and subsequent caldera subsidence.
Broad caldera formation (>10 km in diameter) is often attributed to ignimbrite-forming, explosive eruptions1.
For mafic to intermediate systems, however, caldera-forming processes may also be linked to the lateral propa-gation of dikes that arrest at depth2–5. Consequently, geological traces of associated magma discharge are often
missing. Understanding caldera-forming processes thus relies heavily on contemporaneous observations, such as in 1968 at Fernandina and 2000 at Miyakejima6,7. Ambrym, a remarkably active volcanic island in the
Vanuatu archipelago, hosts a 12-km wide caldera, making it one of the largest basaltic shield calderas on Earth8,9.
Ambrym’s caldera has been previously interpreted as resulting from the collapse of a giant tuff cone resulting from a sequence of explosive phreatomagmatic eruptions10. Onset of caldera subsidence is dated around 2000 BP,
based on two 14C dates of charcoal embedded in debris flows on the caldera rim and flank11. However, geological
evidence for emplacement of voluminous ignimbrites coinciding with this dating is controversial12–14, raising
questions about the process of caldera formation.
Ambrym, in addition to its broad caldera, also hosts two well-defined straight rift zones oriented at N105°S, radiating bilaterally10,11,15–17 (Fig. 1). Ambrym’s caldera is the site of intense eruptive activity, with frequent
strom-bolian eruptions originating from at least two permanent lava lakes within or on the flanks of the cones of Marum and Benbow as well as occasional intra-caldera lava flows, most recently in 1986, 1988 and 201512,18,19. Continuous
1Université de Paris, Institut de physique du globe de Paris, CNRS, F-75005, Paris, France. 2Univ. Lille, UMR 8518
- LOA - Laboratoire d’Optique Atmosphérique, F-59000, Lille, France. 3CNRS, UMR 8518, F-59000, Lille, France. 4Vanuatu Meteorology and Geohazards Department (VMGD), Port Vila, Vanuatu. 5Laboratoire Magmas et Volcans
(LMV), Université Clermont Auvergne, Clermont-Ferrand, 63170, France. 6Lamont-Doherty Earth Observatory,
Columbia University, New York, USA. 7Laboratoire Littoral Environnement et Sociétés (LIENSs), Université de
La Rochelle, La Rochelle, 17000, France. 8Géoazur, Univ. Nice Sophia Antipolis (Univ. Côte d’Azur, CNRS, IRD,
Observatoire de la Côte d’Azur), Géoazur UMR 7329, 250 rue Albert Einstein, Sophia Antipolis, 06560, Valbonne, France. 9Géoazur, Institut de recherche pour le développement, Nouméa, 98800, New Caledonia. *email: shreve@ ipgp.fr; grandin@ipgp.fr
open-vent passive degassing from the lava lakes, first reported by Captain James Cook in 177420, ranks Ambrym
first in worldwide volcanic sulfur dioxide (SO2) emissions over the past decade21–24.
Between 1820 and 1937, 10 extra-caldera rift eruptions were reported at Ambrym18. Notably, in 1913, a
phre-atomagmatic eruption on the island’s west coast completely destroyed a large hospital25. Based on geochemical
evidence, these eruptions are believed to be fed from a central reservoir situated beneath the caldera, and magma transported to the coast by lateral dikes26. However, the response of the caldera ring faults during these past lateral
eruptions is undetermined, due to a lack of direct observations. Hence, whether the broad caldera of Ambrym should be interpreted as a relict structure, or should be considered an active fault system, remains an open ques-tion. More broadly, the relationship between the evolution of Ambrym’s caldera, the rift zone’s persistence, and the complex tectonic setting of the New Hebrides is yet to be explored.
Results
Precursory intra-caldera eruption.
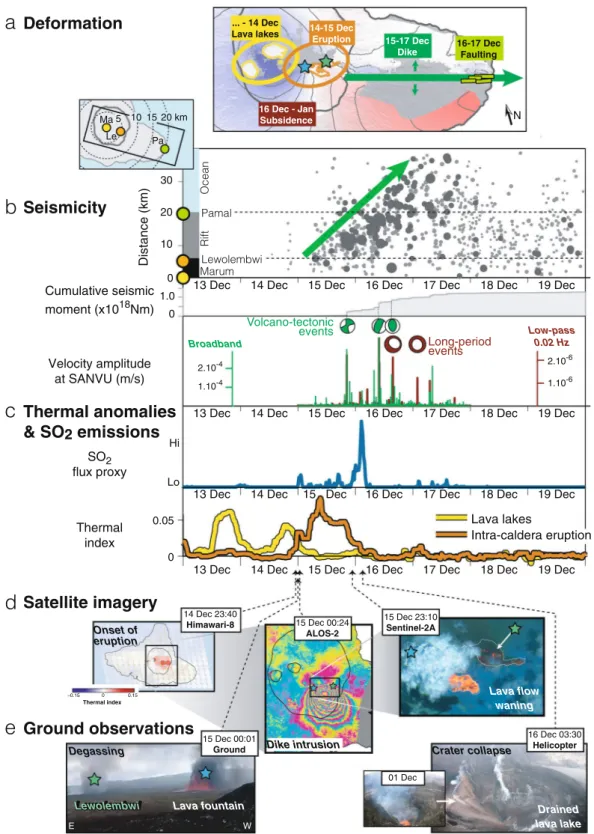
On 14 December 2018, a volcano-seismic crisis begins at Ambrym when 8 M < 3 seismic events are detected inside the caldera between 13h00 and 20h00 UTC (Fig. 2b). Between 23h20 and 23h40 UTC, Himawari-8 geostationary satellite observations of thermal anomalies and SO2 emissions indicate the onset of an intra-caldera eruption (Fig. 2c,d, Supplementary Figs. S1, S2). Field observations (Fig. 2e)Figure 1. Tectonic and volcanic context of Ambrym. (a) Tectonic framework of the Central Vanuatu arc
(modified after71). Collision of the D’Entrecasteaux Ridge (DER), carried by the Australian plate (AUS) leads
to (1) along-strike variations of the convergence rate (pink arrows) of AUS w.r.t Pacific plate (PAC) across the New Hebrides subduction (pink) and (2) deformation of the Vanuatu arc on the border of the Pacific plate, accommodated by the back-arc thrust belt (BATB), giving rise to an uplifted bivergent thrust wedge. Arrows indicate local relative velocities across the BATB (blue) and Vate trough (orange). Velocities in cm/yr are from72.
Yellow triangles are active volcanoes. Yellow lines indicate rift zones. Va: Vate; Ku: Kuwae; Ep: Epi; Lo: Lopevi; Mk: Malekula; Sa: Santo; Pe: Pentecost; Mw: Maewo; Ga: Gaua; Me: Mere Lava. (b) Simplified geological map of Ambrym (after11 and18). Younger volcanic formations are indicated by light shading. Locations of historical
fissure vents along the rift zones are shown by thick colored lines. Approximate locations of the 2018 intra-caldera eruption and extra-intra-caldera intrusion are indicated in red. Inset is a false-color Sentinel-2 image acquired on 25 November 2018 (R: band 12; G: band 11; B: band 08), showing six thermal anomalies associated with lava lakes and open vents. (c) Unwrapped ascending ALOS-2 interferogram spanning between 24 November 2018 and 22 December 2018. Blue (respectively red) indicates motion away from the satellite (respectively toward the satellite). Maps were generated with GMT version 5.4.3 (http://gmt.soest.hawaii.edu) and edited in Adobe Illustrator version 16.0.4 (https://www.adobe.com/products/illustrator.html).
0 10 20 30 Distance (km) SO2 flux proxy 14 Dec
13 Dec 15 Dec 16 Dec 17 Dec 18 Dec 19 Dec Lo
Hi
14 Dec
13 Dec 15 Dec 16 Dec 17 Dec 18 Dec 19 Dec 14 Dec
13 Dec 15 Dec 16 Dec 17 Dec 18 Dec 19 Dec 14 Dec
13 Dec 15 Dec 16 Dec 17 Dec 18 Dec 19 Dec 0 1.0 Cumulative seismic moment (x1018Nm) Volcano-tectonic events Long-period events Velocity amplitude at SANVU (m/s) 2.10 -4 1.10-4 2.10-6 1.10-6 E W 15 Dec 00:01 Ground 15 Dec 00:24 ALOS-2 16 Dec 03:30 Helicopter 01 Dec Thermal index 14 Dec 23:40
Himawari-8 15 Dec 23:10Sentinel-2A
Ocean Rift MarumLewolembwi Pamal 0.05 0 Lava lakes Intra-caldera eruption Degassing Lewolembwi Lewolembwi Dike intrusion Lava fountain Lava flow waning Onset of eruption Drained lava lake Crater collapse Thermal index –0.15 0 0.15 15-17 Dec
Dike 16-17 DecFaulting
16 Dec - Jan Subsidence 14-15 Dec Eruption ... - 14 Dec Lava lakes N 5 10 15 20 km Pa Le Ma
Seismicity
Thermal anomalies
& SO
2emissions
Satellite imagery
Deformation
a
c
d
Ground observations
e
b
Broadband Low-pass 0.02 HzFigure 2. Temporal evolution of eruptive activity during the December 2018 event. (a) ALOS-2 interferogram
of Fig. 1c (JAXA). (b) Upper panel: seismicity versus time, as a function of planimetric distance with respect to Marum lava lake. Symbol size increases with earthquake magnitude (dark grey: M > 3.5; light grey: M < 3.5). Green arrow highlights migration of seismicity along the east rift zone. Middle panel: cumulative seismic moment release. Focal mechanisms are from USGS (green) and GCMT (maroon). Lower panel: Absolute value of broadband (green) and low-passed (maroon) seismogram at SANVU Geoscope station (epicentral distance ~150 km)31. Spikes in the low-passed seismogram indicate detection of long period (LP) events. These events
are not included in the cumulative seismic moment curve, which only includes volcano-tectonic (VT) events reported by VMGD. See Supplementary Fig. S14 for details and station location. (c) SO2 flux proxy (blue) and thermal index of the lava lakes (yellow) and intra-caldera eruption (orange) derived from Himawari-8. (d) Satellite images acquired during the course of the eruption. Left: Himawari-8 (multispectral, geostationary)
reveal that the eruption initiated along a N110° pre-existing fracture at 590 meters a.s.l. at Lewolembwi tuff ring (Supplementary Fig. S3), and was characterized by scoria deposits associated with lava fountaining. Petrological analysis of scoria indicates an erupted magma of basaltic-trachy-andesitic composition (Supplementary Table S4). Once the eruption begins, thermal anomalies associated with the lava lakes progressively disappear within 12 hours, suggesting a drop in lava lake level (Fig. 2c, Supplementary Fig. S1). A helicopter flight (on 16 December 03h30 UTC) confirms both drainage of all the lava lakes and the partial collapse of Benbow and Marum (Fig. 2e). A lava flow, accompanied by lava fountaining and producing SO2 and ash-rich emissions, is also emitted for ~24 hours from a second vent trending nearly N–S at 730 meters a.s.l. on the SE flank of Marum (Fig. 2c,e, Supplementary Fig. S3).
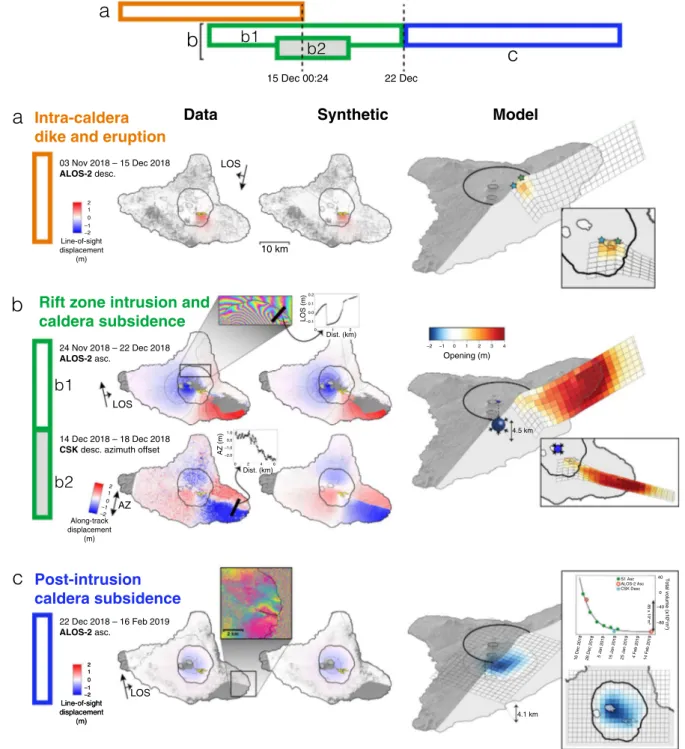
During this phase, surface deformation is measured with interferometric synthetic aperture radar (InSAR) thanks to the serendipitous acquisition of an image by the ALOS-2 satellite at 00h24 UTC on 15 December, about an hour after the eruption’s onset27 (Fig. 2d, Supplementary Table S1). The deformation field spanning
3 November to 15 December measures ~1.2 m of motion towards the satellite, consistent with an intra-caldera dike dipping 40°S and a maximum opening of ~2 m, yielding a total volume of intruded magma of ~34 × 106 m3 (Supplementary Fig. S4). Until then, InSAR measures neither subsidence related to magma reservoir deflation, nor extra-caldera displacement, particularly no motion along the rift zones.
While Sentinel-2 satellite optical images indicate that lava flows reach their full extent on 15 December 23h10 (Fig. 2d), the eruption ends on 16 December around 07h00 UTC with a disappearance of thermal anomalies and an abrupt decrease of SO2/ash emissions (Fig. 2c). Spaceborne imaging of SO2 by Sentinel-5P TROPOMI sensor constrains the total mass of released SO2 during the eruption to at least ~50–60 kt (Supplementary Fig. S10), corresponding to a volume of degassed magma of ~13 × 106 m3 (calculated assuming <5% crystal content and 0.075 wt% of sulphur in the melt23). First-order agreement with the volume of erupted material derived from
mapping of the flow of ~10 × 106 m3 (constrained by multiplying the spatial extent of ~1.95 × 10⁶ m2 for the lava flow, Supplementary Fig. S3, and an estimated average lava flow thickness of ~5 m extrapolated from 3D mapping of the previous 2015 intra-caldera lava flow, Supplementary Fig. S11) suggests that the magma remaining trapped in the dike did not contribute significantly to the observed degassing.
Triggering of extra-caldera dike injection.
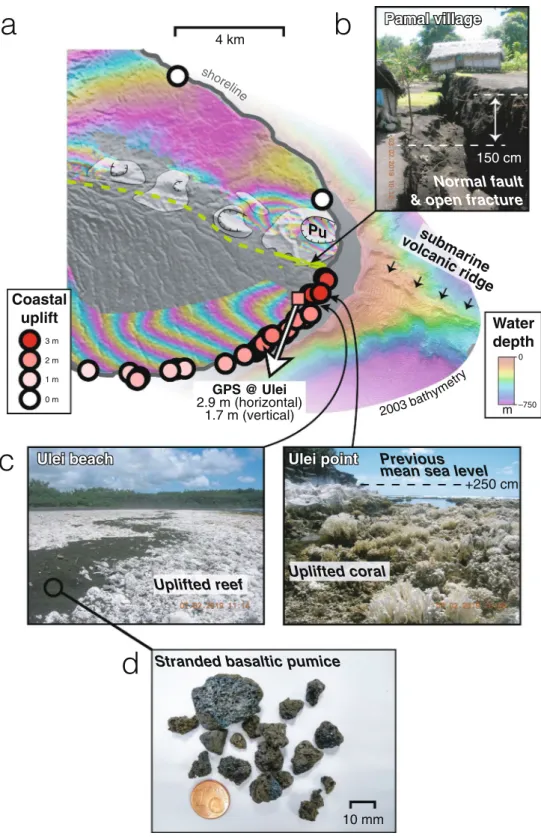
Following a Mw 5.6 strike-slip earthquake on 15 Decemberat 20h21, a sharp increase in the seismic moment release is detected, marking the beginning of magma propa-gation into the SE rift zone (Fig. 2b). A few hours before the intra-caldera eruption’s end, the lateral propagation of a voluminous dike is evidenced by a migration of seismicity from the caldera toward the eastern tip of the island, reaching 30 km from the eastern caldera rim by 17 December 12h00 UTC. Sub-pixel correlation of a Sentinel-2 optical image acquired on 15 December 23h10 UTC indicates that at that time the dike tip is leav-ing the caldera but did not reach farther than halfway to the east coast (Supplementary Fig. S15). On 16–17 December, local inhabitants report progressive fracturing at the coastal village of Pamal (13 km from the cal-dera border) (Fig. 3a,b). Joint inversion of SAR data (Supplementary Table S1) reveals ~3 m of opening along a >30 km long dike, extending from within the caldera to beyond the eastern coast27 (Figs. 2a and 4b). These SAR
geodetic observations indicate the emplacement of a dike with a total volume of intruded magma between 419 and 532 × 106 m3 (depending on the maximum depth and how far offshore the model extends, Supplementary Figs. S5, S6). Surface deformation across the trace of the dike is asymmetric, with more deformation to the south (Fig. 3a), indicating that the dike dips ~70° to the south. Due to this asymmetry, coastal uplift in excess of 2 meters occurred along the southeastern coast of the island, as later confirmed during a field campaign in early February and by a single GPS measurement at Ulei (Fig. 3a,c).
Submarine eruption and caldera subsidence.
The extremely narrow breadth of the faulted corridor observed above the dike at the surface, as small as 400 m along the east coast (Fig. 3b), indicates that the dike almost reached the surface. However, magma does not erupt from on-shore fractures and only minor gas emis-sions are detected from space until 17 December 14h00 UTC (Fig. 2c). The end of dike propagation, marked by an abrupt decrease of seismic moment release, takes place around 17 December 16h00 UTC (Fig. 2b). InSAR-derived models predict that maximum opening at the surface occurs offshore (Fig. 4b, Supplementary Fig. S6), suggesting a submarine eruption. This is confirmed on 18–19 December, when basaltic pumice is collected on the beach near Pamal and Ulei (Fig. 3c,d), indicating that lava erupted underwater. Although the depth and exact location of the underwater fissure are uncertain, the nature of erupted material (basaltic pumice) indicates a shallow (<100 m b.s.l) and high-rate underwater magma supply able to sustain a protective gas-rich envelope which allows pumice to cool before contact with sea water, preventing it from sinking28. This transport method differs from, forexam-ple, floating eruption products collected during basaltic eruptions in the Azores, when gas trapped in hollow cavities caused buoyant basaltic balloons to float to the ocean surface29. An alignment of volcanic cones visible
in the bathymetry is consistent with an offshore prolongation of the rift zone, suggesting that similar submarine eruptions took place in the past (Fig. 3a).
In addition to the dike intrusion, we also measure >2 m of subsidence at Ambrym’s summit craters, con-sistent with deflation of a nearly symmetrical pressurized source, roughly centered on Marum at ~4.5 km (Japan Meteorological Agency). Center: ALOS-2 (ScanSAR) (JAXA). Right: Sentinel-2 (optical). (e) Ground observations. Left: gas emissions at Lewolembwi (green star) and lava fountaining associated with vent opening on the SE flank of Marum (blue star). Image courtesy of and copyright to John Tasso, Vanuatu Island Experience. Right: Comparison of lava lake crater at Benbow before and in the final hours of the eruption. Maps generated with GMT and edited in Adobe Illustrator.
2003 bat hymetr y shore line –750 0
Water
depth
mPu
4 kmCoastal
uplift
0 m 1 m 2 m 3 m GPS @ Ulei 2.9 m (horizontal) 1.7 m (vertical)submarin
e
volcanic ridge
Ulei beach
Pamal village
Pamal village
Uplifted coral
Uplifted reef
150 cmStranded basaltic pumice
Ulei point
Ulei point
Ulei beach
Normal fault
& open fracture
Previous
mean sea level
+250 cm 10 mm
b
a
d
c
Figure 3. Faulting, coastal uplift and submarine eruption at the east coast of Ambrym. (a) Circles: coastal uplift
derived from field mapping of dead coral and red algae. Green segments: fractures mapped in the field. Dashed green line: trace of the dike derived from SAR data. White arrow: motion of GPS Ulei site. Small black arrows indicate the location of a submarine volcanic ridge visible in high-resolution bathymetry acquired in 2003 (see Supplementary Methods). Pu: Pulvenu cone. Background is the wrapped ALOS-2 interferogram of Fig. 1c, where each fringe represents 12.1 cm of motion toward or away from the satellite. DEM ©DLR 2017. Maps generated with GMT and edited in Adobe Illustrator. (b) Normal faulting and fracturing at Pamal village. (c) Evidence for coastal uplift from dead coral. Black deposits consist of pumice stranded along the coast at Ulei. (d) Detail of a pumice sample.
depth, with a volume change ranging between 195 and 231 × 106 m3 (depending on the depth and amount of post-eruptive deformation included in the data, Supplementary Fig. S7, Table S3) (Fig. 4c). The 2:1 volume ratio between the dike and deflating Mogi source is in fact consistent with mass conservation assuming standard
LOS −2 −10 AZ Along-track displacement (m) 1 2 LOS 10 km −2 0 1 –1 2 Line-of-sight displacement (m) −2 0 1 –1 2 Line-of-sight displacement (m) −2 0 1 –1 2 Line-of-sight displacement (m) 0.0 0.1 0.2 –0.1 0 1 2 LOS (m) Dist. (km) 1.0 0.0 –2.0 –1.0 0 2 4 6 AZ (m) Dist. (km) LOS
Data
Synthetic
Model
−2 −1 0 1 2 3 4 Opening (m) 4.1 km 4.5 km
a
b
b1
b2
c
22 Dec 2018 – 16 Feb 2019 ALOS-2 asc. 14 Dec 2018 – 18 Dec 2018CSK desc. azimuth offset
24 Nov 2018 – 22 Dec 2018 ALOS-2 asc. 03 Nov 2018 – 15 Dec 2018 ALOS-2 desc.
a
b
b1
b2
c
15 Dec 00:24 22 Dec S1 Asc ALOS-2 Asc CSK Desc 01 x( e mu lo v l at o T 6 m 3 )16 Dec 2018 26 Dec 2018 5 Jan 2019 15 Jan 2019 25 Jan 2019 4 Feb 2019 14 Feb 2019
01 x 5 8 6 m 3 40 –40 0 –80
Post-intrusion
caldera subsidence
Rift zone intrusion and
caldera subsidence
Intra-caldera
dike and eruption
Figure 4. Deformation during and after the December 2018 event from InSAR. Left: data. Middle: synthetic.
Right: model. (a) ALOS-2 interferogram covering the small-volume dike intrusion emplaced on 14 December (last image acquired on 15 December, 00h24). Dike inflation is indicated by red colors. Contraction or deflation is indicated by blue colors. (b) ALOS-2 interferogram (top) and COSMO-SkyMed azimuth offsets (bottom) covering the 15–18 December time interval. First inset shows local fringe discontinuities across the northern caldera rim, evidence of normal faulting. Second inset shows a profile of horizontal displacement across the dike. (c) ALOS-2 interferogram covering the post-intrusion caldera subsidence (first image acquired on 22 December). Inset to the left shows detail of deformation along the east coast. Inset to the right shows temporal evolution of post-intrusion subsidence derived from Sentinel-1, ALOS-2 and CSK (See Supplementary Fig. S7). Maps were generated with GMT version 5.4.3 (http://gmt.soest.hawaii.edu) and edited in Adobe Illustrator version 16.0.4 (https://www.adobe.com/products/illustrator.html).
magma compressibility and host-rock shear modulus30. Furthermore, SAR data indicate that caldera
subsid-ence occurred between 15 December 00h24 and 18 December 06h10, hsubsid-ence was coeval to the extra-caldera dike intrusion (Fig. 4b2). There are several locations to the north of the caldera where the ascending ALOS-2 fringe pattern is discontinuous, indicating ~0.4 m slip along the caldera faults (Fig. 4b1, Supplementary Fig. S8). Two Mw
~5.6 earthquakes with vertical compensated-linear-vector-dipole (CLVD) focal mechanisms are recorded in the migration’s final 24 hours, on 16 December 15h34 UTC and 17 December 01h49 (Fig. 2b). These events are char-acterized by a long period (LP) content and long duration (exceeding 10 s of seconds) (Fig. 2b, Supplementary Fig. S14). At least 4 additional LP signals are recorded at station SANVU (~150 km away) on 16–17 December31.
These LP events with CLVD mechanisms are consistent with caldera ring faulting or pressure drop within a reservoir32.
In the weeks following the dike emplacement, caldera-wide subsidence, reaching ~80 cm at Marum crater and decaying exponentially with a half-life of about 6 days, is measured using ALOS-2 and Sentinel-1 InSAR (Fig. 4c, Supplementary Fig. S7). Exponentially decaying subsidence is consistent with elastic response to magma outflow driven by pressure difference between the central reservoir and the eruption site33. Modeling of this
subsidence indicates a horizontal sill at ~4.1 km depth deflating with a total volume change of ~85 × 106 m3 (Fig. 4c). This sill-shaped post-intrusion deflation contrasts with the Mogi-shaped co-intrusion deflation, sug-gesting that the central reservoir consists of several storage levels34. Low-magnitude seismicity during this phase
is shallow (<6 km depth) and located within the caldera, possibly related to continued caldera faulting visible in post-eruptive interferograms (Supplementary Figs. S12, S13).
Although no additional large-scale deformation is observed along the east rift zone after 22 December, a localized <12 cm discontinuity is measured across the fractures mapped along the SE coast (Fig. 4c), suggesting a continuation of the distal submarine eruption, driving the progressive drainage of the central magma reservoir, similar to the 2014 Bárarbunga or the 2018 Kilauea eruptions35,36. Field surveys confirm that the submarine
eruption may have continued past the 27 December, as more pumice was observed on 3 February 2019 than on 27 December 2018. At the time of writing (August 2019), there has been no satellite detection of sulphur dioxide above background levels since late January 2019, contrasting starkly with the intense persistent degassing meas-ured over the past decade24.
Discussion
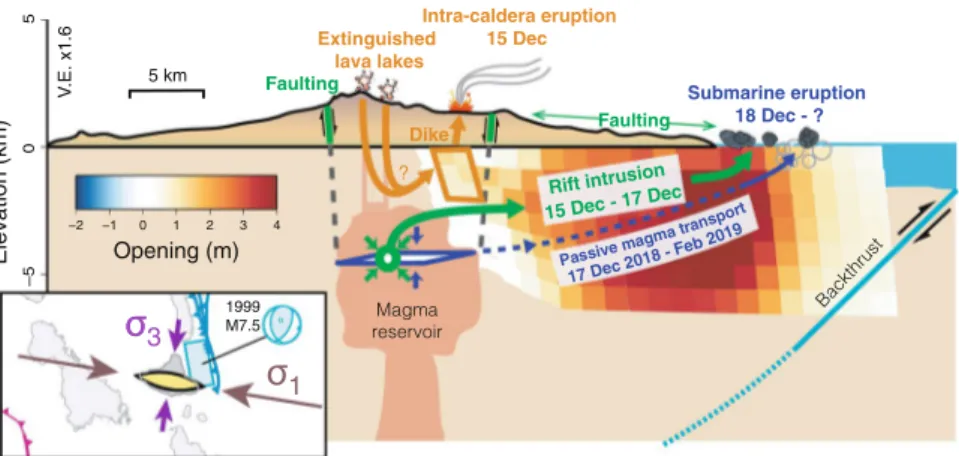
The December 2018 Ambrym diking event sheds light on the stress state that prevails at the scale of Ambrym island, while providing insight into the magma storage conditions beneath Ambrym’s caldera (Fig. 5). Joint anal-ysis of remote sensing and seismicity demonstrates that the condition initiating the rift intrusion in December 2018 was the creation of an open fracture at Lewolembwi, connecting the caldera’s localized magma supply to the rift zone. Once such a connection is made, a blade-like fluid-filled crack (dike) is able to travel tens of kilometers
Extinguished lava lakes 5 km Intra-caldera eruption 15 Dec 5 –5 0 Submarine eruption 18 Dec - ? Rift intrusion 15 Dec - 17 Dec ) mk ( noi ta vel E Faulting Faulting V.E. x1.6 Magma reservoir −2 −1 0 1 2 3 4 Opening (m)
σ
1σ
3σ
1999 M7.5 Backthrust ? Passive ma gma trans port 17 Dec 2018 - Fe b 2019 DikeFigure 5. Conceptual model of the December 2018 event. Magma injection into the rift zone occurred in two
stages. First, on 14 December, a small-volume dike was emplaced in the eastern part of the caldera. The dike breached the surface and fed an eruption lasting ~24 hours. Deflation of Ambrym’s magma plumbing system as a result of the intra-caldera eruption induced a drop of pressure in the magma column, leading to lava lake drainage. On 15–16–17 December, a large-volume dike injection took place along the east rift zone, likely fed through the conduit opened by the previous intra-caldera dike. During its propagation and inflation, the voluminous dike intrusion induced intense faulting and fissuring above its upper edge, especially at the coastal village of Pamal, suggesting a shallow depth of emplacement. However, the dike did not produce any onshore eruption nor any substantial degassing. From 18 December, pumice washed up on the eastern shore of Ambrym indicating a submarine eruption. Continued subsidence of Ambrym caldera during the weeks following this eruption, as well as continuation of localized faulting at Pamal (Fig. 3c), suggest a prolongation of the submarine eruption without substantial additional inflation of the main dike, compatible with passive magma transport from Ambrym’s central reservoir toward the submarine eruption site. The inset is a zoom on Ambrym’s tectonic setting, emphasizing that Ambrym’s rift zone orientation is sub-parallel to the regional maximum compressive stress, allowing us to interpret Ambrym as a large tension fracture. The activated plane and focal mechanism of the 1999 thrust earthquake are noted on the sketch in light blue.
away from its source, neither erupting at the surface, nor degassing significantly to the atmosphere. To sustain lateral magma propagation, pressure in the dike (Pm) must be greater than the host rock’s minimum principal
stress normal to the dike plane (σ3, positive), a difference defined as the driving stress (Pd) (Pd = Pm − σ3)37–39. Furthermore, to travel horizontally for long distances, there must be a strong horizontal gradient of driving stress in the direction of magma propagation40. Magmatic systems in an extensionally-loaded host rock (low σ
3) do not necessarily require high magma overpressures to drive large diking events (high Pd)41. When comparing diking
events at Icelandic and Hawaiian volcanoes, dike widths tend to be thicker in Iceland (higher Pd in Iceland), but
dikes reach the surface more often in Hawaii (higher Pm in Hawaii). The >3 m dike thickness at Ambrym brings
us to the conclusion that Pd is high without having a large Pm41. A similar conclusion was drawn after the dike
intrusions and lava lake drainage of the 2002 Nyiragongo flank eruption42,43. In spite of enhanced thermal activity
and increased lava lake vigor (Supplementary Figs. S16, S17), an absence of uplift in the months to years prior to the 2018 Ambrym crisis is evidenced (Supplementary Fig. S9), consistent with this inferred lack of overpressure44.
The fact that the central magma reservoir was able to store a large volume of magma (0.4 km3) and sustain dike propagation over large distances without prior overpressurization is consistent with vigorous supply of a relatively volatile-poor magma23.
The thick 2018 dike–similar in width to dikes at plate boundaries in Iceland or Afar45–and energetic
earth-quake migration indicate that lithospheric stresses primed for magma injection drove lateral magma propagation. Assuming a minimum volume of intruded magma in the 2018 eruption (400 × 106 m3), we calculate a minimum expansion rate along Ambrym’s rift of ~2 cm/yr (assumptions: last event = 81 years ago; SE rift length = 25 km; height = 10 km). Gravitationally-induced extension can be plausibly discarded as a mechanism generating these stresses, due to the lack of curvature of Ambrym’s rift zone46 and to the fact that the 2018 rift zone intrusion led
to uplift of the entire south-eastern part of the island, hence working against gravity. On the other hand, tec-tonic stresses induced by the proximity of regional faults involved in the convergence between the Pacific and Australian plates may provide the stress conditions driving rift development at Ambrym. Ambrym is facing the collision-subduction of the D’Entrecasteaux Ridge (DER) and, farther to the north, of the West Torres Massif (WTM) (Fig. 1a). The DER and WTM perturb the Vanuatu arc, resulting in the late Quaternary uplift of the western Santo-Malekula islands47,48 and the growth of a back-arc thrust belt (BATB), uplifting the eastern islands
of Pentecost-Maewo (Fig. 1a)49–51. Ambrym’s east coast is located at the southern tip of the BATB, which was last
activated in the thrusting 1999 Mw 7.5 earthquake52,53. We note that the focal mechanisms during the 2018
dik-ing event have P-axis orientations consistent with this regional compression (Fig. 2b). This triggered seismicity does not appear consistent with stress change caused by the dike inflation (increased compressive stress oriented perpendicular to the dike, i.e. N20°) but rather reflects the regional stress state (σ3 oriented N110°), revealing the dominant overprint of this background compressive stress54. In this context, Ambrym may be envisioned
as a giant tension fracture oriented sub-parallel to the local maximum compression axis σ1 (inset of Fig. 5). The importance of the regional stress field’s maximum compression axis was also emphasised after the 2000 lateral dike intrusion at Miyakejima, likewise situated in a convergent margin setting55.
The 2018 diking event illustrates how tectonically-induced stresses drive magma transport into Ambrym’s well-defined rift zone, efficiently siphoning magma away from the caldera in a relatively silent manner for an observer at the surface. Similar to past events in hot-spot basaltic volcanoes of the Galapagos, especially in 1968 at Fernandina56,57, caldera subsidence was associated with non-explosive activity, thereby leaving little geological
trace at the surface. Rather, the elevated rate of Ambrym’s volcanic activity witnessed in the past decades contrasts with the near-complete muting of degassing and thermal activities at the surface during and since the December 2018 extra-caldera dike intrusion (Supplementary Fig. S17). Modulation of volcanic activity at Ambrym’s lava lakes over historical times18 may therefore be reinterpreted as resulting from recurrent pumping of magma into
the rift zone, leading to episodic subsidence of the caldera floor. Open-vent degassing in the years prior to the 2018 eruption may have allowed for an increasing availability of non-overpressurized magma, with lava lakes acting as piezometers of a magma plumbing system that is well-connected to the surface. This offers a glimpse into a system where magma ascent, lateral magma transport, and caldera formation are controlled by regional compressive tectonics.
Methods
Himawari processing.
Himawari-8 is a meteorological satellite operated by the Japan Meteorological Agency, providing multispectral observations from a geostationary orbit at 140.7°E. The Advanced Himawari Imager (AHI) covers 16 channels spanning visible to thermal infrared, and acquires images every 20 minutes. Images have a resolution of ~2.3 km at the location of Ambrym.Following58, a raw thermal index is calculated by computing the normalized difference between
top-of-atmosphere brightness temperatures from infrared channels centered on 10.41 microns and 3.9 microns:
= − + . µ µ µ µ . . . . TI BT BT BT BT (1) raw m m m m 3 9 10 4 3 9 10 4
In order to mitigate the impact of clouds and diurnal variations in brightness temperature, a background thermal index is estimated by extracting the raw thermal index for a reference pixel situated at the border of the caldera, that is not affected by the thermal anomaly of lava and ash emissions while sharing similar ground properties as the intra-caldera pixels. This background thermal index is subtracted from the raw thermal index, yielding a corrected thermal index.
The thermal index time series of Fig. 2c is then estimated by calculating the thermal index averaged in two regions corresponding to the lava lakes and lava flows. Supplementary Fig. S1 shows the same time series of Fig. 2c on a longer time window.
The SO2 flux proxy is estimated in two steps. First, following59, a SO2 column amount proxy is calculated for each pixel by differencing top-of-atmosphere brightness temperatures from infrared channels centered on 10.41 microns and 8.5 microns:
∝ .µ − .µ
CASO2 BT10 4m BT8 5 m (2)
Then, the time series of SO2 flux proxy QSO2 in Fig. 2c is calculated by summing, for each acquisition, the value
of CASO2 for all pixels with a CASO2 greater than 4 K within a ~50 × 35 km box centered on Ambrym (dashed
pol-ygon in Supplementary Fig. S2b). The threshold is intended to distinguish the signal associated with the presence of volcanic SO2 from background oscillations. Supplementary Fig. S2a shows the SO2 flux proxy of Fig. 3c on a longer time window, plotted both on a linear scale and a logarithmic scale.
InSAR processing.
The SAR images used in this study are listed in Supplementary Table S1. Processing of SAR data from the SLC level to wrapped, unfiltered interferograms is performed using the Interferometric SAR scientific computing environment (ISCE)60 for ALOS-2 StripMap (SM3) and Cosmo-SkyMed (CSK) StripMapdata and Generic Mapping Tool’s software GMTSAR61 for ALOS-2 wideswath (WD1) data, with additional
post-processing using the NSBAS62. Topographic fringes are removed using DLR’s TanDEM-X 12 meter Global
(TDX) DEM (an average of DEMs acquired between 14 January 2011 and 22 November 2014)63. Interferograms
are filtered with a weighted power spectrum filter64, followed by a cascading high-pass filter, especially useful in
the areas with a high-gradient fringe rate and on the vegetated flanks65. An iterative, coherence-based unwrapping
method is then used65, which we will call MPD, and is a module in NSBAS (see Supplementary Methods). The
final unwrapped interferograms are then geocoded.
CSK interferograms have low coherence across the island, due to vegetation, atmospheric effects, and a high rate of deformation. Therefore, CSK descending pixel offsets, which complement the ascending ALOS-2 meas-urements, were exploited to measure deformation during the rift zone intrusion and the post-intrusion caldera subsidence. After unwrapping and geocoding, swaths F1 and F2 are merged for ALOS-2 WD1 interferograms. We also merge along-track frames for ALOS-2 SM3 interferograms, to ensure that the far-field signal (Pentecost island to the north and Lopevi, Paama, and Namuka islands to the south) is included in the inversion.
Geodetic modeling.
Inversion procedure. We then perform the same inversion procedure for each of thethree datasets, respectively corresponding to the (a) intra-caldera dike, (b) rift zone intrusion and caldera sub-sidence, and (c) post-intrusion caldera subsidence (Fig. 4). To focus on the first-order geometry of the pressure sources, we mask localized, near-field signals that may bias the model misfits (i.e. masking localized deformation within 2 km of the dike trace, deformation close to the craters that may be due to conduit pressurization, or sub-sidence due to lava flow cooling and compaction).
After downsampling the data using a distance-based averaging, we then run a non-linear inversion to find the first order geometry of the pressure sources66 (See Supplementary Table S2). The forward model includes
dislo-cations67 and Mogi sources68. We find that the intra-caldera phase (a) is best explained by a single inflating dike,
whereas the rift zone intrusion and caldera subsidence in phase (b) require an inflating dike and a deflating Mogi. We find that post-intrusion caldera subsidence in phase (c) cannot be explained by the same deflating Mogi as in phase (b), whereas a laterally extensive sill-like deflating source better reproduces the deformation measured in post-eruptive interferograms.
Following this non-linear inversion, the geometry of the pressurized sources is held fixed, and we then per-formed a constrained least squares inversion to investigate separately the distributed opening of the intra-caldera dike, extra-caldera rift intrusion (modeling the residual deformation field after removing the synthetic deforma-tion from the deflating Mogi), and the closing of the post-intrusion sill45,69 (see Supplementary Methods).
During the rift zone intrusion, there was significant deformation offshore, limiting the model’s resolution. Therefore, we perturb the geometry of the dike used to model the rift zone intrusion by extending the depth, as well as the length offshore, by several kilometers. We derive four end-member models to determine a reasonable range of volumes, taking into account uncertainties imposed by the lack of model resolution (Supplementary Fig. S6). Final volumes range from 419 to 532 × 106 m3, with an “average” model chosen with a reasonable misfit, which extends 6 km offshore and 6 km along depth.
Once the distributed opening along the rift-zone dike is determined, we perform a final iteration to ensure that the initial removal of the Mogi model’s synthetic deformation does not propagate significant model errors into the distributed opening inversion. We subtract the synthetic deformation field derived from the “average” model from the original datasets, and rerun the nonlinear inversion to solve for the Mogi depth and volume change. The volume and depth do not change significantly (<6% and <3%, respectively).
Temporal evolution of post-intrusion subsidence. In addition to an ALOS-2 interferogram and CSK pixel offsets
measuring deformation after the rift zone intrusion (Fig. 4c), ascending Track 81 Sentinel-1 images were also acquired every 6 days, starting from 19 December 2018. The magnitude of deformation measured in the 6-day pairs decreases with time, allowing us to investigate the temporal evolution of the subsidence. The full extent of the deformation signal is not captured in some of the interferograms because coherence is limited to within the unvegetated part of the caldera. Conversely, ALOS-2 interferograms exhibit a better coherence, which allows for
mapping the deformation outside the caldera. However, the temporal resolution of ALOS-2 data is insufficient to capture the temporal evolution of this transient post-intrusion subsidence signal.
In order to combine the high temporal resolution of Sentinel-1 and the high coherence of ALOS-2, we design a specific strategy by (a) first estimating the parameters (shape, depth) of the deflating source from the deforma-tion pattern visible in ALOS-2 data and (b) solving for the temporal evoludeforma-tion of the defladeforma-tion source by fitting the deformation signal projected in the line of sight (LOS) against the deformation measured in Sentinel-1 data.
To exploit the high coherence of the ALOS-2 interferogram, we use the same inversion procedure as men-tioned above to invert for closing on a horizontal sill, fixed to a depth of 4.1 km, with patches 1 km × 1 km (Supplementary Fig. S4). The depth was derived from an initial non-linear inversion of a closing Okada plane. We then project the synthetic deformation field into the ascending Sentinel-1 LOS, and scale the model to fit the 15 interferograms spanning 19 December 2018 to 18 January 2019. The scaling is determined such that:
γ = u
u , (3)
k k
model
where k is the interferogram index, uk and umodel are the average velocities of the data and model, respectively (i.e. the displacement divided by the time span). Here, γk is the scalar for interferogram k representing the rate of
deformation in the time interval spanned by the interferogram. See Supplementary Methods for more details. We then multiply each scalar by the total magma volume loss in the initial inversion (−85 × 106 m3), and perform a least squares inversion to find volume loss for each acquisition (Fig. 4c)70. An exponential is fit to the
volume loss vs. time,
= ⋅ − − F t A t B C ( ) exp , (4) such that A = 0.144 m3, B = 9.55 days, C = 0.1 m3, and t is the time is days since 16 December 2018, which corre-sponds with the inferred time of onset of caldera subsidence based on seismicity. The half-life of the exponential decay is thus ~6.6 days.
Removing post-intrusion subsidence. The datasets spanning the rift zone intrusion and main caldera subsidence
also span the beginning of the post-intrusion subsidence. We scale the post-intrusion synthetic deformation field, using the exponential described above, to remove post-intrusion deformation from the co-intrusion ALOS-2 and CSK data. However, after rerunning the non-linear inversion on these corrected interferograms, the RMS was not improved–24.03 (without removal) vs. 24.74 (with removal). This may be because the source geometry does not remain constant throughout the entire post-intrusion subsidence phase (especially in the days immediately after the intrusive event, 18–22 December, which are not covered by the initial post-intrusion ALOS-2/CSK inversion). We therefore decide to proceed without removing the post-intrusion deformation.
Received: 28 June 2019; Accepted: 17 October 2019; Published: xx xx xxxx
References
1. Druitt, T. H. & Sparks, R. S. J. On the formation of calderas during ignimbrite eruptions. Nature 310, 679–681, https://doi. org/10.1038/310679a0 (1984).
2. Walker, G. P. L. Basaltic-volcano systems. Geol. Soc. London, Special Publ. 76, 3–38, https://doi.org/10.1144/GSL.SP.1993.076.01.01 (1993).
3. Gudmundsson, A. Formation and development of normal-fault calderas and the initiation of large explosive eruptions. Bull. Volcanol. 60, 160–170 (1998).
4. Acocella, V. Understanding caldera structure and development: An overview of analogue models compared to natural calderas. Earth-Science Rev. 85, 125–160 (2007).
5. Michon, L., Massin, F., Famin, V., Ferrazzini, V. & Roult, G. Basaltic calderas: Collapse dynamics, edifice deformation, and variations of magma withdrawal. J. Geophys. Res. Solid Earth 116, 1–18, https://doi.org/10.1029/2010JB007636 (2011).
6. Simkin, T. & Howard, K. A. Caldera collapse in the Galápagos Islands, 1968. Science 169, 429–437, https://doi.org/10.1126/ science.169.3944.429 (1970).
7. Geshi, N., Shimano, T., Chiba, T. & Nakada, S. Caldera collapse during the 2000 eruption of Miyakejima Volcano, Japan. Bull. Volcanol. 64, 55–68, https://doi.org/10.1007/s00445-001-0184-z (2002).
8. Pike, R. J. Volcanoes on the inner planets: Some preliminary comparisons of gross topography. Proc. Lunar Planet Sci. Conf. 9, 3239–3273 (1978).
9. Wood, C. A. Calderas: a planetary perspective. J. Geophys. Res. 89, 8391–8406, https://doi.org/10.1029/JB089iB10p08391 (1984). 10. Robin, C., Eissen, J. P. & Monzier, M. Giant tuff cone and 12-km-wide associated caldera at Ambrym Volcano (Vanuatu, New
Hebrides Arc). J. Volcanol. Geotherm. Res. 55, 225–238, https://doi.org/10.1016/0377-0273(93)90039-T (1993).
11. Mccall, G. J. H., Lemaitre, R. W., Malahoff, A., Robinson, G. P. & Stephenson, P. J. The Geology and Geophysics of the Ambrym Caldera, New Hebrides. In Symposium Volcanoes and their Roots, 681–696 (Oxford, England, 1969).
12. Németh, K. & Cronin, S. J. Volcanic craters, pit craters and high-level magma-feeding systems of a mafic island-arc volcano: Ambrym, Vanuatu, South Pacific. Geol. Soc. London, Special Publ. 302, 87–102, https://doi.org/10.1144/SP302.6 (2008).
13. Németh, K., Cronin, S. J., Stewart, R. B. & Charley, D. Intra- and extra-caldera volcaniclastic facies and geomorphic characteristics of a frequently active mafic island-arc volcano, Ambrym Island, Vanuatu. Sedimentary Geol. 220, 174–188, https://doi.org/10.1016/j. sedgeo.2009.04.019 (2009).
14. Cronin, S. J. & Németh, K. Where are the giant tuff cone and ignimbrites of Ambrym? A more conventional story of mafic volcanism at Ambrym Volcano, Vanuatu. In Geological Society of New Zealand 50th Annual Conference, 21–22 (Geological Society of New Zealand, Kaikoura, New Zealand, 2005).
16. MacFarlane, A., Carney, J. N., Crawford, A. J. & Greene, H. Vanuatu - A review of the onshore geology. In H.G., G. & F.L., W. (eds.) Geology and offshore resources of Pacific island arcs - Vanuatu region, Circum-Pacific, no. 8 in Earth Science Series, 45–91 (Circum-Pacific Council for Energy and Mineral Resources, 1988).
17. Picard, C., Monzier, M., Eissen, J.-P. & Robin, C. Concomitant evolution of tectonic environment and magma geochemistry, Ambrym volcano (Vanuatu, New Hebrides arc). Geol. Soc. London, Special Publ. 81, 135–154 (1994).
18. Eissen, J. P., Blot, C. & Louat, R. Chronology of the historic volcanic activity of the New Hebrides island arc from 1595 to 1991. Tech. Rep., ORSTOM, Nouméa (1991).
19. Coppola, D., Laiolo, M. & Cigolini, C. Fifteen years of thermal activity at Vanuatu’s volcanoes (2000–2015) revealed by MIROVA. J. Volcanol. Geotherm. Res. 322, 6–19, https://doi.org/10.1016/j.jvolgeores.2015.11.005 (2016).
20. Gregory, J. The Ambrym eruptions of 1913–1914. Geol. Mag. 1917, 496–503 (1917).
21. Bani, P. et al. Surge in sulphur and halogen degassing from Ambrym volcano, Vanuatu. Bull. Volcanol. 71, 1159–1168, https://doi. org/10.1007/s00445-009-0293-7 (2009).
22. Bani, P. et al. First estimate of volcanic SO2 budget for Vanuatu island arc. J. Volcanol. Geotherm. Res. 211–212, 36–46 (2012). 23. Allard, P. et al. Prodigious emission rates and magma degassing budget of major, trace and radioactive volatile species from Ambrym
basaltic volcano, Vanuatu island Arc. J. Volcanol. Geotherm. Res. 304, 378–402, https://doi.org/10.1016/j.jvolgeores.2015.08.022 (2015). 24. Carn, S. A., Fioletov, V. E., Mclinden, C. A., Li, C. & Krotkov, N. A. A decade of global volcanic SO2 emissions measured from space.
Sci. Reports 7, 1–12, https://doi.org/10.1038/srep44095 (2017).
25. Németh, K. & Cronin, S. J. Drivers of explosivity and elevated hazard in basaltic fissure eruptions: The 1913 eruption of Ambrym Volcano, Vanuatu (SW-Pacific). J. Volcanol. Geotherm. Res. 201, 194–209, https://doi.org/10.1016/j.jvolgeores.2010.12.007 (2011). 26. Firth, C., Handley, H., Turner, S., Cronin, S. & Smith, I. Variable conditions of magma storage and differentiation with links to
eruption style at Ambrym volcano, Vanuatu. J. Petrol. 57, 1049–1072, https://doi.org/10.1093/petrology/egw029 (2016).
27. Hamling, I. J., Cevuard, S. & Garaebiti, E. Large scale drainage of a complex magmatic system: Observations from the 2018 eruption of Ambrym volcano, Vanuatu. Geophys. Res. Lett. (2019).
28. Newton, A. Ocean-transported pumice in the North Atlantic. Ph.D. thesis, University of Edinburgh (2000).
29. Kueppers, U., Nichols, A. R., Zanon, V., Potuzak, M. & Pacheco, J. M. Lava balloons-peculiar products of basaltic submarine eruptions. Bull. Volcanol. 74, 1379–1393, https://doi.org/10.1007/s00445-012-0597-x (2012).
30. Rivalta, E. & Segall, P. Magma compressibility and the missing source for some dike intrusions. Geophys. Res. Lett. 35, 0–4, https:// doi.org/10.1029/2007GL032521 (2008).
31. Institut de Physique du Globe de Paris and Ecole et Observatoire des Sciences de la Terre de Strasbourg (EOST), GEOSCOPE - French Global Network of broadband seismic stations, 10.18715/GEOSCOPE.G (1982).
32. Shuler, A., Ekström, G. & Nettles, M. Physical mechanisms for vertical-CLVD earthquakes at active volcanoes. J. Geophys. Res. Solid Earth 118, 1569–1586, https://doi.org/10.1002/jgrb.50131 (2013).
33. Dvorak, J. J. & Okamura, A. T. A hydraulic model to explain variations in summit tilt rate at Kilauea and Mauna Loa volcanoes. US Geol. Surv. Prof. Pap 1350, 1281–1296 (1987).
34. Baker, S. & Amelung, F. Top-down inflation and deflation at the summit of Kilauea Volcano, Hawai’i observed with InSAR. J. Geophys. Res. 117, 1–14, https://doi.org/10.1029/2011JB009123 (2012).
35. Neal, C. A. et al. The 2018 rift eruption and summit collapse of Kilauea Volcano. Science 7046, 1–14, https://doi.org/10.1126/science. aav7046 (2018).
36. Gudmundsson, M. T. et al. Gradual caldera collapse at Bárdarbunga volcano, Iceland, regulated by lateral magma outflow. Science 353, aaf8988 (2016).
37. Buck, W. R., Einarsson, P. & Brandsdóttir, B. Tectonic stress and magma chamber size as controls on dike propagation: Constraints from the 1975–1984 Krafla rifting episode. J. Geophys. Res. Solid Earth 111, 1–15, https://doi.org/10.1029/2005JB003879 (2006). 38. Pollard, D. D., Delaney, P. T., Duffield, W. A., Endo, E. T. & Okamura, A. T. Surface deformation in volcanic rift zones. Tectonophysics
94, 541–584, https://doi.org/10.1016/B978-0-444-42198-2.50036-5 (1983).
39. Rubin, A. M. & Pollard, D. D. Origin of blade-like dikes in volcanic rift zones. In Decker, R., Wright, T. & Stauffer, P. (eds.) Volcanism in Hawaii Professional Paper, 1449–1470, 1350 edn (U.S. Geol. Surv., 1987).
40. Grandin, R. et al. Thickness control of lateral dyke intrusion at mid-ocean ridges. Earth Planet. Sci. Lett. 319–320, 83–95, https://doi. org/10.1016/j.epsl.2011.12.011 (2012).
41. Rubin, A. M. A comparison of rift-zone tectonics in Iceland and Hawaii. Bull. Volcanol. 52, 302–319 (1990).
42. Komorowski, J.-C. et al. The January 2002 flank eruption of Nyiragongo volcano (DRC): chronology, evidence for a tectonic rift trigger, and impact of lava flows on the city of goma. Acta Vulcanologica 14/15, 27–62 (2004).
43. Wauthier, C., Cayol, V., Kervyn, F. & d’Oreye, N. Magma sources involved in the 2002 Nyiragongo eruption, as inferred from an InSAR analysis. J. Geophys. Res. Solid Earth 117 (2012).
44. Cervelli, P. et al. The 12 September 1999 Upper East Rift Zone dike intrusion at Kilauea Volcano, Hawaii. J. Geophys. Res. Solid Earth 107, 1–13, https://doi.org/10.1029/2001jb000602 (2002).
45. Grandin, R. et al. September 2005 Manda hararo-dabbahu rifting event, Afar (Ethiopia): Constraints provided by geodetic data. J. Geophys. Res. Solid Earth 114, https://doi.org/10.1029/2008JB005843 (2009).
46. Nakamura, K. Volcanoes as possible indicators of tectonic stress orientation - principle and proposal. J. Volcanol. Geotherm. Res. 2, 1–16, https://doi.org/10.1007/BF02199968 (1977).
47. Taylor, F. W., Isacks, B. L., Jouannic, C., Bloom, A. L. & Dubois, J. Coseismic and Quaternary vertical tectonic movements, Santo and Malekula Islands, New Hebrides Island Arc. J. Geophys. Res. 85, 5367–5381, https://doi.org/10.1029/JB085iB10p05367 (1980). 48. Collot, J., Daniel, J. & Burne, R. Recent tectonics associated with the subduction/collision of the d’entrecasteaux zone in the central
new hebrides. Tectonophysics 112, 325–356, https://doi.org/10.1016/0040-1951(85)90185-4 (1985).
49. Louat, R. & Pelletier, B. Seismotectonics and present-day relative plate motions in the Tonga-Lau and Kermadec-Havre region. Tectonophysics 165, 237–250, https://doi.org/10.1016/0040-1951(89)90049-8 (1989).
50. Pelletier, B., Meschede, M., Chabernaud, T., Roperch, P. & Zhao, X. Tectonics of the Central New Hebrides Arc, North Aoba Basin. Proceedings of the Ocean Drilling Program, 134 Scientific Results 134, 431–444, https://doi.org/10.2973/odp.proc.sr.134.023.1994 (1994).
51. Taylor, F. W. et al. Geodetic measurements of convergence at the New Hebrides island arc indicate arc fragmentation caused by an impinging aseismic ridge. Geology 23, 1011–1014, https://doi.org/10.1130/0091-7613 (1995).
52. Lagabrielle, Y., Pelletier, B., Cabioch, G., Regnier, M. & Calmant, S. Coseismic and long-term vertical displacement due to back arc shortening, central Vanuatu: Offshore and onshore data following the Mw 7.5, 26 November 1999 Ambrym earthquake. J. Geophys. Res. 108, 2519, https://doi.org/10.1029/2002JB002083 (2003).
53. Regnier, M., Calmant, S., Pelletier, B., Lagabrielle, Y. & Cabioch, G. The Mw 7.5 1999 Ambrym earthquake, Vanuatu: A back arc intraplate thrust event. Tectonics 22, 1–11, https://doi.org/10.1029/2002TC001422 (2003).
54. Roman, D. C. & Heron, P. Effect of regional tectonic setting on local fault response to episodes of volcanic activity. Geophys. Res. Lett. 34, 1–5, https://doi.org/10.1029/2007GL030222 (2007).
55. Ueda, H. et al. Magma intrusion and discharge process at the initial stage of the 2000 activity of Miyakejima, Central Japan, inferred from tilt and GPS data. Geophys. J. Int. 161, 891–906, https://doi.org/10.1111/j.1365-246X.2005.02602.x (2005).
56. Bagnardi, M. & Amelung, F. Space-geodetic evidence for multiple magma reservoirs and subvolcanic lateral intrusions at Fernandina Volcano, Galápagos Islands. J. Geophys. Res. B: Solid Earth 117, 1–19, https://doi.org/10.1029/2012JB009465 (2012).
57. Munro, D. C. & Rowland, S. K. Caldera morphology in the western Galápagos and implications for volcano eruptive behavior and mechanisms of caldera formation. J. Volcanol. Geotherm. Res. 72, 85–100, https://doi.org/10.1016/0377-0273(95)00076-3 (1996). 58. Wright, R., Flynn, L., Garbeil, H., Harris, A. & Pilger, E. Automated volcanic eruption detection using MODIS. Remote. sensing
environment 82, 135–155 (2002).
59. Prata, A. & Kerkmann, J. Simultaneous retrieval of volcanic ash and SO2 using MSG-SEVIRI measurements. Geophys. Res. Lett. 34 (2007).
60. Rosen, P. A., Gurrola, E., Sacco, G. F. & Zebker, H. The InSAR scientific computing environment. In EUSAR 2012; 9th European Conference on Synthetic Aperture Radar, 730–733 (2012).
61. Sandwell, D., Mellors, R., Tong, X., Wei, M. & Wessel, P. Open radar interferometry software for mapping surface deformation. Eos, Transactions Am. Geophys. Union 92, 234–234 (2011).
62. Doin, M.-P. et al. Presentation of the small baseline NSBAS processing chain on a case example: the Etna deformation monitoring from 2003 to 2010 using Envisat data. In Proceedings of the ESA’Fringe 2011 Workshop’, Frascati, Italy, (19–23 September 2011), 19–23 (2011).
63. Wessel, B. TanDEM-X Ground Segment - DEM Products Specification Document. Tech. Rep. 3.1, EOC, DLR, Oberpfaffenhofen, Germany, https://doi.org/10.1002/hyp.3360050103 (2016).
64. Rosen, P. A., Hensley, S., Peltzer, G. & Simons, M. Updated Repeat Orbit Interferometry Package Released. Eos 85, 47 (2004). 65. Grandin, R. Long-term growth of the Himalaya inferred from interseismic InSAR measurement. Geology 40(12), 1059–1062 (2012). 66. Tarantola, A. & Valette, B. Generalized nonlinear inverse problems solved using the least squares criterione. Rev. Geophys. 20,
219–232 (1982).
67. Okada, Y. Surface Deformation Due to Shear and Tensile Faults in a Half-Space. Bull. Seismol. Soc. Am. 75, 1135–1154, https://doi. org/10.1016/0148-9062(86)90674-1 (1985).
68. Mogi, K. Relations between the eruptions of various volcanoes and the deformations of the ground surfaces around them. Bull. Earthuake Res. Inst. 36, 99–134 (1958).
69. Jolivet, R., Simons, M., Agram, P. S., Duputel, Z. & Shen, Z. K. Aseismic slip and seismogenic coupling along the central San Andreas Fault. Geophysical Research Letters 42(2), 297–306 (2015).
70. Berardino, P., Fornaro, G., Lanari, R. & Sansosti, E. A new algorithm for surface deformation monitoring based on small baseline differential SAR interferograms. IEEE Transactions on Geosci. Remote. Sens. 40, 2375–2383, https://doi.org/10.1109/ TGRS.2002.803792 (2002).
71. Pelletier, B., Calmant, S. & Pillet, R. Current tectonics of the Tonga-New Hebrides region. Earth Planet. Sci. Lett. 164, 263–276, https://doi.org/10.1016/s0012-821x(04)00049-4 (1998).
72. Bergeot, N. et al. Horizontal and vertical interseismic velocity fields in the Vanuatu subduction zone from GPS measurements: Evidence for a central Vanuatu locked zone. J. Geophys. Res. Solid Earth 114 (2009).
Acknowledgements
Photo in Fig. 2e courtesy of John Tasso, Vanuatu Island Experience, http://vanuatuislandexperience.com/ guides/. Nial Peters is thanked for sharing photos taken in the field. We thank Noel Naki and the Department of Lands and Survey of Vanuatu for their help during fieldwork. We thank Valérie Cayol, Virginie Pinel, Delphine Smittarello, Eleonora Rivalta and Matt Pritchard for fruitful discussions. We thank Romain Jolivet for sharing the CSI software, available on github (https://github.com/jolivetr/csi). Several calculations used the S-CAPAD cluster of IPGP. We are grateful to the providers of data for this study. We thank the European Space Agency for rapid tasking of Sentinel-1 satellite in response to the event. Project carried out using CSK
®
Products, ©ASI (Italian Space Agency), delivered under an ASI license to use under project No. 702. We also thank the Japanese Space Agency (JAXA 6th Research Agreement No. 3245) for providing access to radar imagery used in this study.We thank Planet for their cubesat data via Planet’s Education and Research Program. We thank the AERIS/ ICARE Data and Services Center for providing access to the Himawari-8 data used in this study. M.B. and N.H. acknowledge support from the French National Research Agency (ANR) for funding the VOLCPLUME project (ANR-15-CE04-0003-01). Y.M. acknowledges support from the National Geographic grant number CP-122R-17 (Trail by Fire II–Closing the Ring project) and from IRD. We thank the CNES for the funding of geodesy work in Vanuatu through the TOSCA program “GEOV”. We thank Université Nice Sophia Antipolis for funding the bathymetry processing through the CSI program “ARCHI-BATH”. This project has also received funding from the European Union’s Horizon 2020 research and innovation programme under the Marie Skłodowska-Curie grant agreement No 665850. This is IPGP contribution number 4081. We thank both Karoly Nemeth and a second anonymous reviewer for their helpful comments.
Author contributions
T.S. processed the InSAR data, produced the geodetic models and contributed to writing. R.G. supervised the geodetic analysis and coordinated writing of the manuscript. M.B. supervised the thermal and gas data processing and contributed to writing. E.G. supervised the seismic analysis. Y.M. contributed field observations and collected and analyzed petrological data. V.B. processed the GPS data. F.L. processed the bathymetric data. M.V. processed the Geoscope seismic analysis. F.D. contributed to the InSAR data processing. N.H. contributed to the Himawari-8 data processing. D.T. contributed to fieldwork. S.C. and P.L. contributed to seismic analysis. B.P. conducted fieldwork, analyzed coastal uplift and contributed to writing.
competing interests
The authors declare no competing interests.
Additional information
Supplementary information is available for this paper at https://doi.org/10.1038/s41598-019-55141-7.
Correspondence and requests for materials should be addressed to T.S. or R.G. Reprints and permissions information is available at www.nature.com/reprints.
Publisher’s note Springer Nature remains neutral with regard to jurisdictional claims in published maps and
Open Access This article is licensed under a Creative Commons Attribution 4.0 International
License, which permits use, sharing, adaptation, distribution and reproduction in any medium or format, as long as you give appropriate credit to the original author(s) and the source, provide a link to the Cre-ative Commons license, and indicate if changes were made. The images or other third party material in this article are included in the article’s Creative Commons license, unless indicated otherwise in a credit line to the material. If material is not included in the article’s Creative Commons license and your intended use is not per-mitted by statutory regulation or exceeds the perper-mitted use, you will need to obtain permission directly from the copyright holder. To view a copy of this license, visit http://creativecommons.org/licenses/by/4.0/.