HAL Id: hal-02323756
https://hal.archives-ouvertes.fr/hal-02323756
Submitted on 22 Oct 2019
HAL is a multi-disciplinary open access
archive for the deposit and dissemination of sci-entific research documents, whether they are pub-lished or not. The documents may come from teaching and research institutions in France or abroad, or from public or private research centers.
L’archive ouverte pluridisciplinaire HAL, est destinée au dépôt et à la diffusion de documents scientifiques de niveau recherche, publiés ou non, émanant des établissements d’enseignement et de recherche français ou étrangers, des laboratoires publics ou privés.
Comb-Like Fluorophilic-Lipophilic-Hydrophilic Polymers
for Nanocapsules as Ultrasound Contrast Agents
Sophie Houvenagel, Laurence Moine, Guilherme Picheth, Camille Dejean,
Annie Brûlet, Alexis Chennevière, Vincent Faugeras, Nicolas Huang, Olivier
Couture, Nicolas Tsapis
To cite this version:
Sophie Houvenagel, Laurence Moine, Guilherme Picheth, Camille Dejean, Annie Brûlet, et al.. Comb-Like Fluorophilic-Lipophilic-Hydrophilic Polymers for Nanocapsules as Ultrasound Con-trast Agents. Biomacromolecules, American Chemical Society, 2018, 19 (8), pp.3244-3256. �10.1021/acs.biomac.8b00506�. �hal-02323756�
1
Comb-like fluorophilic-lipophilic-hydrophilic
1
polymers for nanocapsules as ultrasound contrast
2
agents
3
Sophie Houvenagela, Laurence Moinea*, Guilherme Pichetha, Camille Dejeanb, Annie Brûletc, 4
Alexis Chennevièrec, Vincent Faugerasd, Nicolas Huanga, Olivier Coutured, Nicolas Tsapisa* 5
a Institut Galien Paris-Sud, CNRS, Univ. Paris-Sud, Université Paris-Saclay, 92296 Châtenay-6
Malabry, France 7
b BioCIS, CNRS, Univ. Paris-Sud, Université Paris-Saclay, 92296 Châtenay-Malabry, France 8
c Laboratoire Léon Brillouin, UMR12 CEA-CNRS, CEA Saclay, Gif sur Yvette, F-91191, 9
France 10
d Institut Langevin, ESPCI Paris, CNRS (UMR 7587), INSERM (U979), Paris, France 11
12
* Corresponding authors at: CNRS, Institut Galien Paris-Sud, CNRS UMR 8612, Faculté de 13
Pharmacie, 92296 Châtenay-Malabry, France. E-mail address: laurence.moine@u-psud.fr 14
(Laurence Moine) and nicolas.tsapis@u-psud.fr (Nicolas Tsapis) 15
16
Keywords
17
Comb-like fluorinated polymers; fluorous interactions; nanocapsules; perfluorocarbons; 18
ultrasound contrast agents 19
2
Abstract
21
Imaging the enhanced permeation and retention effect by ultrasound is hindered by the large 22
size of commercial ultrasound contrast agents (UCAs). To obtain nanosized UCAs, triblock 23
copolymers of poly(ethylene glycol)-polylactide-poly(1H,1H,2H,2H-heptadecafluorodecyl 24
methacrylate) (PEG-PLA-PFMA) with distinct numbers of perfluorinated pendant chains (5, 25
10 or 20) are synthesized by a combination of ring-opening polymerization and atom transfer 26
radical polymerization. Nanocapsules (NCs) containing perfluorooctyl bromide (PFOB) 27
intended as UCAs are obtained with a 2-fold increase in PFOB encapsulation efficiency in 28
fluorinated NCs as compared to plain PEG-PLA NCs thanks to fluorous interactions. NC 29
morphology is strongly influenced by the number of perfluorinated chains and the amount of 30
polymer used for formulation, leading to peculiar capsules with several PFOB cores at high 31
PEG-PLA-PFMA20 amount and single-cored NCs with a thinner shell at low fluorinated 32
polymer amount, as confirmed by small angle neutron scattering. Finally, fluorinated NCs 33
yield higher in vitro ultrasound signal compared to PEG-PLA NCs and no in vitro 34
cytotoxicity is induced by fluorinated polymers and their degradation products. Our results 35
highlight the benefit of adding comb-like fluorinated blocks in PEG-PLA polymers to modify 36
the nanostructure and enhance the echogenicity of nanocapsules intended as UCAs. 37
38 39
3
1. Introduction
40
Ultrasound is one of the most widely used clinical imaging modality owing to its low cost, 41
safety, portability, and possible combination with therapy.1 Nevertheless, this technique has 42
been limited by the lack of effective ultrasound contrast agents (UCAs) to allow tissue 43
differentiation.2,3 Commercially available UCAs consist of 1 – 6 µm gas microbubbles 44
stabilized by a layer of lipids or proteins.4,5 Their large size and high compressibility make 45
them ideal ultrasound reflectors, currently used to enhance the blood pool signal and assess 46
tissue blood flow at the microvascular level.6 However, the fast diffusion of the encapsulated 47
gas results in short circulation time in the bloodstream (a few minutes),7 and their large 48
micrometer size prevents their accumulation in solid tumors. For tumor imaging, more stable 49
nano-sized UCAs able to extravasate into tumors by the enhanced permeation and retention 50
(EPR) effect8 are required. Since gas nanobubbles are difficult to stabilize,9 research has 51
focused on the encapsulation of liquid perfluorocarbons.10 To further improve UCAs stability, 52
several groups have reported the use of polymeric shells which are more stable than lipid or 53
protein layers.11–14 54
In this context, polymeric UCAs have been developed recently in our group. These polymeric 55
nanocapsules (NCs) of poly(lactide-co-glycolide) (PLGA) encapsulating liquid perfluorooctyl 56
bromide (PFOB) showed long-lasting in vitro echogenicity and allowed in vivo blood pool 57
imaging.15 However, quick elimination by the mononuclear phagocyte system hampered their 58
accumulation in the tumor. PLGA was then replaced by poly(lactide-co-glycolide)-59
poly(ethylene glycol) (PLGA-PEG) copolymer to formulate long-circulating NCs which 60
accumulated in the tumor by the EPR effect, and yielded contrast enhancement by 19F 61
Magnetic Resonance Imaging.16 Nevertheless, the acoustic response of these capsules 62
remained too weak at clinical frequencies, owing mainly to the important thickness of their 63
shells. The strategy of decreasing the polymer amount in the formulation, which previously 64
4
allowed reducing the thickness of plain PLGA NCs,17 failed using PLGA-PEG due to local 65
dewetting.18 66
Our aim is therefore to improve the nanocapsule echogenicity by reducing their shell 67
thickness, while keeping their long-circulating properties with PEG chains. Recently, we 68
reported that functionalizing PLA with a short linear perfluorinated end group induced an 69
increase of PFOB encapsulation efficiency into PEGylated NCs made of a mixture of PLA-70
PEG and fluorinated-PLA, for perfluorinated chain length up to C8F17.19 However, the shell 71
thickness was not reduced, and although a higher in vitro echogenicity was obtained due to 72
fluorination, there is still room for improvement since the ultrasound signal was much lower 73
than commercial Sonovue microbubbles. 74
Plenty of reports on different triblock copolymers with hydrophilic, hydrophobic, and 75
fluorinated blocks exist and nanoparticles formed using these polymers exhibit different 76
morphologies.20–24 Here, the strategy consists in synthesizing triblock hydrophilic-77
hydrophobic-fluorophilic copolymers of poly(ethylene glycol)-polylactide-78
poly(1H,1H,2H,2H-heptadecafluorodecyl methacrylate) (PEG-PLA-PFMA), containing a 79
higher proportion of C8F17 chains, to formulate nanocapsules. We intend to favor fluorous 80
interactions between the fluorinated chains and PFOB to improve the wetting of the polymer 81
around the PFOB core and yield capsules with thin shells as we decrease the amount of 82
polymer in the formulation. We present here the polymer synthesis and the characterization of 83
nanocapsules in terms of size distribution, morphology, PFOB encapsulation efficiency, shell 84
thickness as measured by Small Angle Neutron Scattering, cytotoxicity and in vitro 85
ultrasound scattering. 86
5
2. Materials and methods
88
2.1. Materials
89
DL-lactide was purchased from Biovalley, Polysciences Inc. (USA). Poly(ethylene glycol) 90
methyl ether (OH-PEG-OCH3, average Mn = 5 000 g/mol), stannous 2-ethyl hexanoate 91
(stannous octoate, Sn(Oct)2), N,N,N′,N′′,N′′-pentamethyldiethylenetriamine (PMDETA), 92
triethylamine (Et3N), dried toluene, cyclohexanone, magnesium sulfate (MgSO4), sodium 93
cholate, D2O and trifluoroacetic acid (TFA) were provided by Sigma-Aldrich (France). 94
1H,1H,2H,2H-heptadecafluorodecyl methacrylate (FMA) and perfluorooctyl bromide (PFOB) 95
were purchased from Fluorochem (UK). 2-Bromo-2-methylpropionyl bromide and copper(I) 96
bromide (CuBr) were provided by ACROS Organics (Belgium). Deuterated chloroform 97
(CDCl3) was obtained from Euriso-top (France). All solvents were purchased from Carlo Erba 98
(France). Cell culture reagents such as DMEM (Dulbecco’s modified Eagle’s medium), RPMI 99
1640 (Roswell Park Memorial Institute medium), FBS (Fetal Bovine Serum), trypsin-EDTA 100
solution and PBS (Ca2+ and Mg2+ free phosphate buffer) were purchased from Sigma Aldrich 101
(France). Water was purified using a RIOS/Synergy system from Millipore (France). NMR 102
sample tubes and coaxial inserts were obtained from CortecNet (France). 103
2.2. Polymer synthesis
104
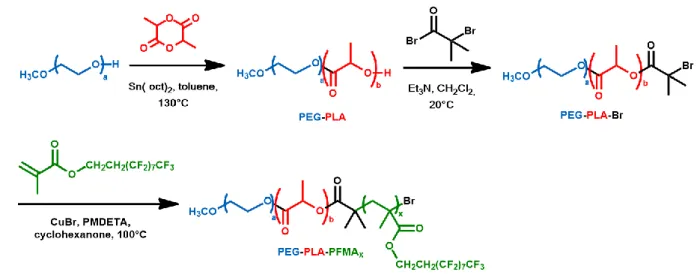
The synthesis route involved 3 steps as shown in Figure 1. 105
2.2.1. Synthesis of PEG-PLA 106
PEG-PLA was synthesized by ring-opening polymerization (ROP) of DL-lactide initiated by 107
OH-PEG-OCH3 in the presence of stannous octoate catalyst.25 All glassware was dried by 108
heating under vacuum and handled under argon atmosphere. To a 250 mL round-bottom flask 109
equipped with a magnetic stir-bar were added DL-lactide (156.14 mmol, 22.50 g) and OH-110
PEG-OCH3 (1.13 mmol, 5.66 g). The flask was sealed with a rubber cap and a stannous 111
6
octoate solution (0.75 mmol, 306 mg) dissolved in 30 mL of dried toluene was added through 112
the septum. The tube was purged with argon for 15 minutes and then placed into a 130°C oil 113
bath. Polymerization was carried out for 1h under magnetic stirring, and then quenched by 114
immersing the tube in a cold water bath. After evaporation of toluene, the reaction product 115
was dissolved in chloroform and precipitated twice into excess cold diethyl ether. The 116
polymer was finally dried under vacuum and 25.13 g of a white powder was obtained. Lactide 117
conversion = 94% (1H NMR). 1H NMR (300 MHz, CDCl3, δ, ppm): 5.10-5.28 (CHCH3COO 118
of PLA), 3.64 (OCH2CH2 of PEG), 3.38 (OCH3 of PEG), 2.70 (end HOCHCH3COO of PLA), 119
1.45-1.67 (CHCH3COO of PLA). MnNMR = 23,500 g/mol; MnSEC = 24,300 g/mol. 120
2.2.2. Synthesis of PEG-PLA-Br macroinitiator 121
PEG-PLA-Br was synthesized by esterification of PEG-PLA with excess 2-Bromo-2-122
methylpropionyl bromide using a known procedure.26,27 In a 250 mL round-bottom flask 123
equipped with a magnetic stir-bar, PEG-PLA (1.06 mmol, 25 g) was dissolved in 160 mL of 124
CH2Cl2. Excess of triethylamine (37.23 mmol, 5.2 mL) was added to the solution, and the 125
mixture was stirred under argon and cooled to 0°C with an ice bath. 2-Bromo-2-126
methylpropionyl bromide (37.23 mmol, 4.6 mL) was added dropwise for 15 min. The mixture 127
was allowed to stir at room temperature overnight, and was subsequently washed twice with 128
saturated brine and once with water. The organic phase was dried over anhydrous MgSO4 129
before being concentrated under reduced pressure and precipitated twice in excess cold 130
diethyl ether. The product was finally dried under vacuum to provide 16.55 g of an off-white 131
solid. 1H NMR (300 MHz, CDCl3, δ, ppm): 5.10-5.28 (CHCH3COO of PLA), 3.64 132
(OCH2CH2 of PEG), 3.38 (OCH3 of PEG), 1.95 and 1.98 (C(Br)(CH3)2), 1.45-1.67 133
(CHCH3COO of PLA). MnNMR = 23,500 g/mol; MnSEC = 25,200 g/mol. 134
7
2.2.3. Synthesis of PEG-PLA-PFMAx polymers 135
PEG-PLA-PFMAx polymers were synthesized by ATRP of 1H,1H,2H,2H-136
heptadecafluorodecyl methacrylate (FMA) initiated by PEG-PLA-Br with CuBr/PMDETA as 137
the catalyst system.28 All glassware was dried by heating under vacuum and handled under 138
argon atmosphere. To a 100 mL round-bottom flask equipped with a magnetic stir-bar were 139
added PEG-PLA-Br (0.21 mmol, 5 g) and a solution of PMDETA (0.21 mmol, 37 mg) and 140
FMA (1.06 mmol for x = 5, 2.13 mmol for x = 10, 4.26 mmol for x = 20) in cyclohexanone 141
(15 mL). After dissolution of the macroinitiator, CuBr (0.21 mmol, 31 mg) was added and the 142
mixture was subjected to two freeze-pump-thaw cycles. The reaction proceeded at 100 °C for 143
42h. The mixture was cooled and diluted with THF, and the copper catalyst was removed with 144
a neutral alumina column. After concentration under reduced pressure, the product was 145
precipitated twice in excess cold diethyl ether and dried under vacuum. FMA conversion (1H 146
NMR) = 84% (x = 20), 80% (x = 10), 67% (x = 5). 1H NMR (300 MHz, CDCl3, δ, ppm): 147
5.10-5.28 (CHCH3COO of PLA), 4.28 (OCH2CH2CF2 of PFMA), 3.64 (OCH2CH2O of PEG), 148
3.38 (end OCH3 of PEG), 2.47 (OCH2CH2CF2 of PFMA), 1.70-2.00 (CH2C(CH3)COO of 149
PFMA), 1.45-1.67 (CHCH3COO of PLA), 0.80-1.45 (CH2C(CH3)COO of PFMA). Molar 150
masses are displayed in Table 1. 151
2.3. Polymer characterization
152
Size exclusion chromatography (SEC) was performed at 30 °C with two columns from 153
Polymer Laboratories (PL-gel MIXED-D; 300 × 7.5 mm) and a differential refractive index 154
detector (Spectrasystem RI-150, Thermo Electron Corp.), using chloroform as an eluent, a 155
Waters 515 pump at a flow rate of 1 mL/min, and toluene as a flow-rate marker. The 156
polymers were dissolved at 5 mg/mL in the eluent and filtered on 0.2 µm PTFE syringe filters 157
prior to injection. The calibration curve was based on poly(methyl methacrylate) (PMMA) 158
standards from Polymer Laboratories. 1H NMR and 19F NMR spectroscopies were performed 159
8
in 5 mm diameter tubes in CDCl3 on a Bruker Avance-400 (400 MHz) spectrometer. The DP 160
and Mn of the commercial OH-PEG-OCH3 were confirmed by 1H NMR in CDCl3 using the 161
ratio of the methyl signal at 3.38 ppm versus the main chain signal at 3.64 ppm: DP = 118, Mn 162
= 5.2x10³ g/mol. Differential scanning calorimetry (DSC) was performed using a DSC Q1000 163
(TA Instruments). The polymers (2-5 mg) were sealed in aluminum pans and heated from -20 164
to 100°C at a heating rate of 20°C/min and cooled to -20 °C before a second heating scan 165
from -20 to 100°C at 20°C/min to determine the glass transition temperature (Tg). A nitrogen 166
flow was maintained throughout the test (20 mL/min). 167
2.4. Interfacial tension measurements
168
Interfacial tension measurements were carried out using the pendant drop method, employing 169
a Tracker tensiometer (Teclis, France). Drops of PFOB were formed using a syringe and a 170
G22 stainless steel needle into a methylene chloride solution containing the polymers at 25 171
mg/mL placed in an optical glass cuvette. The interfacial tension was determined from the 172
drop profile using the Laplace equation and the forces balance between capillarity and 173
gravity. The measurements were performed on at least three independent drops and the 174
experiment was repeated on different days to ensure reproducibility. 175
2.5. Nanocapsules preparation
176
Nanocapsules (NCs) of PFOB were prepared by an emulsion-evaporation process as 177
previously described.16,19 The polymer (50, 30 or 20 mg) was dissolved into 2 mL of 178
methylene chloride along with 30 µL of PFOB. The organic phase was emulsified into 10 mL 179
of 1.5 % sodium cholate (w/v) aqueous solution using a vortex for 1 min and then a vibrating 180
metallic tip (Digital Sonifier, Branson Ultrasons, France) at 30% of maximal power, for 1 min 181
over ice. Solvent was allowed to evaporate by magnetic stirring at 300 rpm at room 182
temperature for 3 h. Suspensions of NCs were filtered through 0.45 µm PVDF filters, and if 183
9
necessary, were purified to remove sodium cholate by ultracentrifugation for 1h, at 4 °C and 184
at 27 440 g (Optima LE-80K Ultracentrifuge Beckman Coulter). The pellet was finally 185
resuspended in water to the desired concentration. 186
2.6. Size distribution and Zeta potential
187
The hydrodynamic diameter (dH) and polydispersity index (PDI) of the nanocapsules were 188
measured by quasi-elastic light scattering, using a Zetasizer Nano ZS instrument (Malvern, 189
France). Suspensions were diluted in water to a concentration of 1 mg/mL. Measurements 190
were performed at 20 °C, at an angle of 173° to avoid multiple scattering. Zeta potential 191
measurements were carried out with the same instrument, at 25 °C, in 1 mM NaCI. 192
Measurements were performed in triplicate. 193
2.7. PFOB encapsulation efficiency by 19F NMR spectroscopy
194
PFOB encapsulation efficiency was determined by 19F NMR on a Bruker Avance-400 (400 195
MHz) spectrometer with a 5 mm dual probe 19F/1H. The NMR quantitative method using stem 196
coaxial inserts was originally proposed by Henderson for 31P compounds29 and adapted 197
previously for 19F NMR.30,19 1 mL of unpurified nanocapsules were freeze-dried for 24h 198
using an Alpha-1-2 LD apparatus (Christ, France) and lyophilisates were dissolved into 1 mL 199
of chloroform. Sodium cholate was removed by centrifugation for 5 min at 4696 g. The 200
organic solution was collected and introduced into a usual 5mm-NMR sample tube loaded 201
with a stem coaxial insert containing TFA in D20 as an external standard ([TFA]= 9.4 202
µmol.mL-1). The total amount of PFOB in the suspension, , was determined after 203
integration of the peak at -64.7 ppm corresponding to the CF2Br group and normalization by 204
the area of the TFA peak at -76.5 ppm. Absolute encapsulation efficiency, , was 205
calculated as follows: 206
10 with 207
where , and are the initial masses of the components introduced during 208
NCs preparation, corresponds to the mass of NCs recovered after freeze-drying and 209
is the molar mass of PFOB (498.96 g/mol). 210
2.8. Transmission electron microscopy (TEM)
211
TEM was performed at I2BC (Gif-sur-Yvette, France) using a JEOL JEM-1400 operating at 212
80 kV. 5 µL of purified suspensions of nanocapsules (0.5 mg/mL) were deposited for 1 min 213
on glow-discharged copper grids covered with formvar-carbon film. Samples were then 214
stained using 2% phosphotungstic acid (pH = 7) for 30 s. The excess solution was blotted off 215
using a filter paper. Images were acquired using an Orius camera (Gatan Inc, USA). 216
2.9. Cryo-transmission electron microscopy (cryoTEM)
217
CryoTEM was performed at I2BC (Gif-sur-Yvette, France) using a JEOL JEM-1400 218
operating at 120 kV. 5 µL of purified suspensions of nanocapsules (25 mg/mL) were 219
deposited on glow-discharged Lacey copper grids covered with carbon film containing holes. 220
The excess solution was blotted off for 5 s using filter paper and the grids were subsequently 221
frozen in liquid ethane using a Leica EM GP automatic system (Leica, Austria) under a 90% 222
humidity atmosphere. Images were recorded on a US1000XP camera (Gatan Inc, USA) with a 223
-2 µm defocus. 224
2.10. Small angle neutrons scattering (SANS)
225
2.10.1. SANS data collection 226
Small Angle Neutron Scattering (SANS) measurements were performed on the PACE 227
spectrometer of the Laboratoire Léon Brillouin (LLB, CEA-Saclay, France). Nanocapsules 228
11
were filtered, purified and resuspended at a final volume fraction of φv = 1% in a 40/60 (v/v) 229
H2O/D2O mixture to match the scattering length density of the PFOB core (PFOB = core = 3.6 230
x 1010 cm-2). This mixture has a weak contrast with PFMA block polymer (PFMA = 3.0 x 10¹⁰ 231
cm-2). So, using contrast matching of the PFOB core, we focused on the polymeric shell of 232
PEG-PLA blocks. Two configurations were used: the first one with a sample-to-detector 233
distance of D = 4.7 m and a neutron wavelength of λ = 13 Å and the second one with D = 2.9 234
m and λ = 4.6 Å to cover a broad q range of 3.2 × 10⁻³ – 1.5 × 10⁻¹ Å−1. SANS measurements 235
were performed in 1 mm thick quartz cuvettes to minimize the incoherent scattering. 236
Scattered intensity curves were corrected from the scattering from the empty quartz cuvette 237
and the electronic background, and normalized by the incoherent signal of 1 mm water sample 238
to account for non-uniform efficiency of detector, using the LLB PASINET software.31 239
2.10.2. SANS data modelling 240
The scattered intensity curves obtained in PFOB matching condition were fitted using the 241
vesicle model with Sasview software.32 This model provides the form factor, P(q), for a 242
unilamellar vesicle of inner radius Rcore and thickness T, according to the following equation: 243
Where scale is a scale factor, V1 is the volume of the core, V2 is the total volume of the 244
vesicle, R1 = Rcore is the radius of the core, R2 is the outer radius of the vesicle (R2 = Rcore + 245
T), and . For the vesicle, 1 = core = solv is the scattering length density 246
of the core and the solvent, 2 = shell is the scattering length density of the shell. The fit gives 247
geometrical parameters of the nanocapsules: the mean core radius Rcore, the polydispersity of 248
the core radius σcore, the thickness of the shell T and the polydispersity of the thickness σT. A 249
lognormal distribution was assumed for both radius and thickness. 250
12
2.11. Hydrolytic degradation of polymers
251
50 mg of each polymer (except PEG-PLA-PFMA20) were suspended into 1 mL of NaOH 1M 252
and vigorously stirred for 24h at 37°C in an incubator. After adjustment of the pH to 7 with 253
HCl 1M, the cloudy solution was dialyzed against deionized water for 96h to remove salt and 254
lactic acid (dialysis membrane molecular weight cut off: 100–500 Da). 255
2.12. Cell culture
256
Human endothelial umbilical vein cells (HUVEC) obtained from ATCC (USA) were cultured 257
in DMEM supplemented with 50 U.mL-1 penicillin, 50 U.mL-1 streptomycin, and 10% heat 258
inactivated FBS. The J774.A1 murine macrophage monocyte cell line (ATCC, USA) was 259
cultured in RPMI 1640 medium supplemented with 50 U.mL-1 penicillin, 50 U.mL-1 260
streptomycin, and 10% heat inactivated FBS. Cells were split twice a week, by trypsinisation 261
for HUVEC and by scraping for J774.A1 cells. All cell lines were maintained at 37 °C and 262
5% CO2 under a humidified atmosphere. 263
2.13. Cytotoxicity evaluation of NCs and polymer degradation products
264
To evaluate their in vitro cytotoxicity, NCs and polymer degradation products were diluted in 265
cell culture medium before being added onto the cells. The cell viability was evaluated using 266
the 3-[4,5-dimethylthiazol-2-yl]-3,5-diphenyltetrazolium bromide (MTT) assay. Briefly, cells 267
were seeded in 100 µL of culture medium (12 x 103 cells/well or 3 x 10³ cells/well for 24 and 268
72h incubation respectively) in 96 well plates (TPP, Switzerland) and pre-incubated for 24 h. 269
100 µL of a serial dilution of NCs (0.01 to 10 mg/mL) or of polymer degradation products 270
(10-5 to 0.01 mg/mL of initial polymer) was then added to the medium. After 24 or 72h of 271
incubation, the incubation medium was replaced by fresh medium containing 0.5 mg/mLof 272
MTT (Sigma, France). After 1h incubation, the culture medium was gently aspirated and 273
replaced by 200 μL dimethylsulfoxide (ACS grade, VWR, France) to dissolve the formazan 274
13
crystals. The absorbance of the solubilized dye, which correlates with the number of living 275
cells, was measured with a microplate reader (LAB Systems Original Multiscan MS, Finland) 276
at 570 nm. The percentage of viable cells in each well was calculated as the absorbance ratio 277
between treated and untreated control cells. 278
2.14. In vitro ultrasound measurements
279
Suspensions of nanocapsules (1 mL, 5 mg/mL) were placed in a 10 mm x 10 mm x 45 mm 280
polystyrene cuvette in which 5-mm diameter holes were cut out and covered by acoustically 281
transparent mylar membrane, as shown in Figure S1. The cuvette was placed in a water bath 282
at 37°C, and a small magnetic bar allowed agitating gently the suspension without disturbing 283
the signal. Measurements were performed after 4 minutes to allow temperature equilibration 284
and removal of potential bubbles. A Handyscope HS5 (TiePie engineering, Netherlands) was 285
used as both an arbitrary wave generator and a USB oscilloscope connected to a computer 286
using Matlab (Mathworks, USA). Samples were insonified by a transducer (focal length 51 287
mm, model I3-0506-R-SU-F2.00IN, Olympus, France), which emitted 10 bursts of 500 cycles 288
at 5 MHz. The scattered ultrasound signal was received by a second transducer (focal length 289
51 mm, model I3-1506-R-SU-F2.00IN, Olympus, France) placed at a 90° angle compared to 290
the transducer-transmitter (Figure S1). This scattered signal was preamplified before being 291
measured by the oscilloscope connected to Matlab for signal processing. The signal was then 292
windowed, Fourier-transformed and the scattered intensity within the bandwidth of each 293
harmonics was summed. The resulting ultrasound scattered intensities were subtracted from 294
the intensity obtained with the cuvette filled with Milli-Q water. At least 9 measurements 295
were performed with each sample. Commercial SonoVue® microbubbles (diluted to 1/1000) 296
were used as a reference positive control for the ultrasound set-up and parameters chosen for 297
our study. 298
14
3. Results and discussion
299
3.1. Polymers synthesis and characterization
300
Triblock copolymers carrying perfluoroalkyl pendant chains were synthesized by a 301
combination of ROP and ATRP as shown in Figure 1. 302
303
Figure 1. Synthesis of PEG-PLA-PFMAx triblock copolymers. 304
ROP of D,L-lactide with polyethylene glycol methyl ether (Mn = 5,000 g/mol) as initiator and 305
Sn(oct)2 as catalyst first led to PEG-PLA diblock copolymer with molar mass close to the 306
targeted Mn of 25,000 g/mol (MnNMR = 23,500 g/mol, MnSEC = 25,500 g/mol). PEG-PLA was 307
subsequently converted to PEG-PLA-Br macroinitiator through esterification with excess 2-308
bromo-2-methylpropionyl bromide in the presence of triethylamine. Quantitative conversion 309
was confirmed by 1H NMR with disappearance of the end hydroxyl broad signal of PLA at 310
2.70 ppm and appearance of signals at 1.95 and 1.98 ppm corresponding to the methyl protons 311
from 2-bromo-2-methylpropionyl end group (supplementary material Figure S2). 312
The final PEG-PLA-PFMAx copolymers were prepared by ATRP of FMA in cyclohexanone 313
with PEG-PLA-Br as macroinitiator and CuBr/PMDETA complex as catalyst. The nature and 314
amount of solvent were initially varied to achieve final polymerization with satisfactory 315
conversion (>65%). Three different monomer/initiator feed molar ratios (x = 5, 10, 20) were 316
15
used to design polymers with various fluorinated block lengths. Successful polymerization 317
was confirmed by 1H NMR with appearance of the signals at 2.47 and 4.28 ppm 318
corresponding respectively to CH2CF2 and CH2CH2CF2 protons of the PFMA block (signals h 319
and g, Figure 2), in addition to those of the methacrylate backbone 1.70 – 2.00 and 0.80 – 320
1.45 (signals e and f, Figure 2). The 4.28 ppm peak area was used to calculate the copolymer 321
molar composition and molar mass by normalization with the 3.64 ppm peak corresponding to 322
the OCH2CH2 of PEG (Table 1). 323
324
Figure 2. 1H NMR spectra of PEG-PLA and triblock copolymers PEG-PLA-PFMAx in 325
CDCl3 (normalized with the PEG peak at 3.64 ppm). 326
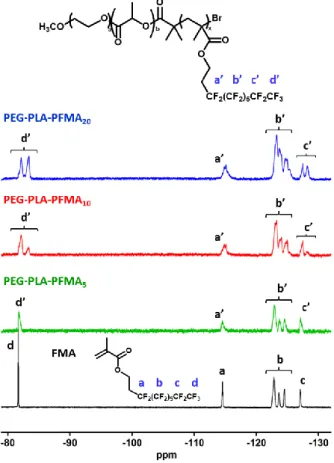
19F NMR spectra of all polymers further support the successful polymerization of FMA 327
(Figure 3). A broadening of the fluorine resonances is observed in PEG-PLA-PFMA5 328
spectrum as compared to the monomer. This effect is more pronounced as the number of 329
16
perfluoroalkyl pendants increases, and leads to the overlapping of resonances of CF2 groups 330
b’ in PEG-PLA-PFMA10 and PEG-PLA-PFMA20 spectra, in agreement with previous 331
reports.33,34 Moreover, a splitting of the peaks c’ and d’, corresponding to the CF2 and CF3 332
groups at the extremity of the fluorinated pendants, is observed. This suggests the existence of 333
unaveraged conformations and therefore indicates some degree of self-association in 334
chloroform. 335
336
Figure 3. 19F NMR spectra of FMA (black line) and triblock copolymers PEG-PLA-PFMAx 337
in CDCl3. 338
The molar masses were also determined by conventional SEC in chloroform (Table 1). All 339
polymers present a single peak (supplementary material Figure S3), confirming the successful 340
formation of copolymers rather than homopolymer blends. Although MnSEC values are close to 341
MnNMR values, MnSEC does not increase with the polymerization degree of the PFMA block, as 342
shown by the superposition of chromatograms and the values in the 24,000 – 26,500 g/mol 343
17
range. Because of fluorophilicity of the perfluorinated chains, full swelling of the triblock 344
polymers in chloroform is limited by a probable folding or formation of micellar domains. 345
Indeed, the triblock polymers appeared more difficult and longer to solubilize than non-346
fluorinated PEG-PLA in common organic solvents such as chloroform, methylene chloride 347
and acetone. To confirm this different behavior, DLS analysis of fluorinated polymers at 25 348
mg/mL in methylene chloride and chloroform was performed. It revealed an important 349
increase of scattered intensity compared to plain PEG-PLA (around 15000 kcps for the 350
triblocks compared to 200 kcps for PEG-PLA, see supplementary material Figure S4). This 351
indicates presence of aggregates such as micelles which confirms that the fluorinated block 352
strongly impacts the solubility and conformation of the polymers chains. 353
18
Table 1. Degree of polymerization (DP), number-average molar mass (Mn), dispersity (Ɖ) and 355
glass transition temperature (Tg) of PEG-PLA-PFMAx polymers and their precursors. 356 Polymer Mntheoretical (x 103 g/mol) PLA:PFMADP 1 Mn NMR (x 103 g/mol) Mn SEC (x 103 g/mol) Ɖ Tg (°C) PEG-PLA 25.0 257 23.5 24.3 1.29 13 ± 1 PEG-PLA-Br 25.0 260 23.7 25.2 1.28 ND PEG-PLA-PFMA5 27.7 272:4 26.7 25.0 1.38 16 ± 1 PEG-PLA-PFMA10 30.3 291:7 29.7 24.9 1.39 20 ± 2 PEG-PLA-PFMA20 35.6 277:15 32.9 26.2 1.29 18 ± 1 1
The DP and MnNMR were determined from the areas of the peak at 3.64 ppm (OCH2CH2 of 357
PEG) versus 5.19 ppm (CH of PLA) for PLA, and versus 4.28 ppm (CH2CH2CF2 of PFMA) 358
for PFMA. 359
DSC thermograms of all polymers exhibited a single glass transition temperature (Tg) in the 360
16-20°C range for triblock copolymers, slightly higher than plain PEG-PLA (Tg = 13°C) 361
(Table 1). The Tg of the PEG block is too low to be detected, and the Tg of both PLA and 362
PFMA blocks are probably very close to each other to be detected separately. Indeed, Li et al. 363
reported the synthesis of PEG-PFMA block copolymers and found a Tg of -24.3 or -41.7 °C 364
for the PEG block, and 19.5 °C for the PFMA block,28 in agreement with our observations. 365
Moreover, the glass transition of PEG-PLA-PFMA20 appears less sharp than the others 366
(supplementary material Figure S5), suggesting a stronger entanglement of polymer chains 367
induced by a higher proportion of perfluoroalkyl units. This is consistent with the study of Li 368
et al. where the glass transition of PFMA was observed only with the shorter PFMA block (28 369
fluorinated units) and not with increasing number of fluorinated units (36 and 38).28 370
A series of triblock copolymers containing a fluorinated block with a comb-like structure was 371
therefore successfully synthesized using a combination of ROP and ATRP. This will allow 372
studying the influence of the number of perfluoroalkyl pendant chains on polymers interfacial 373
properties and on nanocapsules characteristics. 374
19
3.2. Polymers interfacial properties
375
The importance of polymer interfacial behavior during the formulation process of 376
perfluorocarbon micro- and nanocapsules was highlighted in previous reports.18,35,36 In 377
particular, reducing the amount of PEG-PLGA in the formulation of PFOB nanocapsules led 378
to local dewetting and expulsion of some PFOB droplets stabilized by sodium cholate.18 The 379
interfacial tension at the PFOB/organic phase interface was therefore measured with each 380
triblock polymer (Figure 4). A reduction from 2.0 to 0.9-1.0 mN/m is observed upon addition 381
of each PEG-PLA-PFMAx polymer at 25 mg/mL in methylene chloride, regardless of the 382
number of fluorinated units, whereas no decrease is induced by addition of plain PEG-PLA ( 383
= 2.0 ± 0.3 mN/m). The profile as a function of time after the drop formation is also different 384
between fluorinated polymers and the non-fluorinated one, showing a decrease of interfacial 385
tension during the first few seconds with fluorinated polymers only (Figure 4). These results 386
confirm that perfluoroalkyl pendant chains interact with PFOB and adsorb at the interface. 387
Such finding is consistent with the reported fluorophilic character of perfluorinated chains, 388
which usually form fluorous domains.37–39 In a previous study, no reduction of interfacial 389
tension could be observed with PLAs terminated by a linear fluorinated chain of length 390
ranging from C3F7 to C13F27.19 Adsorption of PEG-PLA-PFMAx polymers could potentially 391
be favored by their higher fluorine content as compared to PLA-CxF2x+1 polymers. However, 392
the difference between PLA-C13F27 and PEG-PLA-PFMA5 is not so important as compared to 393
differences between all triblock polymers when taking into account the real degrees of 394
polymerization: 25 mg of polymer contains ~45 µmol of fluorine for PLA-C13F27 and ~64 395
µmol for PEG-PLA-PFMA5. This quantity then reaches ~100 µmol for PEG-PLA-PFMA10 396
and ~194 µmol PEG-PLA-PFMA20. Adsorption of triblock polymers is therefore probably 397
favored by their comb-like architecture. In linear fluorinated PLAs, the fluorinated chain 398
might be hidden by the PLA chain, whereas with the methacrylate backbone, the fluorinated 399
20
part is more rigid and more voluminous, making it more exposed and able to adsorb at the 400
PFOB-solvent interface. 401
402
Polymer Interfacial tension (mN/m)
No polymer 2.0 ± 0.3 PEG-PLA 2.0 ± 0.3 PEG-PLA-PFMA5 0.9 ± 0.1
PEG-PLA-PFMA10 0.9 ± 0.1
PEG-PLA-PFMA20 1.0 ± 0.1
Figure 4. Interfacial tension measurements at the interface between PFOB and methylene
403
chloride solutions of each polymer at 25 mg/mL with the pendant drop method: typical 404
profiles as a function of time after the drop formation (top) and interfacial tension values at 405
200 s presented as mean ± SD (n > 6) (bottom). 406
3.3. PFOB nanocapsules: physical characterization
407
PFOB nanocapsules (NCs) were formulated using an emulsion evaporation process.16,17 Since 408
the objective was to reduce shell thickness, the initial amount of polymer in the organic phase 409
was decreased (50, 30 and 20 mg), while keeping the amount of PFOB constant. 410
Size distribution and zeta potential 411
For a fixed polymer quantity, NCs mean hydrodynamic diameters are slightly larger with all 412
PEG-PLA-PFMAx (117 – 147 nm) compared to PEG-PLA (113 – 131 nm) (Table 2). As 413
observed with interfacial tension results, the number of fluorinated pendants does not seem to 414
21
have an influence on size and zeta potential. The polymer mass in the formulation is a more 415
important parameter. Indeed, NCs formulated from 20 mg of polymer exhibit larger sizes than 416
NCs from 50 and 30 mg, especially with the fluorinated polymers (136 – 147 nm at 20 mg 417
compared to 117 – 119 nm at higher polymer amounts). For all polymers, the polydispersity 418
(PDI) increases as the polymer quantity decreases (< 0.19 at 50 mg, > 0.28 at 20 mg), 419
suggesting a wider size distribution at low polymer amount. This might arise from the 420
presence of a second population of objects, such as non-encapsulated PFOB droplets, despite 421
the addition of perfluorinated chains in the polymer, as previously observed with PLGA-422
PEG.18 For all polymers, the zeta potential is negative and no significant difference is induced 423
by the number of perfluoroalkyl chains (Table 2). 424
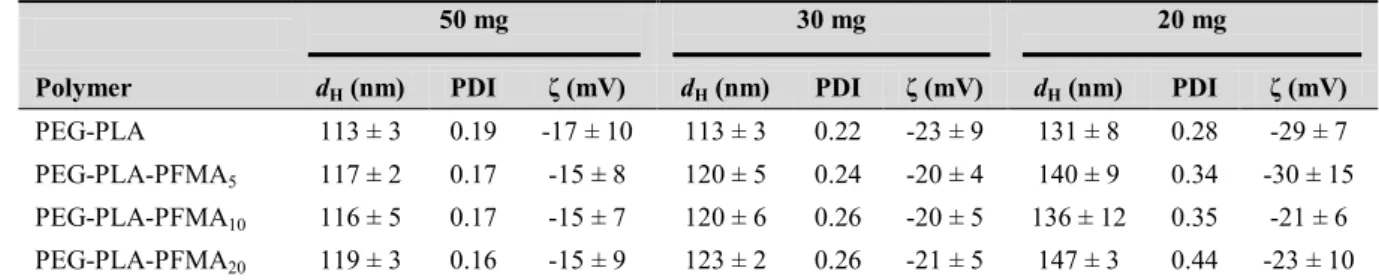
Table 2. Characterization of nanocapsules prepared from 50, 30 or 20 mg of each polymer.
425
Data are presented as mean ± SD (n > 3) for dH and ζ values. 426
50 mg 30 mg 20 mg
Polymer dH (nm) PDI ζ (mV) dH (nm) PDI ζ (mV) dH (nm) PDI ζ (mV)
PEG-PLA 113 ± 3 0.19 -17 ± 10 113 ± 3 0.22 -23 ± 9 131 ± 8 0.28 -29 ± 7
PEG-PLA-PFMA5 117 ± 2 0.17 -15 ± 8 120 ± 5 0.24 -20 ± 4 140 ± 9 0.34 -30 ± 15
PEG-PLA-PFMA10 116 ± 5 0.17 -15 ± 7 120 ± 6 0.26 -20 ± 5 136 ± 12 0.35 -21 ± 6
PEG-PLA-PFMA20 119 ± 3 0.16 -15 ± 9 123 ± 2 0.26 -21 ± 5 147 ± 3 0.44 -23 ± 10
427
PFOB encapsulation efficiency 428
PFOB encapsulation efficiency in NCs was measured by 19F NMR after freeze-drying to 429
remove any non-encapsulated PFOB droplets remaining. As shown in Figure 5, more PFOB 430
is encapsulated in PEG-PLA-PFMAx NCs compared to plain PEG-PLA NCs. When 431
comparing to the PLA-PEG control, the encapsulation efficacy of PFOB is significantly 432
higher for PEG-PLA-PFMA5 and PEG-PLA-PFMA10 ers for all initial masses of polymer but 433
not for PEG-PLA-PFMA20. The difference appears more important at low polymer amounts, 434
22
with 49-61% PFOB encapsulated in PEG-PLA-PFMA5 and PEG-PLA-PFMA10 NCs 435
compared to 35% in PEG-PLA NCs at 30 mg, and 37-47% compared to 24% at 20 mg. Such 436
results are consistent with interfacial tension measurements and demonstrate that fluorophilic 437
interactions between PFOB and the perfluorinated units of the polymers allow entrapping 438
more PFOB into the NCs. One can also observe that PFOB encapsulation efficiency is slightly 439
lower with PEG-PLA-PFMA20 compared to PEG-PLA-PFMA5 and PEG-PLA-PFMA10 440
(about 9 – 12% of difference). This could be due to a stronger self-association of the polymer 441
with the largest fluorinated block of 20 pendants, reducing their ability to interact with PFOB 442
as compared with shorter blocks of 5 – 10 fluorinated units. 443
444
Figure 5. PFOB encapsulation efficiency in freeze-dried NCs. Results are presented as mean
445
± SD (n = 4). Statistical significance was analyzed using an ANOVA test: **** p<0.0001, 446 *** p<0.001, ** p<0.01. 447 448 Nanocapsules morphology 449
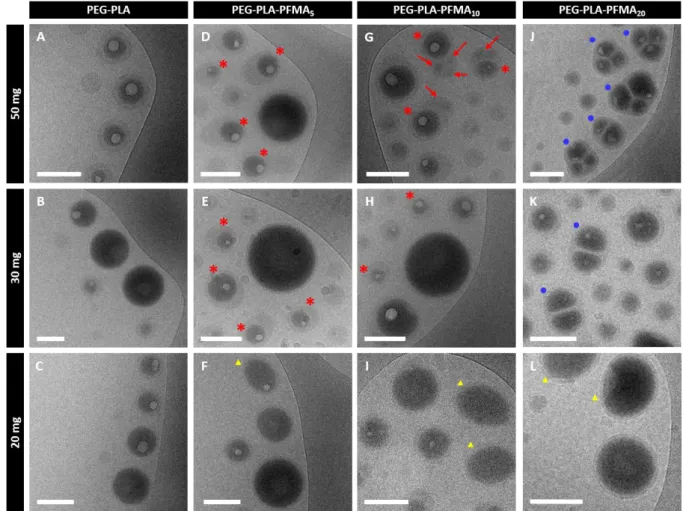
Nanocapsules were then imaged by TEM with negative staining and cryo-TEM. In TEM 450
images, one can observe mostly spherical objects with PEG-PLA (Figure 6A,B,C) whereas 451
PEG-PLA-PFMAx NCs exhibit more heterogeneous morphologies (Figure 6 and 452
supplementary material S6 to S9). Indeed, capsules appear less spherical and a lot of broken 453
capsules can be observed at low polymer amounts (Figure 6E,F,H,I,K,L). These broken 454
23
capsules, which were neither observed in plain PEG-PLA samples nor for NCs made from 50 455
mg of PEG-PLA-PFMAx, are sometimes very large (up to 1 µm diameter, see supplementary 456
material). Such finding is surprising since NCs are filtered on 0.45 µm after the emulsion 457
evaporation process. These objects might be very deformable to pass through the filter, and 458
might be broken because of the filtration or because they are under vacuum during TEM 459
observation. These large capsules can therefore explain the high PDI values observed at low 460
fluorinated polymer amounts (Table 2). 461
462
Figure 6. TEM images of formulated NCs with negative staining (scale bars = 200 nm).
463
Additional images are shown in supplementary material. 464
Cryo-TEM images allow distinguishing the dark PFOB core, with high electronic density, 465
from the lighter polymeric shell (Figure 7 and supplementary material S6 to S9). NCs also 466
present a white meniscus in the core, due to rapid freezing, which causes solidification and 467
24
shrinking of PFOB. PFOB therefore does not fill entirely the shell cavity anymore as observed 468
previously.18,19,40 One can observe that NCs morphology is strongly influenced by the number 469
of fluorinated chains and the amount of polymer used for formulation. Indeed, all PEG-PLA 470
NCs possess a spherical core-shell structure (Figure 7A,B,C), whereas the presence of five 471
perfluoroalkyl chains induces the formation of some elongated NCs with a non-centered 472
PFOB core looking like sunny-side up eggs (shown by red stars in Figure 7D,E). Such 473
elongated morphology had already been observed with COOH-PEG-PLA NCs. This was 474
attributed to an interfacial instability due to electrostatic repulsions between deprotonated 475
carboxy functions leading to an increase of the total surface area.30 Comparatively, with PEG-476
PLA-PFMA5, we can imagine that the incompatibility between the various blocks may force 477
the chains to adopt a particular conformation leading to an increase of the total surface area. 478
The same type of morphologies (shown by red stars) is observed with 50 and 30 mg of PEG-479
PLA-PFMA10, but with additional dark domains (shown by red arrows) in the same object 480
(Figure 7G,H), which correspond either to other PFOB cores, or to fluorinated rich domains 481
formed by aggregation of the perfluoroalkyl chains of the polymer.41 PEG-PLA-PFMA20 482
leads to NCs with 2 or 3 distinct PFOB cores at high polymer amounts, as shown by blue 483
circles in Figure 7J,K. Such multi-core structures are probably favored by strong interactions 484
between PFOB and perfluoroalkyl pendants. However, at 20 mg of each fluorinated polymer, 485
although morphologies are still a bit heterogeneous within a same sample, one can observe a 486
majority of capsules with a single centered PFOB core and a thin shell (Figure 7F,I,L). 487
Interestingly, some are not perfectly spherical and seem ellipsoidal/elongated (shown by 488
yellow triangles), which may indicate different mechanical properties. In this type of capsules, 489
the PFOB core is not spherical and the shell thickness is homogeneous within the whole 490
capsule, which is different from the other elongated NCs observed at higher polymer amounts. 491
25 492
Figure 7. Cryo-TEM images of formulated NCs (scale bars = 100 nm). Additional images are
493
given in supplementary material. Red stars show elongated NCs with a non-centered spherical 494
PFOB core at high amounts of PEG-PLA-PFMA5 and PEG-PLA-PFMA10. In the case of 495
PEG-PLA-PFMA10, this type of elongated NCs also possesses additional darker domains 496
shown by red arrows. Blue circles show NCs with 2 or 3 distinct PFOB cores. Yellow 497
triangles show ellipsoidal NCs with a single non-spherical PFOB core and a shell thickness 498
homogeneous within the same capsule. 499
Shell thickness 500
Small Angle Neutron Scattering (SANS) was used to statistically determine shell thickness. 501
We focused on PEG-PLA-PFMA5 and PEG-PLA-PFMA10 which showed better PFOB 502
encapsulation efficiency and higher solubility in methylene chloride than PEG-PLA-PFMA20. 503
NCs were resuspended in the appropriate mixture of H2O and D2O to match the scattering 504
26
length density of the PFOB core and allow focusing on the polymeric shell. Scattered 505
intensity curves were fitted with the vesicle model, assuming a log-normal distribution for 506
both shell thickness and core radius. One example of a satisfying fit and the best fit 507
parameters obtained for shell thickness are represented in Figure 8. Fitted curves and 508
numerical values of shell thickness and core radius are given in supplementary material 509
(Figure S10 and Table S1). Mean PFOB core radii are all in the same range (53 – 56 nm) with 510
a high polydispersity, in agreement with DLS measurements. The mean thickness of PEG-511
PLA NCs is not impacted by the amount of polymer, with values between 16 and 14.5 nm. 512
However, with fluorinated triblock polymers, the mean thickness is decreasing down to 13.5 513
nm and 11 nm for 20 mg of PEG-PLA-PFMA5 and PEG-PLA-PFMA10, respectively, as 514
compared with 50 and 30mg polymer where no difference can be observed. This decrease is 515
meaningful as the precision of SANS fitting is on the 1-2 nm order. A high polydispersity is 516
nevertheless observed for all samples, especially for NCs made from higher fluorinated 517
polymer amounts. This can be attributed to PFOB cores not being always well centered as 518
seen on cryo-TEM images. 519
520
Figure 8. Experimental scattered intensity curve (black circles) of NCs made from 20 mg
521
PEG-PLA-PFMA10 in PFOB matching condition fitted with the vesicle model (red line) (left) 522
27
and shell thickness values of NCs determined by fitting with the vesicle model (mean ± SD) 523
(right). 524
3.4. Cytotoxicity studies
525
The biological inertness of perfluorocarbons is well documented.42 Nevertheless, 526
perfluoroalkyl moieties are often associated to a certain toxicity due to their low excretion 527
profiles and prolonged retention in the organism, especially linear perfluorinated chains 528
longer than eight carbons.43–45 Therefore the potential cytotoxicity of PEG-PLA-PFMAx NCs 529
was investigated using an MTT assay on two representative cell types. Human umbilical vein 530
endothelial cells (HUVEC) were chosen for their high sensitivity and rapid response to 531
external stimuli which make them a widely used in vitro model for polymer cytotoxicity 532
evaluation.46 J774.A1 cells play a key role in phagocytosis and were chosen to highlight the 533
possible toxicity of NCs after being engulfed by macrophages. At both 24 and 72h incubation 534
times, cell viability of HUVEC slightly decreases as NCs concentration increases, but remains 535
above 70% until 1 mg/mL, and above 50% at 10 mg/mL, with no difference between the 536
polymers (Figure 9A and Figure S11A). Regarding J774.A1, cellular viability remains above 537
80% until 1 mg/mL at both incubation times. A strong viability decrease down to 45% after 538
24h and 20% after 72h is observed at 10 mg/mL, but this high concentration is unlikely to be 539
reached in vivo (Figure 9A and Figure S11A). For both cell types and both incubation times, 540
the perfluoroalkyl chains do not induce any specific toxicity in comparison to plain PEG-541
PLA, with no influence of the number of perfluoroalkyl chains. These results concur with 542
reports from Koda et al. on the low toxicity of an amphiphilic fluorous random copolymer 543
containing PEG and C8F17 pendants.34 544
28 545
Figure 91. Viability assays on HUVEC (top) and J774.A1 (bottom) cell lines after 72h
546
incubation with nanocapsules (A) or polymers degradation products (B). Results are presented 547
as mean ± SD (n = 3). 548
PEG-PLA diblock copolymer is well known to be degradable into non-toxic products (lactic 549
acid and polyethylene glycol). However, toxicity of the remaining short PFMA block after 550
degradation of the triblock copolymers must be investigated. Accelerated hydrolytic 551
degradations of PEG-PLA-PFMA5, PEG-PLA-PFMA10, and PEG-PLA as control, were 552
carried out in basic conditions. The in vitro cytotoxicity of degradation products was then 553
evaluated using an MTT assay on the same cell lines as for NCs. Due to insolubility issues, 554
only low concentrations could be tested (maximum 0.01 mg/mL of initial polymer). In this 555
range of concentrations, high HUVEC cellular viabilities (> 70%) were observed at both 556
incubation times (Figure 9B and Figure S11B). J774.A1 cells show a slightly higher 557
sensitivity depending on the incubation time, with cell viabilities above 87% after 24h and 558
29
above 67% after 72h. Within experimental error, no significant differences between polymers 559
can be observed for both cell types, indicating an absence of obvious toxicity arising from 560
fluorinated degradation products (Figure 9B and Figure S11B). These results are encouraging 561
and additional in vivo studies will be required to evaluate the potential toxicity arising from a 562
prolonged exposure to the degradation products. 563
564
3.5. In vitro ultrasound measurements
565
Finally, the acoustic response of NCs made from 30 and 20 mg polymer was evaluated in 566
vitro at 5 MHz. Figure 10A presents the ultrasound scattered intensities measured at 567
fundamental frequency and subtracted by the background level produced by Milli-Q water. 568
No non-linear response could indeed be detected with our capsules, in agreement with 569
previous studies showing the absence of nonlinear scattering with nano-sized agents.47,48 At 570
30 mg polymer, all samples did not yield an ultrasound signal much higher than the 571
background (intensity < 0.9 x 10³ arbitrary units, a.u.). However, at 20 mg polymer, the 572
ultrasound scattered intensity increases with the number of fluorinated pendant chains, from 573
1.4 x 10³ a.u. with plain PEG-PLA to 2.5 x 10³ a.u. with PEG-PLA-PFMA5 and 5.3 x 10³ a.u. 574
with PEG-PLA-PFMA10. Such enhancement probably arises from several contributions which 575
are summarized in Table 3. As shown by De Jong et al., the scattering cross section of a 576
particle is defined as
where k is the wavenumber, R is 577
the radius of the particle, κd and κ the compressibilities of respectively the particle and the 578
medium, ρd and ρ the densities of respectively the particle and the medium.49 A contrast agent 579
will therefore backscatter ultrasound waves more effectively if its radius is larger and if its 580
physical properties (compressibility and density) differ a lot from the ones of the surrounding 581
medium. Here, the slight diameter difference (up to 27 nm) could hardly be considered 582
30
responsible for the higher efficacy in scattering ultrasound. One of the main contribution is 583
probably the reduction of shell thickness (down to 13.5 nm for PEG-PLA-PFMA5 and 11 nm 584
for PEG-PLA-PFMA10) which may increase the capsules compressibility and echogenicity as 585
previously observed.15 Indeed, AFM indentation experiments performed on PFOB 586
microcapsules have shown that a thinner shell leads to overall softer capsules.50 Moreover, 587
higher encapsulated PFOB contents and higher amounts of fluorinated chains in the polymers 588
both increase capsule density and strengthen the difference of acoustic impedance with the 589
surrounding medium, as previously observed with linear fluorinated PLAs.19 Although the 590
quantity of PFOB and fluorinated chains is also high in samples made from 30 mg of PEG-591
PLA-PFMA5 and PEG-PLA-PFMA10, these two samples possess a larger shell thickness (> 592
15 nm) and a different morphology with a non-centered PFOB core (Figure 10B). The 593
observed differences in capsules morphology are probably related to some differences in their 594
mechanical properties which impact their response to ultrasound waves. AFM indentation 595
experiments should be performed in the future to relate mechanical properties and ultrasound 596
signal. 597
Nanocapsules made from 20 mg of fluorinated triblock polymers therefore appear as 598
promising UCAs. Although the measured ultrasound scattered intensities were still lower that 599
with SonoVue® microbubbles (16.5 x 10³ a.u.) due to their large radius (20-fold larger than 600
NCs) and gaseous core, these NCs have greater potential to accumulate into the tumors by the 601
EPR effect and allow contrast ultrasound imaging of tumors. 602
31 603
Figure 10. (A) Ultrasound scattered intensity by NCs resuspended at 5 mg/mL made from 30
604
mg (circles) and 20 mg (diamonds) of each polymer and by Sonovue microbubbles (dark 605
triangle) as positive control. Results are presented as mean ± SEM (n > 9). (B) Table 606
summarizing NCs characteristics which could account for differences of ultrasound 607
scattering: simplified representation of their morphology, mean hydrodynamic diameter (dH), 608
mean shell thickness (T), PFOB quantity and C8F17 chains quantity contained in 1 mL of 609
formulation resuspended at a final polymer concentration of 5 mg/mL for ultrasound 610
measurements. 611
32
4. Conclusion
612
Triblock PEG-PLA-PFMA polymers with distinct lengths of PFMA block (5, 10 or 20 613
fluorinated pendant chains) were successfully synthesized and were shown to adsorb at the 614
PFOB/methylene chloride interface. These favorable fluorous interactions led to an increase 615
of the PFOB encapsulation efficiency into nanocapsules made of fluorinated polymers 616
compared to plain PEG-PLA. The morphology of the nanocapsules was strongly influenced 617
by the number of perfluorinated chains and the amount of polymer used for formulation: 618
capsules with several PFOB cores or fluorinated-rich domains are obtained at high polymer 619
amount, while a single PFOB core and a thinner shell are observed at low polymer amount. 620
SANS measurements confirmed the observed reduction of mean shell thickness down to 11 621
nm with PEG-PLA-PFMA10, which led to a 3.7-fold higher in vitro ultrasound response at 5 622
MHz compared to plain PEG-PLA nanocapsules. Finally, no in vitro cytotoxicity was induced 623
by both the fluorinated polymers and their degradation products. Results are encouraging, and 624
future work will consist in performing in vivo studies to confirm the potential of these 625
PEGylated/fluorinated nanocapsules to be used as ultrasound contrast agents for tumor 626
imaging. 627
5. Supporting information
628
Supporting information is available: scheme of the experimental set up for in vitro ultrasound 629
measurements, 1H NMR spectra of PEG-PLA and PEG-PLA-Br, SEC chromatograms, DLS 630
of polymers in methylene chloride and chloroform, DSC thermograms, additional TEM and 631
cryo-TEM images, SANS curves fitting, cytotoxicity results after 24h incubation, DLS curves 632
of NCs (correlation and distribution functions). 633
33
6. Acknowledgements
635
Authors would like to thank Mehrez Sghaier and Najet Yagoubi from Laboratoire Matériaux 636
et Santé (EA401, Univ. Paris-Sud) for DSC experiments, Flora Lefebvre for some NMR 637
measurements and Stéphanie Denis (Institut Galien Paris-Sud) for her help with cell culture. 638
This work has been supported by the Région Ile-de-France in the framework of DIM Nano-K. 639
The present work has benefited also from the core facilities of Imagerie‐ Gif, 640
(http://www.i2bc.paris‐ saclay.fr), member of IBiSA (http://www.ibisa.net), supported by 641
“France‐ BioImaging” (ANR‐ 10‐ INBS‐ 04‐ 01), and the Labex “Saclay Plant Science” 642
(ANR‐ 11‐ IDEX‐ 0003‐ 02). SANS analysis was performed using SasView software, 643
originally developed by the DANSE project under NSF award DMR-0520547. Authors 644
acknowledge financial support from ANR (Investissements d’Avenir, Nanobiotechnologies, 645
ANR-10-NANO-06-04). Institut Galien Paris-Sud is a member of the Laboratory of 646
Excellence LERMIT supported by a grant from ANR (ANR-10-LABX-33). 647
34 References
649
(1) Boissenot, T.; Bordat, A.; Fattal, E.; Tsapis, N. Ultrasound-Triggered Drug Delivery for Cancer
650
Treatment Using Drug Delivery Systems: From Theoretical Considerations to Practical
651
Applications. Journal of Controlled Release. 2016, pp 144–163.
652
(2) Schutt, E. G.; Klein, D. H.; Mattrey, R. M.; Riess, J. G. Injectable Microbubbles as Contrast Agents for
653
Diagnostic Ultrasound Imaging: The Key Role of Perfluorochemicals. Angew. Chemie-International
654
Ed. 2003, 42 (28), 3218–3235.
655
(3) Paefgen, V.; Doleschel, D.; Kiessling, F. Evolution of Contrast Agents for Ultrasound Imaging and
656
Ultrasound-Mediated Drug Delivery. Front. Pharmacol. 2015, 6.
657
(4) Schneider, M.; Arditi, M.; Barrau, M. B.; Brochot, J.; Broillet, A.; Ventrone, R.; Yan, F. Br1 - a New
658
Ultrasonographic Contrast Agent Based on Sulfur Hexafluoride-Filled Microbubbles. Invest. Radiol.
659
1995, 30 (8), 451–457. 660
(5) Fisher, N. G.; Christiansen, J. P.; Leong-Poi, H.; Jayaweera, A. R.; Lindner, J. R.; Kaul, S. Myocardial
661
and Microcirculatory Kinetics of BR14, a Novel Third-Generation Intravenous Ultrasound Contrast
662
Agent. J. Am. Coll. Cardiol. 2002, 39 (3), 530–537.
663
(6) Lindner, J. R. Microbubbles in Medical Imaging: Current Applications and Future Directions. Nat.
664
Rev. Drug Discov. 2004, 3 (6), 527–532.
665
(7) Abou-Saleh, R. H.; Peyman, S. A.; Johnson, B. R. G.; Marston, G.; Ingram, N.; Bushby, R.; Coletta, P. L.;
666
Markham, A. F.; Evans, S. D. The Influence of Intercalating Perfluorohexane into Lipid Shells on
667
Nano and Microbubble Stability. Soft Matter 2016, 12 (34), 7223–7230.
668
(8) Yuan, F.; Dellian, M.; Fukumura, D.; Leunig, M.; Berk, D. A.; Torchilin, V. P.; Jain, R. K.
Vascular-669
Permeability in a Human Tumor Xenograft - Molecular-Size Dependence and Cutoff Size. Cancer
670
Res. 1995, 55 (17), 3752–3756.
671
(9) Leroy, V.; Norisuye, T. Investigating the Existence of Bulk Nanobubbles with Ultrasound.
672
Chemphyschem 2016, 17 (18), 2787–2790.
35
(10) Cosco, D.; Fattal, E.; Fresta, M.; Tsapis, N. Perfluorocarbon-Loaded Micro and Nanosystems for
674
Medical Imaging: A State of the Art. J. Fluor. Chem. 2015, 171, 18–26.
675
(11) El-Sherif, D. M.; Wheatley, M. A. Development of a Novel Method for Synthesis of a Polymeric
676
Ultrasound Contrast Agent. J. Biomed. Mater. Res. A 2003, 66 (2), 347–355.
677
(12) Chlon, C.; Guedon, C.; Verhaagen, B.; Shi, W. T.; Hall, C. S.; Lub, J.; Bohmer, M. R. Effect of Molecular
678
Weight, Crystallinity, and Hydrophobicity on the Acoustic Activation of Polymer-Shelled
679
Ultrasound Contrast Agents. Biomacromolecules 2009, 10 (5), 1025–1031.
680
(13) Yang, P.; Li, D.; Jin, S.; Ding, J.; Guo, J.; Shi, W. B.; Wang, C. C. Stimuli-Responsive Biodegradable
681
Poly(Methacrylic Acid) Based Nanocapsules for Ultrasound Traced and Triggered Drug Delivery
682
System. Biomaterials 2014, 35 (6), 2079–2088.
683
(14) Sanna, V.; Pintus, G.; Bandiera, P.; Anedda, R.; Punzoni, S.; Sanna, B.; Migaleddu, V.; Uzzau, S.; Sechi,
684
M. Development of Polymeric Microbubbles Targeted to Prostate-Specific Membrane Antigen as
685
Prototype of Novel Ultrasound Contrast Agents. Mol. Pharm. 2011, 8 (3), 748–757.
686
(15) Pisani, E.; Tsapis, N.; Galaz, B.; Santin, M.; Berti, R.; Taulier, N.; Kurtisovski, E.; Lucidarme, O.;
687
Ourevitch, M.; Doan, B. T.; et al. Perfluorooctyl Bromide Polymeric Capsules as Dual Contrast
688
Agents for Ultrasonography and Magnetic Resonance Imaging. Adv. Funct. Mater. 2008, 18 (19),
689
2963–2971.
690
(16) Diou, O.; Tsapis, N.; Giraudeau, C.; Valette, J.; Gueutin, C.; Bourasset, F.; Zanna, S.; Vauthier, C.;
691
Fattal, E. Long-Circulating Perfluorooctyl Bromide Nanocapsules for Tumor Imaging by
(FMRI)-F-692
19. Biomaterials 2012, 33 (22), 5593–5602.
693
(17) Pisani, E.; Tsapis, N.; Paris, J.; Nicolas, V.; Cattel, L.; Fattal, E. Polymeric Nano/Microcapsules of
694
Liquid Perfluorocarbons for Ultrasonic Imaging: Physical Characterization. Langmuir 2006, 22 (9),
695
4397–4402.
696
(18) Diou, O.; Brulet, A.; Pehau-Arnaudet, G.; Morvan, E.; Berti, R.; Astafyeva, K.; Taulier, N.; Fattal, E.;
697
Tsapis, N. PEGylated Nanocapsules of Perfluorooctyl Bromide: Mechanism of Formation, Influence
698
of Polymer Concentration on Morphology and Mechanical Properties. Colloids Surf B Biointerfaces
36 2016, 146, 762–769.
700
(19) Houvenagel, S.; Picheth, G.; Dejean, C.; Brulet, A.; Chenneviere, A.; Couture, O.; Huang, N.; Moine, L.;
701
Tsapis, N. End-Chain Fluorination of Polyesters Favors Perfluorooctyl Bromide Encapsulation into
702
Echogenic PEGylated Nanocapsules. Polym. Chem. 2017, 8 (16), 2559–2570.
703
(20) Berlepsch, H. v.; Böttcher, C.; Skrabania, K.; Laschewsky, A. Complex Domain Architecture of
704
Multicompartment Micelles from a Linear ABC Triblock Copolymer Revealed by Cryogenic
705
Electron Tomography. Chem. Commun. 2009, 0 (17), 2290.
706
(21) , C. Synthesis and Micellar Self-Assembly of
707
T d − −F u C m PEO C
708
Langmuir 2009, 25 (13), 7594–7601.
709
(22) Skrabania, K.; Berl , C.; Laschewsky, A. Synthesis of Ternary,
710
d − −F u C m C u R FT P m z d
711
Their Self-Assembly into Multicompartment Micelles. Macromolecules 2010, 43 (1), 271–281.
712
(23) Kaberov, L. I.; Verbraeken, B.; Hruby, M.; Riabtseva, A.; Kovacik, L.; Kereïche, S.; Brus, J.; Stepanek,
713
P.; Hoogenboom, R.; Filippov, S. K. Novel Triphilic Block Copolymers Based on
Poly(2-Methyl-2-714
Oxazoline)– Block –poly(2-Octyl-2-Oxazoline) with Different Terminal Perfluoroalkyl Fragments:
715
Synthesis and Self-Assembly Behaviour. Eur. Polym. J. 2017, 88, 645–655.
716
(24) Kaberov, L. I.; Verbraeken, B.; Riabtseva, A.; Brus, J.; Talmon, Y.; Stepanek, P.; Hoogenboom, R.;
717
Filippov, S. K. Fluorinated 2-Alkyl-2-Oxazolines of High Reactivity: Spacer-Length-Induced
718
Acceleration for Cationic Ring-Opening Polymerization As a Basis for Triphilic Block Copolymer
719
Synthesis. ACS Macro Lett. 2018, 7 (1), 7–10.
720
(25) NIJENHUIS, A. J.; GRIJPMA, D. W.; PENNINGS, A. J. Lewis Acid-Catalyzed Polymerization of L-Lactide
721
- Kinetics and Mechanism of the Bulk-Polymerization. Macromolecules 1992, 25 (24), 6419–6424.
722
(26) Spasova, M.; Mespouille, L.; Coulembier, O.; Paneva, D.; Manolova, N.; Rashkov, I.; Dubois, P.
723
Amphiphilic Poly(D- or L-Lactide)-b-Poly(N,N-Dimethylamino-2-Ethyl Methacrylate) Block
724
Copolymers: Controlled Synthesis, Characterization, and Stereocomplex Formation.