HAL Id: hal-02923793
https://hal.archives-ouvertes.fr/hal-02923793
Submitted on 4 Feb 2021
HAL is a multi-disciplinary open access
archive for the deposit and dissemination of
sci-entific research documents, whether they are
pub-lished or not. The documents may come from
teaching and research institutions in France or
abroad, or from public or private research centers.
L’archive ouverte pluridisciplinaire HAL, est
destinée au dépôt et à la diffusion de documents
scientifiques de niveau recherche, publiés ou non,
émanant des établissements d’enseignement et de
recherche français ou étrangers, des laboratoires
publics ou privés.
The origin of present-day Antarctic precipitation from
surface snow deuterium excess data
P. Ciais, J. White, J. Jouzel, J. Petit
To cite this version:
P. Ciais, J. White, J. Jouzel, J. Petit. The origin of present-day Antarctic precipitation from surface
snow deuterium excess data. Journal of Geophysical Research, American Geophysical Union, 1995,
100 (D9), pp.18917. �10.1029/95JD01169�. �hal-02923793�
JOURNAL OF GEOPHYSICAL RESEARCH, VOL. 100, NO. D9, PAGES 18,917-18,927, SEPTEMBER 20, 1995
The origin of present-day Antarctic precipitation
from surface
snow deuterium
excess data
P. Ciais, •,2 J. W. C. White, 2 J. Jouzel, •,3 and J. R. Petit 3
Abstract. The deuterium excess
(d) is defined as a linear combination
of the D/H and
•80/•60 ratios
in natural
waters.
We present
an interpretation
of deuterium
excess
data in
surface Antarctic snow, using an isotopic model to derive information on the origin of
present-day Antarctic precipitation. The data come from near the coast (D47, Adelie
Land) and from inland (south pole, 1000 km from the sea). The one-dimensional isotopic
model belongs to the Rayleigh family but fully accounts for mixed cloud processes
between 0øC and -30øC. Modeling d in polar snowfalls meets the problem of a large
sensitivity to the saturation conditions prevailing at snow formation. Therefore we decided
to tune the saturation in the model in order to yield realistic mean d values, but we use
the seasonal phase of d versus/5, which is less sensitive to the saturation conditions, as an
independent validation of the model predictions. Both inland and near the coast, our model can simulate the observed phase between d and/5 in snow with moisture of
subtropical
origin (40ø-20øS).
Although we do not treat specifically
storm precipitation
near the coast, this study indicates that the observed phase between d and/5 brings up a
new validation of isotopic models. It supports a distant vapor source for large-scale
precipitation delivered to the Antarctic continent.
1. Introduction
Water isotopes deuterium and oxygen 18 have found appli- cations in such diverse fields as cloud physics, climatology, hydrology, and paleoclimate studies. Usually, isotopic field measurements are combined with the modeling of isotopic fractionation occurring at various stages of the water cycle, and the interpretation takes advantage of the relationships that exist between isotopic distributions and various, generally cli- mate-related, parameters. In polar snow isotope studies, in- creasing attention has been given to the deuterium excess d, first introduced by Dansgaard [1964], which is defined as the
linear combination of 8D and 8180:
d = 8D- 8 8•80
(1)
where the 8 notation is used to express isotopic ratio R relativeto the SMOW standard as
R - RsMow
8 = x 1000
R SMOW
The factor of 8 has been chosen from the meteoric water line,
which scales the 8D versus 8180 distribution of global precip-
itation [Craig, 1961]. It is well known that in polar regions, both
8D and 8180 are linear functions of the local temperature.
Since definition (1) eliminates that first-order temperature de- pendence, d is a proxy of climatic variables that are present, •Laboratoire de Mod•lisation du Climat et de l'Environnement, Gif
sur Yvette, France.
2Stable Isotope Laboratory, Institute of Arctic and Alpine Research,
University of Colorado, Boulder.
3Laboratoire de Glaciologie et de G•ophysique de l'Environnement,
St. Martin d'H•res, France.
Copyright 1995 by the American Geophysical Union. Paper number 95JD01169.
0148-0227/95/95 JD-01169505.00
but are otherwise masked, in the isotope-temperature relation- ship. In other words, d can be regarded as a residual that
relates to the (slight) differences between isotopes D and 180.
These differences come physically from a proportionally greater kinetic versus thermodynamic fractionation for mole-
cule H2180 compared to molecule HDO.
Attempts to derive climatic information from the deuterium
excess have related d values on the ice sheet to sea surface
temperature and sea surface humidity at the initial evaporation [Jouzel et al., 1982; Johnsen et al., 1989; Petit et al., 1991]. Such
studies have shown that the saturation condition of the water
vapor during snow formation plays a large role in the d values predicted by isotopic models [Jouzel and Merlivat, 1984]. Un- fortunately, very little is known about this latter variable, and this has put a limit on the ability to derive ocean source vari-
ables from the measurement of d in snow. We address here the
problem of deriving the origin of present-day Antarctic pre- cipitation from the observed seasonality of d versus 8D. We have selected two sites, D47 (154øE, 75øS, at 110 km from the sea), and South Pole station (1000 km from the sea) in order to examine the differences between coastal and inland regions.
The seasonality of isotope data in snow provides the annual mean values and the phase differences between 8 and d. Since the annual mean d is very sensitive to the saturation condi- tions, we have focused on the phase. The tool we used is a dynamically simple one-dimensional (l-D) isotopic model [Ci- ais and Jouzel, 1994], which treats processes occurring in ide-
alized isolated air masses. This model is derived from the
classic model of Jouzel and Merlivat [1984] and accounts real- istically for the microphysical processes occurring in mixed clouds where the airborne condensed phase is composed of both ice crystals and liquid droplets. Conceptually, it has the advantage of using a continuous saturation curve for the air mass condensation history and hence of improving the model- ing of d in the temperature range 0øC to -30øC. Values of 8 and d predicted by this new model are nevertheless fairly close 18,917
18,918 CIAIS ET AL.: ORIGIN OF ANTARCTIC PRECIPITATION
to those found by previous isotopic models, and they are in fair agreement with the observations [Ciais and Jouzel, 1994].
2. Observations
2.1. Preserved Seasonal Variations of D and 180 in Snow Few data sets resolve the seasonal cycle in Antarctica be- cause of the low rate of accumulation. In the interior, seasonal variations in • are not preserved in the firn owing to low accumulation. Near the coast, precipitation is 10 times larger than inland, and the • of snow shows seasonal variations char- acterized by maximum • in summer and minimum in winter. However, the roughness at the ice sheet surface and the scour- ing by wind probably yield irregularities in the snow stratigra- phy that may erase, at least in part, the yearly isotopic signal [Pettre et al., 1986; Whillans, 1975]. Diffusion of isotopic water vapor in the firn pores smoothes high frequencies in the sea- sonal signal. In addition, diffusion acts as a low-pass filter and yields a smooth annual signal from isotopically distinct precip- itation events [Whillans and Grootes, 1985]. In Greenland ice, when the • wavelength is below •20 cm of ice, diffusion blurs the annual signal [Johnsen, 1977].
The data from South
Pole (9 gcm -2 yr -•) and D47 (26.7 g
cm
-2 yr-•) should
be blurred
by diffusion,
but they show
well-
preserved seasonal oscillations, indicating that diffusion is in- hibited either by low temperatures or by the presence of ice layers in the firn. Yet, because some isotopic years are likely missing in the records, we only examine the average d-• phaseover the total duration of our data. The same treatment is also
applied to D47, where katabatic winds disturb the annual lay- ering of snow [Parish and Wendlet, 1991].
2.2. Inland Data
Two snow pits were sampled in situ during the 1977-1978 and 1983-1984 field seasons: the "1978 pit" and "1984 pit." The sampling increment being 2 cm, one annual cycle repre- sents 10 samples. The 2-m-long 1984 pit exhibits 9 annual cycles, and the 5-m-long 1978 pit has 20 annual cycles (data are plotted in Figures la and lb). The experimental precision of
our mass spectrometer is 0.5%0 in •D and 0.1%o in •sO,
yielding an accuracy in the d data of 1%o, roughly 20% of the annual amplitude. Both the 1978 and 1984 data show a large short-term variability, which we filtered out in the time domain using spline functions to cut out spikes lower than 1%o.
Aldaz and Deutch [1967] have shown that •D and •mO at
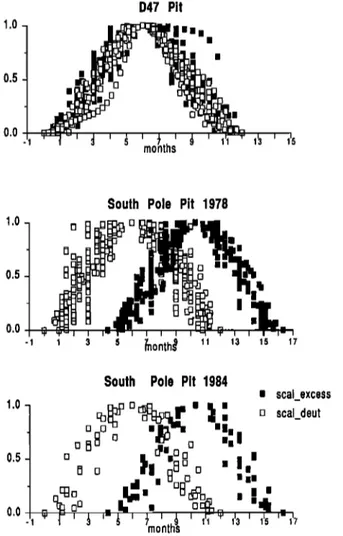
South Pole are a maximum in summer (December-January) and minimum in winter (March-November). However, the excess has a distinct phase, being in general highest during the fall and lowest during spring, and therefore lagging • by 1 to 6 months. It is interesting to note that a similar lag of d versus • is also reported for central Greenland [Johnsen et al., 1989]. For further comparison with model runs which deal with an average year, we attempted to quantify the value of the d-b phase by scaling the data in the range [0, 1] in both the time and • directions to present them in an idealized average year (Figure 2). Figure 2 indicates an average lag of 5 months of d with respect to 3.
2.3. Adelie Land Data
The D47 site is on the Dumont-D'Urville-Dome C traverse, at 110 km from the sea (elevation, 1550 m; mean temperature, -25øC). During the 1988-1989 summer, high resolution sam-
Deuterium -320 ß -360 -400 -440
p_•,th
ß . , . . . , . , . , . ,--•?, .
Deuler|urn I:xce asFigure 1. Plot of 5D and excess as a function of depth in the (a) 1984 and (b) 1978 snow pits at South Pole and (c) the pit at site D47 (units are per mil versus SMOW). The short-term variability of the deuterium excess data is filtered out in the time domain using spline functions (see text).
pling of surface snow was made in a pit from 0- to 10-m depth with an increment of 3 cm. Figure lc shows 5D and d for the surface pit. The pit contains 24-26 isotopic cycles, and despite possible reworking of snow by wind, we believe that the cycles' periodicity is 1 year because they yield an average accumula-
tion rate of 21 gcm -2 yr -• comparable
to the/3 radioactivity
value of 26.7 gcm -2 yr -• (M. Pourchet,
unpublished
data,
1990). Below 7 m, annual variations in • are dampened, pos- sibly owing to diffusion in firn. A scaled plot of the average year for 5D and d is given in Figure 2. In contrast to South Pole data, d and 5D vary in phase throughout the year.3. Modeling Monthly 6 and Excess
We model monthly isotopic composition of the precipitation at D47 and South Pole, based on meteorological data for the vapor formation and the poleward advection of moist air. We account specifically for (1) evaporation at the ocean surface, (2) poleward transport, and (3) condensation-precipitation yielding snow formation in polar clouds. Points 1 and 2 are considerably simplified. Unlike GCM studies, we consider ide-
alized air masses isolated from the outside air for both ocean
evaporation and transport. We also simulate one single aver- age monthly precipitation, neglecting the fact that 6 in snow results from several distinct precipitation events, each having a different origin.
We want to make a preliminary study of the d-6 phase in Antarctica using a robust and inexpensive model to test several different sources of vapor. We used the 1-D model of Ciais and Jouzel [1994], where the amount of moisture in the cloud is controlled by a prescribed sequence of temperature and pres- sure. As the moist air "moves" poleward, it undergoes several condensation events and removals of the condensed phase by precipitation.
CIAIS ET AL.: ORIGIN OF ANTARCTIC PRECIPITATION 18,919 Deuterium -320 0 -360 -400 -440 _ • I ß I , I • I , I , I , I , I • I , I , I , i , 14 12 10 8 6 4 2 b Deuterium Excess Figure 1. Deulerium -150 -200 -250
•, . ß i i i i i i . . i i•. ß i
2 4 6 8 .10m deplh
10 8 6 4 2 0 c Deulerium Excess (continued)We deal with the vapor-liquid equilibrium until the temper-
ature is low enough to allow the formation of ice, typically
-5øC. At this point we let ice crystals and water droplets
coexist in the cloud down to -30øC. This coexistence occurs
because the vapor is supersaturated versus cloud ice and un-
dersaturated versus water [Mason, 1971]. Isotopically, we ac- count for additional kinetic fractionation during the growth of
ice crystals and the evaporation of liquid droplets [Jouzel and
Merlivat, 1984; Fisher, 1991; Ciais and Jouzel, 1994]. The mixed
cloud isotopic model (MCIM) has the advantage of suppress-
ing the discontinuity in the supersaturation function when ice
is formed, a necessary improvement for D47, although minor
for South Pole.
3.1. Vapor Formation
Following Merlivat and Jouzel [1979], we calculate /5 of the
initial
vapor
(/Sv0)
at the ocean
surface
after
Brutsaert
[1975],
the ocean composition/Sse a being inspired by Fisher [1992]:
• (• - •:)
1 +av = (1 +asea) (2)
0 Ote (1 - kh)
Three variables related at the ocean surface determine •iv0:
first, the sea surface temperature (SST = Te) contained in the
fractionation factor (ae from Majoube [1971]); second, the
10-m Wind speed w contained in the evaporation coefficient k; and third, the relative humidity above the ocean surface (h).
Note that when
h = 1, the initial
&v0
and excess
depend
on T•
only. We compiled monthly values of (T•, w, h ) from available global data sets. Despite constant updating, the data coverage of the southern high latitudes is limited. For instance, there are
no more than 1000 data in the Comprehensive Ocean-
Atmosphere Data Set (COADS) between 50øS and 60øS over
the past 30 years. We do not consider vapor formation in sea
ice areas, although strong evaporation may occur from polyn-
yas and contribute to precipitation near the coast [Barkov,
18,920 CIAIS ET AL.' ORIGIN OF ANTARCTIC PRECIPITATION 1.0 - 0.5 0.0 D47 Pit I ß
•l •I
I • I I • I l'•l:•
mo}nths :
1:3 1:5
l
1.0- 0.5 0.0South Pole Pit 1978
• 'i': '-' [ [ 1|: T-- I [ [ I I : 3 s •nonth• l!
•
ql I
:'ll W I I l•--I I I 11 13 15 17South Pole Pit 1984
ß scal_excess
1.0
i•.•p
n mq_, i I lill
E•]•': -•'"l•l• I I
D scal_deut
D D I[• I! Io.5 o o
)I • •0 0 I •.l
': • •
months
Figure 2. Average seasonality of 8D and d at South Pole and D47. The plot is constructed after the data shown in Figure 1. Both 8 and excess are scaled in the range [0, 1] in the 8 direction to present an idealized average year. The phase cor- responds to the average phase difference observed between
excess and 8.
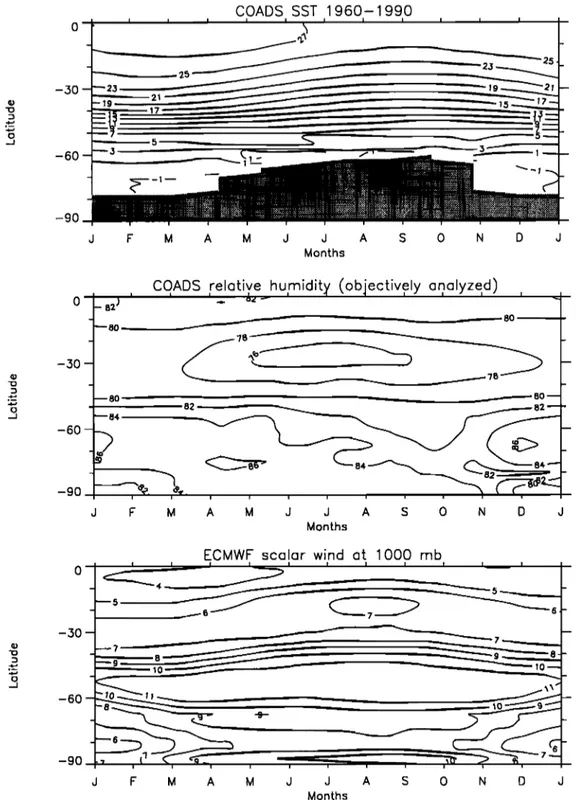
We use COADS climatology data for SST [Woodruff et al., 1987; Climate Research Program, 1985]. Commonly, SST de- creases poleward with a steep gradient across the polar front. From the 2 ø x 2 ø original data set, we made zonal averages every 10 ø latitude between 20øS and 60øS, plotted in Figure 3. The peak-to-peak amplitude of the zonally averaged SST is about 5øC north of 40øS but decreases to zero at high latitudes. Minimum SST occurs in August at 30øS and in October at 50øS. We use objectively analyzed wind data from the European Centre for Medium-Range Weather Forecasts (ECMWF) [Trenberth et al., 1989]. The zonally averaged wind increases poleward between 20øS and 40øS, then decreases south of 60øS. Figure 3 indicates maximum winds in winter. At around 50øS, the data show biannual maxima, with two peaks in March and October [Trenberth, 1975]. This feature, first discovered by Van Loon [1967], is likely overestimated in the ECMWF data be- cause of the scarcity of ship measurements in winter.
We use COADS relative humidity computed from dew point and air temperatures. Figure 3 plots the COADS data after objective analysis by Trenberth et al. [1989]. Low humidity char- acterizes the latitude 30øS, corresponding to the subtropical
high-pressure belt. Humidity increases poleward of 40øS, and the air above polar waters is close to saturation.
3.2. Poleward Transport
After evaporation, the moist air is lifted under a constant
vertical
temperature
gradient
(6.5øC
km-•) until the dew
point
is reached, then transported poleward to the ice sheet. In the MCIM model, each "air mass" is taken to be isolated from the outside air. The "transport" is controlled by the air mass temperature T, pressure P, and precipitation function. The precipitation function is adjusted to reproduce the ob- served d versus 8D in Antarctica [Petit et al., 1991; Qin et al., 1994]. To match this condition, precipitation must remove at least 90% of the condensed phase formed in the cloud, areasonable constraint in view of the low water contents
effectively found in polar stratiform clouds [Mason, 1971]. Isotopically, the removal of most of the condensed phase formed in the cloud means that the system is close to a Rayleigh distillation.
We compiled monthly T and P from several data sets (Fig- ure 4). First, between 20øS and 55øS we take COADS air temperature and sea level pressure. Second, from 60øS to 65øS, we likewise use monthly ground level T and P at Antarctic coastal stations averaged over the last 30 years [Jones and Imbert, 1987]. We exclude sites of the Antarctic peninsula, which has a distinct regional climate [Schwerdtferger, 1984], as well as P data from sites higher than 100 m above sea level. Third, for the South Pole runs only, we use T and P measured over the Ross Ice Shelf and West Antarctica by automatic weather stations [Sievers et al., 1986, 1987, 1988]. By forcing the model under zonal T and P, we do not account realistically for longitudinal patterns; i.e., we treat air masses that combine the average characteristics of several possible tracks over the ice sheet. Indeed, we made tests to verify that the simulated 8 at South Pole are not very sensitive to the specific track of the air
over West Antarctica.
3.3. Temperature Inversion and Height of Advection Over central Antarctica the cold dry surface air is often overlain by a warmer and moister layer. This phenomenon determines a positive upward temperature gradient, or tem- perature inversion [Dalrymple, 1966; Phillpot and Zillman, 1970]. The inversion is maximum in winter and almost disap- pears during the summer. In our model we assume that the air is advected preferentially in the inversion layer. We include the inversion based on vertical profiles obtained at South Pole and in West Antarctica [Schwerdtferger, 1970, 1984], assuming no inversion over sea ice (Figure 5). As the inversion temperature is determined by the energy budget of the inversion layer, where the radiative heat loss is compensated by vertical and horizontal motion, no additional radiative cooling of the air needs to be taken into account in our approach [Johnsen et al., 1989].
In the model, the moist air is advected poleward isobarically over the ocean, then according to a constant pressure differ- ence with the ice sheet surface. We adopt for (Pai ... -- Psurface) a value of 150 mbar, consistent with the hypothesis of air moving in the inversion layer. Although Petit et al. [1991]
have demonstrated that a value of 50 mbar does not affect the
modeled d and 8, we do not account for abrupt lifting of air parcels entering a cyclonic system or for local orographic lifting
CIAIS ET AL.: ORIGIN OF ANTARCTIC PRECIPITATION 18,921 COADS SST 1960-1990 • 23 25 -30
-60 |
'•-'•
•k
-1--
-90 J F M A M J J A S 0 N D J Months 0 -30 - -60 -90 I '--80 --COADS
I,reletive
.,,,,. • •hu,midit¾
(obiectiv,ely
en,
elyze,
d)
I• 80 • • 80 •
'"-
84
82
•
•
82
--"-
7
--
F M A M J J A $ 0 N O J
Months
ECMWF scolor wind et 1000 mb
-oJ
-60
9O
J F M A M J J A $ 0 N D J
Months
Figure 3. Latitude-time diagram of the parameters that control the formation of vapor and its isotopic
composition. The sea surface temperature (SST), relative humidity, and wind speed data are monthly zonal averages over 10 ø latitude bands (see text). Units are degrees Celsius for SST, percent for relative humidity,
and meters per second for wind speed above sea level.
4. Results and Discussion
4.1. Comparison of Model First-Stage Precipitation
With Sub-Antarctic Data
To evaluate the model predictions for early stages of con- densation, we selected sites from the worldwide (IAEA) net-
work: Pascua (Easter) Island (27øS), Gough Island (40øS),
Falkland Islands (52øS), and Argentine Island (64øS) [/AEA,
1981]. Figure 6 shows that except at Pascua, the excess varies in antiphase with 8, as was noticed previously by Johnsen et al.
[1989]. The data are compared with the model initial precipi-
tation in Figure 6. The model successfully reproduces d in
antiphase with 8, despite its simplified evaporation. On the
other hand, the model overestimates 8, possibly because the real world precipitation is not of strictly local origin as we assume in the model. Rather, it is probably formed from vapor
18,922 CIAIS ET AL.: ORIGIN OF ANTARCTIC PRECIPITATION ! •3 1030 E 1020 ß ß 1010 1000 990 980 970 960 95O ß 30 S o 35 S ; 40 S -• 45 S 50 S •o•55 S 60 S m.-65S -1050 3O:_
20
•e lO-950
3
o
-850 e
E - 1 0
20
-750 ..I -30 -40 -50 -- •---75S---+---908 '+ +-
+"+"+
0 2 4 6 8 10 12 0 2 4 6 8 1012 months months •5 15 25 35 -45 -55 -65Figure 4. Monthly temperature and pressure used to calculate •D and d in precipitation at South Pole and at D47. The model follows each monthly sequence of prescribed pressure and temperature. The data are a compilation of different meteorological data sets (see text). The temperature and pressure at South Pole station are on the right axis.
that has already undergone several condensations and hence is more depleted in heavy isotopes.
We run the model successively with different moisture sources, between 20øS and 60øS. The air advected poleward is condensed according to T and P compiled in section 3.2 until
the target site is reached. Monthly values of •D, •80, and d
have been calculated in that manner separately at South Pole
and D47.
4.2. Model Results at South Pole
The model curves of •D at South Pole are plotted in Figure 7. The simulated •D compare reasonably well with the obser- vations, except when the moisture comes from polar waters (50ø-60øS). The model curves of •D present a broad minimum
= at 600 mb. E 2 5 - = at 650 mb ß - 20- C.• 15- -•-- I O- E _ E 5- ½:: O- .o_ E O 6 12 18 24 months Figure 5. [nvcrsJon
scvcml years of in sffu radiosoundin• measurements (repeated identically over • years for clariS). The cu•cs plot the diScf- ence bc•ccn temperature at a •Jvcn height minus the value at •mund level, which is mu•hly at • mban •hc avcm•c bc- •ccn 55• mbar and
height proscribed in the model. Note a winter, which almost cancels out in summen
associated with the "coreless" polar winter, roughly between April and October [Van Loon, 1967]. The maximum in •D corresponds to the summer period, December to January, con- sistently with in situ measurements of •D in snowfall at South Pole [Aldaz and Deutch, 1967; Jouzel et al., 1983]. It is clear that •D mimics the in situ temperature course, with a short summer peak coming out of an eight-month-long winter. Our seasonal simulations thus support the idea that •D at South Pole is controlled primarily by local temperature, rather than by the air mass history or by the precipitation mechanism. The lati-
tude of the moisture source influences the model mean •D
values by up to a few tenths of a permil, polar sources yielding
to overestimate •D. The most realistic minimum and maxi-
mum •D in the model correspond to sources between 20 ø and 40øS. On the other hand, the phase of •D is practically inde- pendent of the source of vapor.
The model curves of excess in Figure 7 indicate that d is sensitive to the source. Moisture originating from higher lati- tudes with identical conditions in supersaturation yields lower annual mean excess (the model would even produce negative d when moisture comes from polar waters). We force the annual mean excess to match the observations by tuning the supersat- uration function Si, within the physical limits of saturation with respect to ice and saturation with respect to liquid water [Petit et al., 1991]. The values used for Si are given in Figure 7. We nevertheless verify that the phase between d and • is not sensitive to the supersaturation function we use, which makes the phase an independent criterion in selecting realistic mois- ture sources from the model curves in Figure 7. The phase
difference between d and •D is linked to the moisture source. A
source at 30øS yields the best agreement with the data, with a 3-month lag of d versus •D (d is maximum in fall and minimum in summer). A source located in polar areas, south of 40øS, yields a 6-month lag of d versus •D (d is maximum in winter and minimum in summer). A source near the coast (60øS) overesti- mates the minimum in d produced by the model.
CIAIS ET AL.: ORIGIN OF ANTARCTIC PRECIPITATION 18,923
Ppscua
Is.
27.2'S
I 20
0.7•model
30S--
= _--
•12
0.5
0.5
10
-
A A f
'
' I
' -6
18
I i i i i i / i i i i I 6
o
0 • 7.8]9
'
7.4
;,, ,,,
Argentine
Is.
64.3'S
-0.40
model
60S
•8
-8 2 -9 -0.50 7 -10
.o.o
:
I I I I I I I '1' I I I I 2 -0.70 1 2 3 4 5 6 7 8 9 101112 1 2 3 4 5 6 7 8 9 101112 monthsFigure 6. Model curves showing the 5•80 (squares) and deuterium excess (circles) of the first-stage pre-
cipitation in the model, compared with observations at maritime sites at corresponding latitudes of the
International Atomic Energy Agency network. The 6-month phase difference of d versus 5 is reproduced
correctly
by the model,
but 5•80 in the first-stage
precipitation
is overestimated
by the model (see text
for discussion).4.3. Model Results at D47
The model curves of 5D at D47 are shown in Figure 8. They show some similarities with the model results at South Pole, including maximum 5D in summer and minimum values in winter. However, the summer peak in 5D is larger for D47 than for South Pole because the summer is longer on the coast. When the source of moisture is set in subtropical waters (20 ø- 40øS), the mean 5D is 50%0 more negative than the data. The discrepancy is smaller if moisture comes from polar waters (50ø-60øS). Isotopically, the underestimation of 5D starting with a warm source may reflect an "overdistillation" of the air in the model, because air masses are considered as isolated systems from the evaporation to the polar precipitation.
Monthly excess simulated by the model at D47 is plotted in Figure 8. We tune the supersaturation function in the model to
obtain realistic annual mean values of the excess. In contrast to
South Pole, the tuning of the supersaturation at D47 has an effect on the d-5 phase: we observed that changing S i can shift d by up to 3 months with respect to 5. This means that the phase of d versus 5 also depends on the supersaturation func- tion near the coast. No fit of the supersaturation to the annual mean value of d at D47 was possible if the source is in polar waters at 50ø-60øS. In this latter case, the annual mean d is negative, whereas the observations indicate low but positive excess values. Considering the phase, if the moisture source is taken north of 40øS, the predicted excess tends to be in phase with 5D, hence producing a rather good agreement with the phase of the data. On the other hand, if the moisture derives from polar waters (50ø-60øS), the predicted excess is out of phase with 5D by up to 6 months.
18,924 CIAIS ET AL.: ORIGIN OF ANTARCTIC PRECIPITATION , -450 ... • ... • ... 0 0 6 12 18 24
-oo
30
S
-400 450 ... 0 6 12 18 24 15 10 -300- _ -350- . -400- _ -450 ß 0 40 S -15 ' ' ' ; ... • ... i ... 5 6 12 18 24 -300- -350- -400- . -450 0-2so- 60
S
-20
-
300- :•' :.:i!
/-
- 400
- :,,
??iii::11
•;:
i'.: :':
:'•':
- 0
-450 ... i ... • ... • ... O 6 12 18 24Figure ?. Model curves showing monthly 8D and excess in snowfall at South Pole. The black curve is 8D,
and the gray
curve
is excess
(SmO
has
exactly
the same
phase
as 8D). Each
plot corresponds
to a run with a
different moisture source latitude between 20øS and 60øS. The average model curve is repeated identically over 2 years for clarity. In each plot, the supersaturation of vapor with respect to ice ($i) is a linear function of the
temperature
at ground
level (Ta). These
functions
are determined
to yield the best
possible
fit to the annual
mean
excess
data.
The functions
used
are as follows:
20øS,
$i = 1.05 - 0.004]Ta; 30øS,
$• = 1.04 -
0.0040T•; 40øS,
$• = 1.02 - 0.0038T•; $0øS,
$• = 1.02 - 0.0020T•; and 60øS,
5• = 1.00 - 0.0015T•.
4.4. Discussion
A simple 1-D isotopic model is capable of reproducing the seasonality of aD and excess both inland and near the coast. Such a fair behavior of the model may be a consequence of a relatively simple moisture transport from the southern ocean
to Antarctica in the real world. Although 15D and 15•80 are
sensitive primarily to the temperature of precipitation, the second-order parameter d depends strongly on the source of moisture. As has been shown by previous modeling works, the annual mean value of d can always be adjusted to the obser-
CIAIS ET AL.: ORIGIN OF ANTARCTIC PRECIPITATION 18,925 -150- - -200- - -250- - -300- - -350 ß 0 20S [ [ , ! ! • [ 6 10 8 6 2 0 12 18 24
- 150- 30S
-200- _ -250- - -300- - -350 •o -150- o - .o_ -200 -250- • - '-- -300 r• 0 -100- _ -150- _ -200- _ -250- _ -300- -350 0 12 18 24 40S 6 12 18 24 50S 6 12 18 -12L1o
8 -4 -2 o [6 -4 -2 -0 -- 2 4 rn 6 • -6 24 -50- -100- _ -150- -200- -250- -300 0 60S --3 r-4 --- 5 m. 6 7 8 9 10 -11 12 18 24Figure 8. Same as Figure 7 for D47. No fit of the supersaturation function to the annual mean excess data was possible starting with moisture formed in polar water (50ø-60øS). In that case, we adopted the closest fit
to the data. The functions used are as follows: 20øS, Si = 1.05 - 0.0041Ta; 30øS, Si = 1.03 - 0.0020Ta;
40øS,
Si = 1.02 - 0.0020Ta; 50øS,
S• = 1.01 - 0.0010Ta; and 60øS,
S• = 1.00 - 0.0010T
a.
vations by playing on the supersaturation function. In contrast,the d-• phase relationship is less sensitive to the supersatura-
tion function than is the annual d value. Therefore we believe
that the phase is an independent constraint to infer the infor- mation on the vapor source contained in the excess.
In the case of South Pole, we find that the data are compat-
ible with a subtropical moisture source, located between 20øS and 40øS (Table 1). The phase between d and •D does not makes it possible to separate clearly one particular latitude, but the best agreement between model and data corresponds to a source at 30øS (d lagging • by 3 months). In summer a source in polar waters yields unrealistic low values of excess at South
18,926 CIAIS ET AL.: ORIGIN OF ANTARCTIC PRECIPITATION
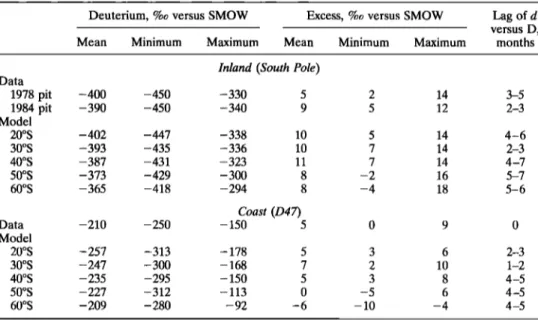
Table 1. Comparison of Observed and Modeled Deuterium D and Deuterium Excess d in Inland and Coastal Antarctic Precipitation
Deuterium, %0 versus SMOW Excess, %0 versus SMOW
Mean Minimum Maximum Mean Minimum Maximum
Lag of d
versus D,
months
Inland (South Pole)
Data 1978 pit -400 -450 -330 5 2 14 1984 pit -390 -450 -340 9 5 12 Model 20øS -402 -447 -338 10 5 14 30øS -393 -435 -336 10 7 14 40øS -387 -431 -323 11 7 14 50øS -373 -429 -300 8 -2 16 60øS -365 -418 -294 8 -4 18 Coast (D47) Data -210 -250 -150 5 0 9 Model 20øS -257 -313 -178 5 3 6 30øS -247 -300 -168 7 2 10 40øS -235 -295 -150 5 3 8 50øS -227 -312 -113 0 -5 6 60øS -209 -280 -92 -6 -10 -4 3-5 2-3 4-6 2-3 4-7 5-7 5-6 2-3 1-2 4-5 4-5 4-5
Pole. Yet it would be possible to match the South Pole data by setting moisture to originate from anywhere between 60øS and 30øS in winter but only from the sub-tropical oceans in summer.
The case of D47 is more complicated. The model/SD would favor a source in polar waters, which is excluded by the mod- eled excess. The pit isotope measurements could be matched by the model run with a subtropical vapor source (no phase lag of d versus /5), but only if additional moisture of local polar waters is added to the system. Nevertheless, the model curves for D47 must be taken cautiously because our model does not include the complex mechanism of precipitation near the coast due to strong orographic lifting of clouds. Cyclones formed at low latitudes and heading for Antarctica deliver significant amount of precipitation under storm events [Bromwich, 1988]. These storms, frequently breaking the winter inversion, are characterized by large supersaturations, which have the poten- tial to influence the value of the excess in snow [Fisher, 1991]. At face value, we believe from the present model curves that subtropical vapor must be a nonnegligible source of Antarctic precipitation near the coast.
A physical justification for the differences in d-/5 phase be-
tween inland and coastal zones involves the number of con-
densations having occurred in the air parcel since its evapora- tion. The kinetic fractionation for oxygen 18 being larger than for deuterium, after numerous condensations, the moist air is
relatively more depleted in 180 than it is in D. Therefore
conce13tually,
more condensations
produce
higher
d values.
This is already verified in the spatial distribution of excess (overall increase toward inland Antarctica), but we think that it also applies to the seasonality. In winter a larger temperature gradient prevails between ocean and inland Antarctica, which determines higher excess than during the summer. When nu- merous condensations are involved, this effect puts d in an- tiphase with/5, as it is the case in the real world at South Pole. Superimposed on this effect is the fact that d is teleconnected to the vapor source. Simple models indicate that the source temperature controls d at inland sites, whereas the source relative humidity dominates near the coast. Indeed we find that second-order changes in the phase lag of d versus/5 at SouthPole (3 months with a source at 30øS versus 6 months with a source at 60øS) reflects the observed patterns of SST in the southern ocean. For D47, the lack of monthly relative humidity data at sub-Antarctic latitudes prevents us from concluding that d is similarly controlled by the seasonal phase of the relative humidity.
5. Conclusions
We have examined the seasonality of deuterium, oxygen 18, and deuterium excess in Antarctic snow, using data from two snow pits at D47 (near the coast) and South Pole (inland). Near the coast the excess varies in phase with/5, but inland, d lags /5 by approximately 6 months. To gain understanding of this behavior, we have modeled the monthly isotopic compo- sition of snow in a 1-D model parameterized by the tempera- ture and pressure history of moist air from the vapor source to the ice sheet. The model also includes monthly modifications in the evaporative source, which further influence d in Antarc- tic snow. We have made several test cases where the precipi- tation is derived from a single evaporative source located be-
tween 20øS to 60øS. The contribution of each latitude is
examined separately, as no mixing is allowed.
The model simulations are compared with the data, both for the annual mean values of/5 and excess and for the d-/5 phase.
In the interior of Antarctica we obtain a reasonable fit with the
observations with a source between 20øS and 40øS, which sug- gests that polar waters may be a poor contributor to the mois- ture supply of the interior. Near the coast, we also infer a dominant moisture source in subtropical ocean gyres, but the model may not treat correctly local contributions to storm precipitation. Our results support the study of Koster et al. [1992] who find in the Goddard Institute for Space Studies GCM that interior regions of Antarctica have a warm moisture source. Using a more sophisticated model, we also confirm a similar conclusion of Petit et al. [1991] of the spatial distribu- tion of the mean excess in polar snow.
Generally, a better understanding of the present-day excess is necessary to use long time series in ice cores as a proxy of
CIAIS ET AL.: ORIGIN OF ANTARCTIC PRECIPITATION 18,927
changing vapor source in the past. In this work we have shown that in addition to the annual mean excess, the d-• phase contains important information that can also help to validate
further GCM simulations of the global HDO and H2•80 cy-
cles. An appropriate mean of gaining further insights on the deuterium excess in polar regions would require to examine the d-• phasing as well as the annual mean excess in a transect of snow pits going from the coast to the interior. Such a project can be addressed in the framework of planned glaciological
traverses in Antarctica.
References
Aldaz, L., and S. Deutch, On a relationship between air temperature and oxygen isotope ratio of snow and firn in the south pole region,
Earth Planet. Sci. Lett., 3, 267-274, 1967.
Barkov, N., Coastal climate of the Antarctic continent, in Ice Shelves of Antarctica, edited by E. S. Korotkevitch, Gidrometeorolorogia, St.
Petersburg, Russia, 1985.
Bromwich, D. H., Snowfall in high southern latitudes, Rev. Geophys.,
26, 149-168, 1988.
Brutsaert, W. A., Theory for local evaporation (or heat transfer) from
rough and smooth surfaces at ground level, Water Resour. Res., 11,
543-550, 1975.
Ciais, P., and J. Jouzel, Deuterium and oxygen 18 in precipitation: An
isotopic model including mixed cloud processes, J. Geophys. Res., 99,
16,793-16,803, 1994.
Climate Research Program, Comprehensive Ocean-Atmosphere Data
Set, release 1, Environ. Res. Lab., Boulder, Colo., 1985.
Craig, H., Isotopic variations in meteoric waters, Science, 133, 1702-
1703, 1961.
Dalrymple, P. C., A physical climatology of the Antarctic plateau, in
Studies in Antarctic Meteorology, Antarc. Res. Ser., vol. 9, edited by
M. J. Rubin, pp. 195-231, AGU, Washington, D.C., 1966.
Dansgaard, W., Stable isotopes in precipitation, Tellus, 16, 436-468,
1964.
Enomoto, H., and A. Ohmura, Open water and the circumpolar trough
in the Antarctic, Proc. NIPR Symp. Polar. Meteorol. Glaciol., 5, 104-
112, 1992.
Fisher, D. A., Remarks on the deuterium excess in precipitation in cold
regions, Tellus, Ser. B, 43, 401-407, 1991.
Fisher, D. A., Stable isotope simulations using a regional stable isotope model coupled to a zonally averaged global model, Cold Reg. Sci.
Technol., 21, 61-77. 1992.
International Atomic Energy Agency (IAEA), Statistical Treatment of
Environmental Isotope Data in Precipitation, Tech. Rep. Ser. IAEA,
206, 1-256, 1981.
Johnsen, S. J., Stable isotope homogeneisation of polar snow and ice, Isotopes and impurities in snow and ice, IAHS Publ., 118, 210-218,
1977.
Johnsen, S. J., W. Dansgaard, and J. W. White, The origin of Arctic precipitation under present and glacial conditions, Tellus, 41, 452-
469, 1989.
Jones, P. D., and D. W. S. Imbert, A data bank of Antarctic surface
temperature and pressure data, Rep. DOE/ER/60397-H2 TR038, Off. of Energy Res., Carbon Dioxide Res. Div., U.S. Dep. of Energy, Washington, D.C., 1987.
Jouzel, J., and L. Merlivat, Deuterium and oxygen 18 in precipitation:
Modeling of the isotopic effects during snow formation, J. Geophys.
Res., 89, 11,749-11,757, 1984.
Jouzel, J., L. Merlivat, and C. Lorius, Deuterium excess in an East Antarctic ice core suggests higher relative humidity at the oceanic surface during the last glacial maximum, Nature, 299, 688-691, 1982. Jouzel, J., L. Merlivat, J. R. Petit, and C. Lorius, Climatic information
over the last century deduced from a detailed isotopic record in the
South Pole snow, J. Geophys. Res., 88, 2693-2703, 1983.
Jouzel, J., G. L. Russell, R. J. Suozzo, R. D. Koster, J. W. C. White,
and W. S. Broecker, Simulations of the HDO and H2•80 atmo- spheric cycles using the NASA/GISS general circulation model: The seasonal cycle for present-day conditions, J. Geophys. Res., 92,
14,739-14,760, 1987.
Koster, R. D., J. Jouzel, R. J. Suozzo, and G. L. Russel, Origin of July Antarctic precipitation and its influence on deuterium content: A
GCM analysis, Clim. Dyn., 7, 195-203, 1992.
Majoube, M., Fractionnement en Oxyg•ne 18 et en deut6rium entre l'eau et sa vapeur, J. Chim. Phys. 10, 1473, 1971.
Mason, B. J., The Physics of Clouds, Oxford Univ. Press, New York,
1971.
Merlivat, L., and J. Jouzel, Global climatic interpretation of the deu- terium-oxygen 18 relationship for precipitation, J. Geophys. Res., 84,
5029-5033, 1979.
Parish, T., and G. Wendler, The katabatic wind regime at Ad61ie Land, Antarctica, Int. J. Climatol., 11, 91-107, 1991.
Petit, J. R., J. W. White, N. W. Young, J. Jouzel, and Y. S. Korot- kevitch, Deuterium excess in recent Antarctic snow, J. Geophys. Res., 96, 5113-5123, 1991.
Pettre, P., J. F. Pinglot, M. Pourchet, and L. Reynaud, Accumulation distribution in Terre Ad61ie, Antarctica: Effect of meteorological
parameters, J. Glaciol., 32, 486-500, 1986.
Phillpot, H. R., and J. W. Zillman, The surface temperature inversion
over the Antarctic continent, J. Geophys. Res., 75, 4161-4169, 1970. Qin, D., J. R. Petit, J. Jouzel, and M. Stievenard, Distribution of stable
isotopes in surface snow along the route of the 1990 international Trans-Antarctica expedition, J. Glaciol., 134, 107-118, 1994.
Schwerdtferger, W., The climate of the Antarctic, in Climate of the Polar Regions, World Surv. of Climatol., vol. 14, edited by S. Orvig,
Elsevier, New York, 1970.
Schwerdtferger, W., Weather and Climate of the Antarctic, Dev. Atmos.
Sci., vol. 15, Elsevier, New York, 1984.
Sievers, M. F., G. A. Weidner, and C. R. Stearns, Automatic Weather Station Data for the Calendar Year 1985, Univ. of Wis., Madison,
1986.
Sievers, M. F., G. A. Weidner, and C. R. Stearns, Automatic Weather
Station Data for the Calendar Year 1986, Univ. of Wis., Madison,
1987.
Sievers, M. F., G. A. Weidner, and C. R. Stearns, Automatic Weather Station Data for the Calendar Year 1987, Univ. of Wis., Madison,
1988.
Trenberth, K. E., A quasi-biennial standing wave in the southern hemisphere and interrelations with sea surface temperature, Q. J. R.
Meteorol. Soc., 101, 55-74, 1975.
Trenberth, K., J. Olson, and W. G. Large, A global ocean wind stress climatology based on ECMWF analyses, NCAR Tech. Note 338, Natl. Cent. for Atmos. Res., Boulder, Colo., 1989.
Van Loon, H., The half-yearly oscillations in middle and high southern
latitudes and the coreless winter, J. Atmos. Sci., 24, 472-486, 1967.
Whillans, I. M., Effect of inversion winds on topographic details and
mass-balance on inland ice sheets, J. Glaciol., 14, 85-90, 1975.
Whillans, I. M., and P.M. Grootes, isotopic diffusion in cold snow and
firn, J. Geophys. Res., 90, 3910-3918, 1985.
Woodruff, S. D., R. J. Slutz, R. L. Jenne, and P.M. Steurer, A Com-
prehensive Ocean-Atmosphere Data Set, Bull. Am. Meteorol. Soc.,
68, 1239-1249, 1987.
P. Ciais and J. Jouzel, Laboratoire de Mod61isation du Climat et de l'Environnement, Bfitiment 709, L'Orme des Meurisiers, Centre Saclay,
91191 Gif sur Yvette, France. (e-mail: ciais@bøfix'saclay'cea'fr') J. R. Petit, Laboratoire de Glaciologie et de G6ophysique de
l'Environnement, B.P. 76, 38600 St. Martin d'H•res, France.
J. W. C. White, Stable Isotope Laboratory, Institute of Arctic and Alpine Research, Campus Box 450, University of Colorado, Boulder,
CO 80309.
(Received February 3, 1994; revised January 19, 1995; accepted February 21, 1995.)


![[PDF] Cours sur les fonctions en C++ | Cours informatique](data:image/gif;base64,R0lGODlhAQABAIAAAP///wAAACH5BAEAAAAALAAAAAABAAEAAAICRAEAOw==)