Assessing Byproduct Mining and Metal Recycling as
Indicators of Material Criticality
MASSACHUSETTS INSTITUTE
by
OFTECHNOLOGYSEP 12 2019
Xinkai Fu
LIBRARIES
B.S. Physics, Nanjing University (2014)
ARCHIVES
Submitted to the Department of Materials Science and Engineering
in Partial Fulfillment of the Requirements for the Degree of
Doctor of Philosophy
at the
MASSACHUSETTS INSTITUTE OF TECHNOLOGY
©2020Massachusetts Institute of Technology. All rights reserved
Signature redacted
Signature of Author:
Department of Materials Science and Engineering
X)
Aiugust 30, 2019
Signature redacted
Certified by:
ElcA AIi-t;
Atlantic
Richfiel9d
ciate Professor of
Energy
Studies
Signature redacted
Thesis Supervisor
Accepted by:
Donald R. Sadoway
ZJohn
F. Elliott Profess rof Materials Chemistry
Chair, Departmental Committee on Graduate Students
77 Massachusetts Avenue Cambridge, MA 02139 http://Iibraries.mit.edu/ask
DISCLAIMER NOTICE
Due to the condition of the original material, there are unavoidable
flaws in this reproduction. We have made every effort possible to
provide you with the best copy available.
Thank you.
The images contained in this document are of the
best quality available.
Assessing Byproduct Mining and Metal Recycling as Indicators
of Material Criticality
by
Xinkai Fu
Submitted to the Department of Materials Science and Engineering
On August 30, 2019 in Partial Fulfillment of the Requirements
for the Degree of Doctor of Philosophy in Materials Science
ABSTRACT
The development of advanced technologies relies on using a
broader suite of elements from the
periodic table, and many agree that the future availability of a
set of 'critical materials' is an issue
of global concern. However, assessments of material criticality are often overly general, leading
to excessive concerns by policy makers and market participants.
A
quantitative and detailed
investigation for supply risk indicators is necessary to further understand the risk associated with
specific materials. This thesis investigates two aspects related to material criticality: 1) the status
of a
metal being produced as a
byproduct; 2) The market impact of increased
metal
recycling.
To identify the type of major risks associated with a
byproduct metal, a
techno-economic analysis
is performed on 42 carrier-byproduct metal pairs, by employing cluster analysis and econometric
modelling. Contrary to conventional view, it is found in several case studies that the availability
of
a
byproduct metal is not directly limited by carrier supply, but rather limited by the lack of
incentive to improve recovery efficiencies. Therefore, developing alternative extraction
processes with high recovery rate is proposed as
a
mitigation strategy for byproduct metals. The
economic feasibility of such processes is examined, first in
a
screening assessment and then in
a
detailed case study for extracting indium as byproduct of zinc. It is demonstrated that an
alternative process could significantly increase byproduct supply, by up to 10% in the case of
indium.
A
bottom-up copper market simulation system is developed by modeling the behaviors of market
participants, to estimate the market impact of increased metal recycling. Results from the
simulation demonstrates the existence of various rebound effects for primary copper production.
Depending on the size and duration of secondary supply shocks, these rebound effects can offset
50% to 90% of the environmental benefits of recycling. In terms of carrier recycling impacting
byproduct supply, it is shown that recycling as carrier metal supply risk mitigation strategy would
not significantly hurt the availability of byproduct metal.
Thesis Supervisor: Elsa A. Olivetti
Acknowledgement
I
wish to express my deepest gratitude to my advisor Professor Elsa Olivetti at the beginning of this thesis. Five years ago, you led me into an exciting research area that 1, a clueless new college grad, had never heard of. I could not imagine how I would have spent these five years without your unwavering support, both academically and mentally. Thank you for the countless hours you spent on guiding and motivating me, without which this thesis would not be possible. You are more than the best advisor I could ever ask for.I would like to extend my thanks to Professor Donald Sadoway and Professor Antoine Allanore, the other two members of my thesis committee. They have provided critical and insightful feedback along the way, which helped me greatly improve this thesis. In particular, discussions with Professor Allanore on metal extraction processes have enabled the development of Chapter 4 of this thesis. Although not listed as a
committee member, Dr. Richard Roth played an important role in the completion of this thesis. His profound knowledge and deep insights of the copper industry have helped me refine the copper market simulation model introduced in Chapter 5.
Many other individuals have helped with the development of this thesis. In the limited space here, I would like to thank Dr. Randolph Kirchain, Dr. Frank Field, Dr. Omar Swei, Dr. Jingshu Zhang, and Karan Bhuwalka from the Materials Systems Laboratory at MIT; And Dr. Stian Ueland, Dr. Jiyoun Chang, Dr. Jonathan Krones, John Ryter, Adriano Polli and Nagisa Tadjfar from the Olivetti Group. Many of my friends both from and out of MIT have provided me tremendous mental support, particularly my lab mates in the Olivetti Group and friends from the MIT Chinese Entrepreneurs Association. I would also like to thank Kathrine Simons and Terra Cholfin for providing logistical support during my years as a PhD student. Also, this thesis is impossible without the financial support from the National Science Foundation.
I am forever indebted to my parents. Without their support, I couldn't have pursued studies in a foreign country in the first place. Their encouragement and understanding have also given me courage and
motivation at moments of frustration.
Last but not least, not a single word can express my feelings for my life partner, my 'bwado', Yidan.
Meeting you was the best thing that happened to me in my time at MIT, and I could not imagine what life would be without you. Thank you for all the time you stood by me, and for all the joy you brought to my life. The completion of this thesis marked an important chapter in my life, and I dedicate it to you. I can't wait to open a new life chapter together with you.
Table of Contents
Abstract3... 3
Acknow ledgem ent ... 4
List of Figures ... 7
List of Tables ... 10
Chapter 1: Introduction ... 12
Increasing use of m aterials and availability concerns ... . 12
Long term concerns ... 14
Short term concerns ... 15
Supply risk m itigation strategies...17
Prim ary supply strategies... 17
Secondary supply strategies ... 18
Dem and side strategies... 20
Thesis overview ... 20
Chapter 2: Literature Review ... 23
A brief overview of m aterial criticality... 23
M aterial criticality and byproduct m etals... 27
Risk m itigation, recycling and displacem ent... 28
Research gaps and thesis contributions ... . 31
Chapter 3: Quantifying Availability Risk for By-Product Metals from Primary Production ... 32
Classification of Carrier-Byproduct System s ... . 32
M ethodology... 32
Data analysis and results... 37
Developing criticality indicators... 39
Price elasticity of supply ... 39
Supply potential... 43
Case study on the zinc-indium system ... 43
Case study on the copper-selenium system ... . 47
Case study on the zinc/coal-germ anium system ... 51
Using supply potential as a screening tool ... 54
Conclusions ... 55
M otivationforalternativeprocess... 56
Screening assessment for econom ic feasibility ... 57
Casestudyonindium ... 60
Description of alternative extraction process...64
Costm odelforalternative process ... 68
Deposit level analysis ... 73
Conclusions ... 76
Chapter 5: Displacement Potential and Market Impact of Metal Recycling, Case Study on Copper...78
BackgroundandM otivation ... 78
M ethodology for displacem ent estimation ... 79
Introduction of fram ework...79
Prim ary supply m odule...81
Scrapsupply m odule...100
Demand module ... 108
Refinery module...112
Sem is module...118
Price form ation m odule ... 124
System evolution... 136
Results from baseline scenario ... 139
Prices...139
Production and consumption ... 142
Estim atingdisplacem ent...145
Sensitivity of displacem ent rate to baseline system parameters ... 152
Im pactonbyproducts ... 156
Im pact on cobalt ... 156
Im pact on selenium and tellurium ... 160
Conclusion...164
Chapter 6: Concluding Rem arks ... 167
Conclusions and contributions...167
Lim itationsand future work...169
References... 170
List of Figures
Figure 1. 1 The growth of elements required in computer chips in the two decades from 1980 to 2000,
reproduced from (U.S. National Research Council, 2008)... 13
Figure 1. 2 Inflation adjusted metal prices (2017 constant USD/t) for copper, lead, zinc (left figure), aluminum, nickel and tin (right figure) during 1900 to 2015... 15
Figure 1. 3 Common byproducts of major metals including tin, aluminum, zinc, lead, copper, platinum and nickel (adapted from (Hageluken & M eskers, 2010))... 17
Figure 1. 4 Estimates for global average EOL-RR for 60 elements. Reproduced from (Reck and Graedel, 2 0 12 )...19 Figure 1. 5 Visualization of thesis structure (Chapter 3 to Chapter 5) ... 21
Figure 2. 1 The 'criticality matrix' for 13 metals, reproduced from (U.S. National Research Council, 2008) ... 2 4
Figure 3. 1 Flowchart of methods for classification and econometric assessment... 33 Figure 3. 2 Classification results of carrier-byproduct pairs. Each big shaded ellipse represents a different cluster, and each small ellipse reflects the uncertainty with respect to byproduct fraction and value ratio of each pair. Size of the circles represents 2015 production size of the byproduct metal. The byproduct
metals marked in green are important metals for the energy industry... 38 Figure 3. 3 Flowchart for the econometric assessment ... 40
Figure 3. 4 Illustration of supply shifter in supply and demand model ... 42
Figure 3. 5 Times series of indium supply (SIn), indium price (PIn) and upper/lower limit of supply potential from zinc (SPZn, u/i). Values of supply and supply potential are in metric tonnes (left axis) and values of prices are in USD/kg (right axis). ... 45 Figure 3. 6 Value of metal content in ore for 71 deposits, in dollars per ton. Ore grade data is primarily based on Werner et al. (Werner et al., 2017). Data from two other studies for the Huari Huari deposit (Ishihara, Murakami, & Marquez-Zavalia, 2011), the Dulong deposit and the Dachang deposit (Ishihara,
M urakam i, & Li, 2011) are also used. ... 46
Figure 3. 7 Times series of selenium supply (SSe), selenium price (PSe) and supply potential from copper (SPCu). Values of supply and supply potential are in metric tonnes (left axis) and values of prices are in U SD/kg (right axis). ... 50
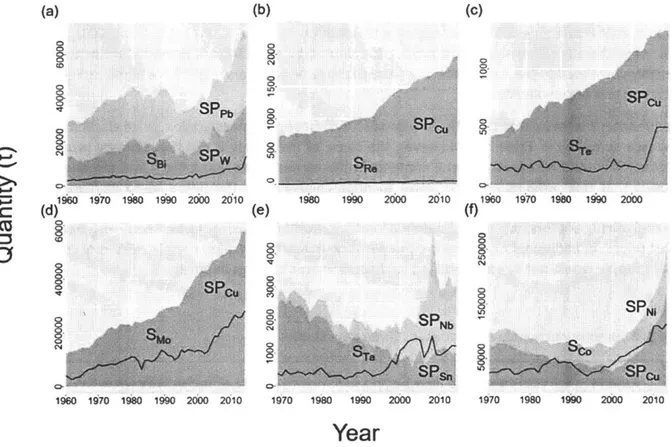
Figure 3. 8 Times series of selenium supply (SGe), selenium price (PGe) and supply potential from coal (SPCoal) and zinc (SPZn). Values of supply and supply potential are in metric tonnes (left axis) and values of prices are in USD/kg (right axis). All values are shown in logarithmic scales...52 Figure 3. 9 Comparison of actual byproduct metal supply (Sbyproduct) represented by green curves and supply potential from carrier (SPcarrier) represented by shaded regions, for 6 byproduct metal (9 carrier-byproduct pairs) in the intermediate-byproduct clusters. (a) Lead-bismuth and tungsten-bismuth;
(b) Copper-rhenium; (c) Copper-tellurium; (d) Copper-molybdenum; (e) Niobium-tantalum and
Figure 4. 1Violin plot of the distribution of economic feasibility indicators, for six byproduct metals. Y-axis
is represented in logarithm ic scales... 59
Figure 4. 2 Simplified flowchart of current indium extraction process as byproduct from zinc production. Yellow boxes are used for materials, blue box for processing steps and green boxes for processing facilities ... 6 1 Figure 4. 3 Kellogg diagram of the Zn-S-O and the In-S-O systems, at constant temperature 1300K. Zinc phase are separated by black solid lines and indium phases by dashed blue lines. The red dashed line represents the relationship PSO2 + P02 = 0.21 atm. ... 63
Figure 4. 4 Simplified flowchart of alternative indium extraction process. Yellow boxes are used for materials, blue box for processing steps and green boxes for processing facilities...65
Figure 4. 5 Standard Gibbs free energy of reaction for the direct carbothermic reduction reaction: MS + CaO +C = M + CaS + CO. Reaction at 900K is highlighted with a red dashed line...67
Figure 4. 6 Total cash margin and fraction of revenue from indium underthe proposed alternative process, for 69 indium deposits from Werner et al. (Werner et al., 2017) ... 74
Figure 5. 1 Framework of the simulation system. Semis = semi-finished products ... 80
Figure 5. 2 (a) Simulated cash flow and (b) Mining production in Maya's mine life ... 92
Figure 5. 3 Sensitivity of mine life IRR to long term copper price forecast. The blue dashed line represents the 15% cutoff... 93
Figure 5. 4 Historical mining production and future simulated production...96
Figure 5. 5 Historical copper cathode price (black line) and future price scenarios, in 2017 constant USD/t ... 9 7 Figure 5. 6 Historical average ore grade (black solid line) and simulated future ore grade under five price scenarios show n in Figure 5.5... 98
Figure 5. 7 Historical copper mining production (black solid line) and simulated future mining production under five price scenarios show n in Figure 5.5. ... 99
Figure 5. 8 Structure of the global copper flow model reproduced from (Gloser et al., 2013)...101
Figure 5. 9 Historical old scrap supply by waste type, calculated based on Equations 5.12 to 5.15 ... 104
Figure 5. 10 Historical total scrap supply and consumption ... 107
Figure 5. 11 Historical copper mining production and demand, and future simulated values under five price scenarios show n in Figure 5.5...112
Figure 5. 12 World refinery capacity and production from 1992 to 2016 from SNL (S&P Global Market Intelligence, 20 19b) ... 113
Figure 5. 13 Historical cathode production and consumption data ... 120
Figure 5. 14 World copper inventory from ICSG and its seasonal decomposition ... 126
Figure 5. 15 Simplified old scrap supply chain structure. Small yards are highlighted because it is believed to be the bottleneck for old scrap supply ... . ... 130
Figure 5. 16 Historical prices of copper cathode, Barley and Birch ... 132
Figure 5.17 Historical spread calculated as difference between nominal value and consumer buying price, for four grades of alloyed scrap ... 135
Figure 5. 18 Historical and simulated copper cathode price in 2017 constant USD/t ... 140
Figure 5. 19 Historical and simulated annual TCRC price in 2017 constant USD/t...141
Figure 5. 20 Historical and simulated Birch spread in 2017 constant USD/t...142
Figure 5. 22 Historical and simulated copper cathode production and consumption in kt...143
Figure 5. 23 Historical and simulated copper scrap supply and consumption in kt ... 144
Figure 5. 24 Simulated direct melt scrap consumption breakdown in kt...145
Figure 5. 25 Displacement rate under different duration of marginal shocks ... 147
Figure 5. 26 Displacement rate under different size of shocks ... 149
Figure 5. 27 Cathode price evolution under different size of temporary shocks (2019 only)...149
Figure 5. 28 Mining production reduction from the baseline, for different size of temporary shocks (2019 o n ly ) ... 15 0 Figure 5. 29 Mining production reduction from the baseline, for different size of permanent shocks (2019 o n ly) ... 1 5 1 Figure 5. 30 Sensitivity of displacem ent rate to M PE ... 153
Figure 5. 31 Sensitivity of displacem ent rate to SREs... 154
Figure 5. 32 Sensitivity of displacem ent rate to DEs ... 155
Figure 5. 33 Sensitivity of displacem ent rate to SSDE ... 155
Figure 5. 34 Modeled cobalt mining production between 2015 and 2030 by primary metals, reproduced from (Beatty et al., 2019)... 157
Figure 5. 35 Cobalt mining production reduction from the baseline, under four different scenarios described in Figure 5.29 ... 159
Figure 5. 36 Copper cathode price evolution under different size of permanent shocks...160
Figure 5. 37 Primary copper refined production reduction from the baseline, for different size of perm anent shocks... 161
Figure 5. 38 Selenium production and supply potential history and future scenarios ... 163
List of Tables
Table 2. 1 Country-level supply risk indicators used in 25 criticality studies between 2006 and 2018, and
their frequencies of use. Studies prior to 2011 are based on (Achzet & Helbig, 2013) ... 25
Table 3. 1 Metrics for assigning uncertainty scores to value ratios of carrier-byproduct pairs...36
Table 3. 2 ARDL model results for zinc-indium case study ... 44
Table 3. 3 Summary of key statistics of 71 indium deposits. Ore grade data is primarily based on Werner et al. (W erner et al., 20 17)... 47
Table 3. 4 ARDL model results for copper-selenium case study ... 48
Table 3. 5 OLS model results for zinc/coal-germanium case study ... 51
Table 3. 6 Summary of supply elasticities for three case studies...53
Table 4. 1 Sources and methods for obtaining/calculating distribution of metal concentration in ore, for six byproduct m etals...58
Table 4. 2 Melting point and boiling point of metal elements in the sphalerite. Cells highlighted in light yellow color indicate metals that melts at 900K, the proposed reaction temperature...67
Table 4. 3 Description of variables used in Equation 4.4 to 4.7 ... 70
Table 4. 4 Sensitivity analysis results on the amount of indium (kt) in economically feasible deposits....75
Table 5. 1 Description and values of operating characteristics for a hypothetical mine ... 82
Table 5. 2 Summary statistics for regression in Equation 5.11...89
Table 5. 3 Sensitivity of mine closure related mine properties to long term copper price forecasts...93
Table 5. 4 Variables and parameters used in the scrap supply module, their symbols, timeframe and so urces of d ata ... 10 1 Table 5. 5 Technical recycling efficiency and collection rate by waste type ... 103
Table 5. 6 Demand volume indicators for each end-use sector and respective data sources...108
Table 5. 7 Mean and standard deviation of intercepts and elasticities estimated from Bayesian regression m od e ls...110
Table 5.8 Projection methods for demand volume indicators for each end-use sector...111
Table 5. 9 Data used in the refinery module, time frame and data sources...114
Table 5. 10 Summary statistics for regression in Equation 5.24...115
Table 5. 11 Summary statistics for regression in Equation 5.25...115
Table 5. 12 Summary statistics for regression in Equation 5.26...116
Table 5. 13 Semis classified based on ICA classification, by fabricator and alloyed/unalloyed ... 118
Table 5. 14 Description of variables used in the blending optimization model ... 123
Table 5. 15 Summary statistics for regression in Equation 5.40...126
Table 5. 16 Summary statistics for regression in Equation 5.41...129
Table 5. 17 Summary statistics for regression in Equation 5.45...133
Table 5. 18 Summary statistics for regression in Equation 5.46...133
Table 5. 19 Summary statistics for regression in Equation 5.47...135
Table 5. 21 Opportunity for increase in old scrap supply by waste type ... 148 Table 5. 22 Comparison of cumulative scrap supply increase, cumulative mining production reduction and displacement rate at 2040 for shocks with different durations and sizes...151 Table 5. 23 Comparison of cumulative scrap supply increase, cumulative mining production/primary refined production reduction and displacement rate at 2040 for permanent shocks with different sizes ... 1 6 2
Table 5. 24 Example system parameters and their respective direct impacts on the system if the initial values are higher than baseline ... 165
Chapter 1: Introduction
Acknowledgement: Portions of this chapter are based on 1) A 2017 publication by Fu et al. in Journal of
Industrial Ecology, titled High-Resolution Insight into Materials Criticality: Quantifying Riskfor By-Product Metals from Primary Production (Fu, Polli, & Olivetti, 2018); 2) A work by Fu et al. submitted to Environmental Science and Techonology in 2019, titled Supply Perspectives on Cobalt in the Face of Changing Demand (Fu et al., 2019)
Given advanced technologies dependence on a broad suite of materials, we must develop measures to quantify the supply risk associated with that reliance, so that robust strategies can be developed to mitigate that risk.
Increasing use of materials and availability concerns
The development of human civilization is marked by increasingly sophisticated metals use. Copper is the first metal to be discovered and has been used in human societies since 9000 BC (Copper Development Association, 2019b). It is one of the few metals that occur in its native metallic form in nature, making it possible to be worked into other shapes without being smelted. Copper smelting and alloying innovation marked the end of the Stone Age and the beginning of Bronze Age around 3300 BC (Von Erdberg, 1993). The Bronze Age was followed by the Iron Age around 1200 BC, during which tools and weapons made with iron and steel outperformed their bronze counterparts (Milisauskas, 2002). In addition to copper and iron, there are five other metals of antiquity that have been discovered and widely used by humans in prehistoric times, including lead, tin, mercury, silver and gold (Smith & Forbes, 1957). These were the only seven elemental metals found until the discovery of arsenic in the 1 3th century (Smith & Forbes, 1957).
The 1 9th and 2 0th centuries brought an explosion of metal development and use. Metals have become indispensable components in engineering applications, such as automobiles, electrical appliances, and building construction (Gramatyka, Nowosielski, & Sakiewicz, 2007; Kapur & Graedel, 2006; Shinjoh, 2006). To meet increased demand due to population growth, industrialization and urbanization, the extraction of metal minerals increased nearly 19-fold from 1900 to 2005 (Krausmann et al., 2009). This increase has been driven by the need for not only larger quantities of the same materials, but also the need for a larger fraction of metal elements in the periodic table (T. E. Graedel & Cao, 2010). For example, based on a
report from the U.S. National Research Council ((U.S. National Research Council, 2008), see Figure 1.1), the growth of computer chip technology has led to a dramatic increase in the number of elements needed in the two decades from 1980 to 2000 from 12 elements to 60 two decades later.
+45 elements (potential)
Figure 1. 1 The growth of elements required in computer chips in the two decades from 1980 to 2000, reproduced from (U.S. National Research Council, 2008)
Due to the fast growth of metal demand in terms of both quantity required and the variety of elements required, there has been an increasing attention to resource availability in the last two decades. Governments, resource economists, geologists, manufacturers, and other metal market participants have raised concerns about whether future metal supply would meet expectations for demand (Duclos, Otto, & Konitzer, 2010; Prior, Giurco, Mudd, Mason, & Behrisch, 2012; U.S. National Research Council, 2008; Yaksic & Tilton, 2009). Factors contributing to these availability concerns have been systematically studied in the field of material criticality, which will be reviewed in detail in Chapter 2. However, frequently these studies are overly general leading to unnecessary hype and overreaction by actors in the system. Instead assessing materials availability requires nuanced appreciation of supply chain dynamics and meticulous treatment of technology opportunities and social actors in the system. This thesis aims to provide a
reasoned approach to understanding two aspects of materials availability: whether a metal is mined as a
byproduct of a more major metal, and what are the market impacts of increased recycling activities. One important illustration of the need for more nuanced treatment of availability is that these concerns have temporal dimension, and they could either be long-term concerns or short-term concerns. Long-term concerns are about the ultimate depletion of metals from the earth's crust if more is needed than available. The remaining metal resources would be that currently circulating in the anthrosphere, such as metals recovered from end-of-life sources.
Long term concerns
Researchers and geologists have used the static depletion indexto quantify how fast the mineral resources of a metal might be depleted in the future. This index is often calculated as the ratio between reserves and the current annual primary production. For many metals, this index is calculated to be less than 50 years (Alonso, 2010), indicating that metal reserves might be depleted fairly soon if current production trend continues. However, this metric is limited because reserves are a function of economics, rather than an absolute geologic constraint: based on the definition from U.S. Geological Survey (USGS), reserve is 'that portion of an identified resource from which a usable mineral or energy commodity can be economically and legally extracted at the time of determination.' (U.S. Geological Survey,1980) Therefore,
changes in metal prices and extraction costs, and the identification of new resources can significantly change the amount of reserves estimated. For example, the estimated world copper reserve is 340 million tonnes (Mt) in 1998, leading to a static depletion index of about 30 years at a primary production rate of 11.4 Mt/y (U.S. Geological Survey, 2000). This number might create the perception that copper reserve will run out by 2028. However, two decades later in 2018, while production rate almost doubles to 21.0 Mt/y, the amount of reserve is now 830 Mt (U.S. Geological Survey, 2019c), and the static depletion is increased to 40 years instead of linearly decreasing to 10 years. While primary production did speed up due to rise in copper consumption, the increase of reserve offsets that perceived scarcity, possiblythrough one or more of the factors below: 1) more copper enters reserve due to rise in copper price; 2) more copper enters reserve due to decrease in extraction costs; or 3) discovery of new resources due to rise in demand. Therefore, those who believe in the long-term effectiveness of the market would probably wonder: should we ever fear the depletion of metals, since the market will act in our favor to alleviate scarcity?
While the future of resource depletion and metal scarcity remains uncertain, one finds some indication from historic trends. The extraction of metals has been accompanied by a decline of the metal content in ore, or ore grade decline. Ore grade decline has been viewed as one possible indicator for metal scarcity
(Northey, Mohr, Mudd, Weng, & Giurco, 2014). Deposits that are rich in metals, or richer parts of the deposits usually get extracted first because of the potential for better profits, therefore the remaining deposits have lesser quality. From a long-term perspective, the ore grade of many metals have been consistently declining, including lead, zinc (Mudd, Jowitt, & Werner, 2017), copper (Northey et al., 2014), gold (Mudd, 2007), platinum group metals (Mudd, 2012) and uranium (Mudd, 2014). Ore grade decline can translate directly into an increase in mining cost per unit of metal extracted. On an industry level, a
consistent rise in mining cost means that less metal can be extracted at the same margin. This would cause supply to be in deficit and drive price to rise. In Figure 1.2, the historical prices for six base metals are shown between 1900 to 2015. All prices are inflation adjusted and shown in 2017 constant United States Dollars per tonne (USD/t). None of the six metals has shown trends of linear price growth in the last century, even though ore grades have declined by a factor of 3-4, based on the literature above. This indicates that the extraction cost must have decreased over time, which offsets the decrease in ore grade. This is most apparent for the price of aluminum, whose current price is only 10% of its 1900 level. In fact, when aluminum was first produced, its price exceeded even gold (Venetski, 1969). It was only after the development of a large scale production method by French engineer, Paul Heroult, American engineer, Charles Martin Hall, and Austrian chemist, Carl Joseph Bayer (Drozdov, 2007) that the price of aluminum dropped and become widely used.
A 12500 50000 LA L D10000 ,40000 r-Sn o 7500 Cu b30000 (N r-4 5000 Pb 20000 U _ CL 2500 10000l Zn J0 1900 1925 1950 1975 2000 1900 1925 1950 1975 2000 Year Year
Figure 1. 2 Inflation adjusted metal prices (2017 constant USD/t) for copper, lead, zinc (left figure), aluminum, nickel and tin (right figure) during 1900 to 2015.
Given the above observations of metal prices, it seems that these metals have not become more scarce with increasing production. In the long-term, if the market perceives the scarcity of a metal, it should be followed by a rise in the metal's price, which further causes a cascade of results including, 1) metal suppliers to extract and produce more of that metal; 2) more efficient and cost saving extraction methods to be developed; 3) more resources to be discovered, identified and deposits being explored; and 4) consumers of the metal use more substitute materials. All these results will act contrary to the rise in price, and bring supply and demand to a new balance. If the market is efficient enough in the long term, demand should not exceed supply for a very long period, as suppliers and consumers will find ways to increase supply or decrease demand. The result is that the possible metal depletion indicated by a
depletion index will be at least delayed, if not completely avoided.
Short term concerns
Compared to the long-term concern for metal depletion, short term concerns over lack of supply might be more critical and immediate. These concerns can originate either from the demand side or the supply side. On the demand side, significant increase in metal consumption, or the expectation for future metal consumption, can cause supply deficit in the short term. For example, demand for cobalt in electric vehicles is expected to grow exponentially after 2020, causing the availability of cobalt to be questioned towards 2030 (Fu et al., 2019). A consequence of this significant demand increase is the jump in its price: cobalt metal price on the London Metal Exchange (LME) has grown from 22000 USD/t in the mid-2016 to 94000 USD/t in the beginning of 2018 ("London Metal Exchange: LME Cobalt," n.d.). While demand can increase fairly quickly once a material demanding new technology is adopted, increase in primary metal production can be very slow, often taking 10 years or more. In orderfor a deposit to turn into an operating mine, owner of the deposit has to carefully assess the technical, economic, environmental and regulatory feasibilities, and the whole process can take years (Fu et al., 2019). This is followed by mine construction, which will take another one to five years depending on the metal and the deposit (S&P Global Market Intelligence, 2019b). The consequence of this slow response is that growth in metal production cannot catch up with growth in consumption, and the perceived scarcity leads to speculative behaviors that cause
high metal price, delaying technology adoption. Another risk on the demand side is the lack of substitutability. On a corporate level, substitutability can be described semi-quantitatively by substitute performance, substitute availability, price ratio and environmental impact ratio (T. E. Graedel et al., 2012).
If price a metal has jumped up and substitutability of that metal is bad in the short term, its consumers either have to rely on it and pay the high price, or switch to a cheaper option by sacrificing performance. On the supply side, there are also quite a few factors that can cause a metal to be conceived as critical or risky. Among the many factors that have been discussed in literature, country-level production concentration and governance risk are the most frequently used indicator of supply risk (M. Frenzel, Kullik,
Reuter, & Gutzmer, 2017). Highly concentrated supply in countries with poor governance is an indicator that consumer countries with high import reliance might not be able to obtain stable metal supply. Another critical supply-side risk factor is the byproduct status of many metals, the focus on this research. For many metals, theirvalues in ore are so small thatthey cannot be economically extracted on their own. Rather, these metals are mined and produced together with other metals that have relatively higher values in ore, so the supply of these byproducts is contingent on the dynamics of their carrier materials. Such contingencies have been viewed as significant sources of supply risk in many criticality studies (M. Frenzel et al., 2017). The hypothesis for byproduct metals' supply being riskier is as follows. For metals that are mostly mined as primary products, their production can respond to changes in demand and price, although possibly with long delays mentioned above; For the production of a byproduct metal, however, it will only follow the production of its carrier metal rather than the demand of the byproduct. This is because the value of a byproduct in ore is usually very small compared to the carrier metal, so the miner will not likely increase its production just due to price increase of the byproduct. The byproduct status also has other implications on a metal: a group of researchers (Max Frenzel, Ketris, & Gutzmer, 2014; Max Frenzel, Ketris, Seifert, & Gutzmer, 2016; Max Frenzel, Tolosana-Delgado, & Gutzmer, 2015) argued that the maximum potential production, or supply potential of a byproduct, is limited by the production of the carrier; Redlinger and Eggert found that the prices of common byproduct metals have typically been more volatile than metals that are produced as primary products (Redlinger & Eggert, 2016).
Some common examples of byproduct connections are shown in Figure 1.3, which includes many key metals in low-carbon technologies. For example, cobalt is used for electric vehicles, cadmium, indium, gallium, tellurium and selenium for thin-film solar cells, germanium for electric grids and transmissions, and REEs for wind energy (Buchholz & Brandenburg, 2018). If these technologies became widely adapted, it means that growing demand will meet with less supply, creating gaps to clean energy application manufacturers and potentially impacting the transition to a low-carbon future.
Figure 1. 3 Common byproducts of major metals including tin, aluminum, zinc, lead, copper, platinum and nickel (adapted from (Hageluken & Meskers, 2010))
In this thesis I hypothesize that all byproduct metals are not created equal. The relationship of a pair of carrier-byproduct metals is unique, as the mineral containing both metals, the extraction process, the market and end-use applications are different for each metal. For example, while indium is extracted almost entirely as byproduct of zinc, cobalt can be produced as byproduct of copper, nickel, PGMs and also as a primary commodity. Therefore, it is the primary goal of this thesis to understand the detailed implications of the byproduct status on the supply risk of a metal. With this more detailed understanding, strategies to address availability can be better prioritized and motivated. On one hand, it is necessary to systematically understand the carrier-byproduct relationship for carrier-byproduct metal pairs with different characteristics; On the other hand, it is also crucial to investigate approaches to mitigate supply risks, if such risks do exist for byproduct metals. In what follows, a few common supply risk mitigation
strategies are discussed.
Supply risk mitigation strategies
Approaches to mitigate metal supply risk can be classified into three categories, depending on the target of the approach: 1) those that aim to increase the primary supply of the metal; 2) those that aim to increase the secondary supply of the metal; and 3) those that aim to reduce the demand of the metal.
Primary supply strategies
On the primary supply side, several approaches can increase the amount of metal supplied to the market. For metal processors such as miners, smelters and refineries, short term approaches can be taken to temporarily increase metal production, without adding new capacity or using new extraction processes. For example, short run production can be raised by either raising the capacity utilization rate, or increasing the recovery efficiency. However, the marginal cost of producing one more unit of metal is usually an
increasing function with production beyond some threshold (Baumol & Blinder, 2015), so these short run improvements are usually done only when metal prices are high enough.
In order to improve metal supply in the long run, more metal in deposits must be made economically available, through 1) the identification of new resources and/or 2) more identified resources being turned into reserves. As an example of 1), cobalt is currently only being extracted from terrestrial deposits and the identified total world terrestrial cobalt resources are 15 Mt in 2008 (U.S. Geological Survey, 2009). A decade later, while identified terrestrial cobalt resources grow to 25 Mt (U.S. Geological Survey, 2019b), another 120 Mt of cobalt resources have been identified on the sea floors of the Atlantic, Indian, and Pacific Oceans. If these deep sea resources can be made economically viable under cost-effective seabed mining technologies, concerns over the availability of cobalt should be greatly alleviated. As for 2), improvement in extraction technologies may enable more resources to be considered as reserves. For example, the solvent extraction and electrowinning (SX-EW) process for copper production has been widely applied globally since 1960, due to its cost advantage for low grade oxide ores compared to the conventional pyrometallurgical process (International Copper Study Group, 2019b). The share of SX-EW in global copper mining production has grown from 0 in 1960 to about 20% in 2017 (International Copper Study Group, 2019b). Without the SX-EW process, the treatment of some low grade oxide ores would be difficult and probably uneconomical, and it is reasonable to assume that cumulative world copper mining production during the last five decades would be less than that of the current. More recently, a molten electrolysis method has been proposed to extract copper from sulfide minerals (Sahu, Chmielowiec, & Allanore, 2017). These method is cost-effective as well as environmentally friendly, eliminating toxic byproducts such as sulfur dioxide produced in a conventional pyrometallurgical process. If stricter environmental regulations on sulfur oxide emissions are carried out, some deposits might be uneconomical under that pyrometallurgical process due to high environmental cost, while the alternative process could avoid that issue.
The improvement of extraction technology is particularly important for metals extracted as byproducts, as the overall recovery rate for many byproduct metals are very low. These recovery rates are low because metal extraction processes are usually optimized for the primary metals to increase the profit for metal processors, while the recovery of byproduct metals are less critical from an economical sense. Forexample, for primary copper refineries that extract selenium and tellurium from copper anode slimes in the
electrolytic copper refining process, the extraction efficiency for selenium and tellurium can be as low as
30%, while recovery efficiency for copper is usually greater than 99% (Jensen, 1985). The recovery
efficiency of extracting germanium as byproduct of coal and indium as byproduct of zinc are also estimated to be less than 30% (Max Frenzel et al., 2014; Lokanc, Eggert, & Redlinger, 2015). If these
current extraction processes can be improved, supply of many byproduct metals can be improved not only in the short run due to recovery rate increase, but also in the long run because more amount of these byproducts can be extracted economically. In this thesis I examine the economic feasibility of such improvements, first in a general screening assessment and then in a detailed case study for indium.
Secondary supply strategies
Increasing secondary metal supply, or supply from metal recycling, is one of the most widely discussed supply risk mitigation strategies. The critical role of secondary supply has been well recognized for many metals with important industrial applications, as metals from recycling provides a buffer to mitigate the imbalance between demand and primary supply (Reck & Graedel, 2012). Besides providing additional
supply, metal recycling is also generally much more energy-efficient and environmentally-friendly than mining (Robert U. Ayres, 1997; Reck & Graedel, 2012; Worrell & Reuter, 2014). For example, it is estimated that production of austenitic stainless steel from scrap would cut energy use by 67% and C02 emission by
70% compared to virgin-based production (J. Johnson, Reck, Wang, & Graedel, 2008).
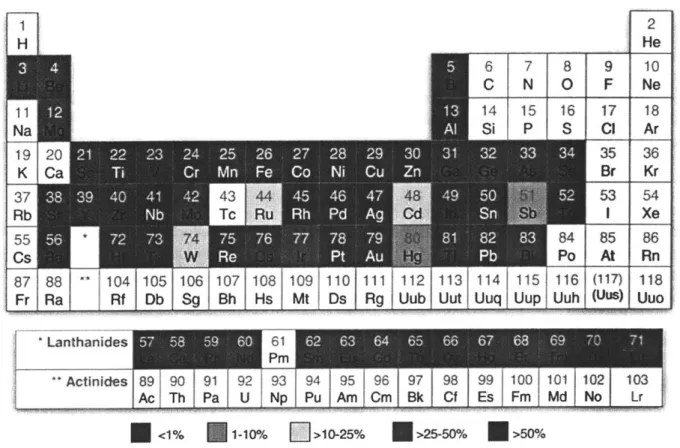
For many metals, recycling still presents significant challenges despite its many benefits. The end-of-life recycling rate (EOL-RR) is currently quite low for many metals. A study of the EOL-RR for 60 elements (T.
E. Graedel et al., 2011a) shows that the commonly-used base metals such as iron, copper, zinc and
aluminum are recycled in large quantities and fraction (EOL-RR > 50%) because of the scale of their
economic values. Precious metals like gold and silver are also recycled at high rates due to their high unit values. However, over half of the elements have an EOL-RR lower than 1%, most of them being minor metals that are utilized by emerging technologies (See Figure 1.4). Many common byproduct metals fall in this category, such as gallium, germanium, selenium, tellurium and indium. The main reason for their low recycling rates is that modern technologies usually require extensive mixing of elements to enhance performance for products, and this has created challenges for separation technology (Reck & Graedel, 2012). While increasing the recycling rates for byproduct metals would directly increase their availability, it is not explored as a mitigation strategy in this thesis. The intention of this thesis is to explore some significant but indirect consequences of recycling.
1 2 He 6 7 8 9 10 C N O IF Ne 87 14 15 16 17 18 Na S P S CI Ar 19 20 35 36 K Ca Br Kr 37 43 44 - • 48 53 54 Rb • Tc Ru - • Cd Sbi Xe 55 74 84 85 86 CS W - - Hg -- Po At Rn 8 88 104 10 0 0 0 0 10 1,11 i 12 i 1 14 1151 116 (117) 118
F Ra Rf D SgB HsM Ds Rg Uub Uut Uuq Uup Uuh (Us) Uuo
*Lanthanides 61626 646 666 68 9 70 1
Actinides 89 90 91 92 93 94T95 96 97] 98 99 100 101 102 103
Ac Th Pa U Np Pu Am Cm B~k Cf IEs|LFm Md No Lr <1% 1-10% >10-25% >25-50% >50%
Figure 1. 4 Estimates for global average EOL-RR for 60 elements. Reproduced from (Reck and Graedel, 2012)
In addition to the low recycling rate, challenges for metal recycling also exist from a market perspective. The energy and environmental benefits of recycling can only be realized if the increase in secondary supply leads to reduced extraction of virgin ores. The proportion of primary material production prevented by recycling was termed the displacement rate in previous studies (Zink, Geyer, & Startz, 2016, 2018). If displacement rate of a metal is low, the environmental benefits from recycling can be undermined. The logic of displacement is as follows: when recycling activities increase and more metal scraps become available to the market, prices of metal scraps should decrease. More intermediate metal consumers and end consumers, such as smelters, refineries and manufacturers would then substitute metal scraps for metal and intermediate materials made from primary production. As the consumption for primary materials decreases, prices of those materials would drop, and primary producers such as miners would eventually reduce production because of lower profit level.
Due to the interconnection between the supply of a carrier metal and its byproduct, recycling activities for the carrier metal have been hypothesized to cause changes in the byproduct metal's own cycle. Many byproduct metals only accompany the primary production of their carriers but not the secondary production: For example, while tellurium and selenium can be extracted from anode slimes during the primary electrolytic refining of copper anode, the refining of copper scrap does not lead to these two byproducts being recovered. This is because tellurium and selenium are considered impurities in the primary production process and are separated from copper during primary production. End-use of copper cathode in final products require little or no impurities, so recovering copper from final products are usually not accompanied by byproduct production. This observation has important implications to the availability of byproduct metals: while increase in recycling for the carrier metal alleviates its supply risk, the potential to produce byproduct metals might be negatively impacted, if primary production of the carrier is reduced due to increased recycling. Therefore, it is crucial to managing the trade-off between two metal systems in the context of the carrier-byproduct relationship. An analytical tool is built in this thesis to quantitatively understand the impact of carrier recycling on its own primary production, and the impact on its byproduct.
Demand side strategies
Demand side strategies aim to mitigate material availability risk by reducing material demand in manufacturing and use. Just to name a few, some common strategies include material substitution, product lifetime extension, product re-use, dematerialization and so on. These strategies are outside the scope. While these are also important mitigation strategies, they are not explicitly explored in this thesis. The focus of this thesis is on the supply side.
Thesis overview
The primary goal of this thesis is to understand the two materials criticality metrics related to supply risk:
1) the status of a metal produced as a byproduct; 2) the market impact of increased metal recycling. The structure of this thesis (Chapter 3 to Chapter 5) is visualized in Figure 1.5.
Material criticality metrics related to supply risk
I
4/) U4)
C 4-J MiIr
II
I
-I-I
I
I
I
Ir
Figure 1. 5 Visualization of thesis structure (Chapter 3 to Chapter 5)
A literature review on material criticality studies is provided in Chapter 2, which provides motivation for why these the above two metrics should be investigated in this thesis. For the first metric, byproduct metal status, the following research question is posed:
For which cases and under what contexts will the byproduct status be a significant criticality indicator?
An attempt is made to answer this question, which will be presented in the third chapter of the thesis. In Chapter 3, a classification of carrier-byproduct metal systems is performed, based on the distinct market characteristics and dynamics of each pair. Results from this classification allows me to identify groups of byproduct metals with high criticality status. In addition, two criticality indicators specific to byproduct metals are developed in this chapter, including price elasticity of supply and supply potential. These two indicators are applied to three carrier-byproduct metal systems to provide high-resolution analysis to the
supply risks of the byproduct metals. Furthermore, supply potential is also used as a screening tool to investigate the risk status of byproduct metal systems with intermediate criticality concerns.
Following the risk diagnosis in Chapter 3, the next two chapters further investigate the impact of two specific mitigation strategies. This part aims to answer the second research question posed in this thesis:
What are the impacts of supply risk mitigation strategies on the availability of metals?
Chapter 4 will examine the impact of developing alternative extraction processes to mitigate supply risk specifically for byproduct metals. Such processes are motivated by the results of Chapter 3, where it is found that low recovery efficiency has limited the supply for a few byproduct metals. Therefore, it is the goal of Chapter 4 to investigate whether alternative extraction processes could improve these low recovery rates in economically feasible manners. A screening assessment for economic feasibility is first performed on byproduct metals of copper and zinc, which allows indium to be identified as the metal of interest. In this chapter, an extraction process is developed specifically for indium, which is shown to be thermodynamically feasible. A cost model is further developed for the process, and applied to global indium containing deposits. This application provides mine-level insights to the concept of economic feasibility.
Metal recycling is the supply risk mitigation strategy studied in Chapter 5. As a specific aspect, this chapter aims to quantify the primary production market impact of increased recycling activities. A bottom-up copper market simulation model is developed to provide an estimate for how much copper primary production is offset by increased copper recycling. This is then linked to the subsequent influence on the availability of byproduct of copper, namely selenium, tellurium and cobalt. To mimic the market dynamics in reality, the supply and demand of major copper related commodities are modeled in detail based on historical data and industry expert opinions. A particular effort is spent on modeling the formation of prices, which in turn drives producers and consumers' decision making.
Chapter 2: Literature Review
Acknowledgement: Portions of this chapter are based on a 2017 publication by Fu et al. in Journal of
Industrial Ecology, titled High-Resolution Insight into Materials Criticality: Quantifying Riskfor By-Product Metalsfrom Primary Production (Fu et al., 2018)
The first chapter provided an overview to the thesis, the goal of which was to provide more thorough understanding on two aspects of material criticality: the status of a metal produced as a byproduct, and the market impacts of increased recycling activities. In this chapter, I review literature related to these topics and present the research gaps that motivate the development of this thesis. An overview of general materials criticality studies is presented, from which I find that byproduct dependency and metal recyclability are the two criticality indicators that require more quantitative attention. Following this observation, studies investigating specific byproduct metals and challenges in metal recycling are reviewed in detail, which provide further motivation for specific focuses on the two criticality indicators. It is worth mentioning that only studies that provide overall motivation to this thesis are reviewed in this chapter. Other studies that provide data and specific backgrounds for case studies, or insights to methodologies are reviewed in each topic chapter following Chapter 2.
A brief overview of material criticality
The growing demand for many elements in terms of both quantity and variety has brought concerns over the availability of raw materials. This has motivated research focus on material criticality, which aims to identify metals that have significant importance to the sustainable development of human society and metals whose future availability might be in doubt. The first widely accepted publication that defines material criticality is a 2008 report titled Minerals, Critical Minerals and the U.S. economy written by the
United States National Research Council (US NRC) (U.S. National Research Council, 2008). In this report,
US NRC defined the criticality of minerals as a function of two variables: a variable that embodies the idea of importance in use and represents the impact of supply restriction; Another variable that embodies the idea of availability and represents the supply risk. Such a two variable determination can be visually
represented by a two-dimensional 'criticality matrix', shown in Figure 2.1. According to this framework, metals located at the upper right corner of the figure have the highest level of criticality, while metals located at the lower left corner are less critical.
4 (higk tA. Ga 0 Uithium Manganese E * Palldium
1 (low)
i
4 TantalumRare Earth ElementsA Vanadium 1 (low) 2 3 4 (high)
Supply Risk
Figure 2. 1 The 'criticality matrix'for 13 metals, reproduced from (U.S. National Research Council, 2008)
Following US NRC's research in 2008, a number of criticality studies have been carried out by manufacturing companies (Duclos et al., 2010), government agencies (Bauer et al., 2010, 2011; British Geological Survey, 2011; British Geological Survey, 2012; British Geological Survey, 2015), research institutes (Gl6ser, Tercero Espinoza, Gandenberger, & Faulstich, 2015; T. E. Graedel et al., 2012; T. E. Graedel, Harper, Nassar, Nuss, & Reck, 2015) and international organizations (Arrobas, Hund, Mccormick,
Ningthoujam, & Drexhage, 2017; European Commission, 2014). While the geological focus, time horizon, material focus, and assessment dimensions vary across these studies, all considered supply risk to be an important component for material criticality. In addition, most of these investigations considered the economic importance of materials, although the specific indicators used varies. These two aspects are analogous to the two variables of US NRC's criticality matrix, availability risk and important of use. The studies by Graedel et al. (T. E. Graedel et al., 2012) also introduced a third variable for environmental concerns.
There are some key differences across supply indicators across the studies mentioned above. In a 2013
review paper (Achzet & Helbig, 2013), Achzet and Helbig reviewed the differences of supply risk evaluation in 15 criticality assessments published between 2006 and 2011. They found that among the many supply risk indicators used, country level production concentration represented by Herfindahl-Hirschman index (HHI) is the most frequently used, followed by country governance, depletion time, and by-product dependency. Below I expand this analysis, by including ten more studies published between 2011 to 2018. The results of this analysis is shown in Table 2.1. Only indicators included in at least two criticality studies are presented.
Table 2. 1 Country-level supply risk indicators used in 25 criticality studies between 2006 and 2018, and their frequencies of use. Studies prior to 2011are based on (Achzet & Helbig, 2013)
Study
Supply risk indicators
C 0 4-L 4-0 C~ 0. C 0 0-CU a 1 0 4-aD E 0 a) CL 0. I-L = U-I 0 E :-Cu 4-. 0 0 CL L_ 0 UO C 0 U-C a 0 Ui CL E a) .0 0) 'p 0) U) 4.# C a) L 0 E E 0 '4-0 L Eu (Frondel et al., 2007) V V V (Behrendt et al., 2007) V V V V
(U.S. National Research Council, 2008) V V V V
(Morley & Eatherley, 2008) V V V
(Duclos et al., 2010) V V V V V V V
(Angerer et al., 2009) V
(Rosenau-Tornow, Buchholz, Riemann, &
Wagner, 2009) V V V V
(Buchert, Schuler, & Bleher, 2009) V V V V
(Reller, 2009) V V V V V V
(European Commission, 2010; European
Commission, 2014) V V V V
(Thomason et al., 2010) V
(Bauer et al., 2010, 2011) V V V V V V V
(Moss, Tzimas, Kara, Willis, & Kooroshy,
2011; Moss et al., 2013) V V V V
(Erdmann, Behrendt, & Feil, 2011) V V V V V V V
(British Geological Survey, 2011) V V V V
(British Geological Survey, 2012) V V V V V V
(British Geological Survey, 2015) V V V V V V
(T. E. Graedel et al., 2012) V V V V
(Hatayama & Tahara, 2015) V V V V
(National Science and Technology Council,
2016) V V
(Fortier et al., 2016) V IV
I
I
I
IVI
I
I
I
Totalcounts 22 19 111 1 9 7 7 6 6 4 3 2 2
The top five supply risk indicators used in these 25 studies are country level concentration of production, country governance, depletion time, byproduct dependency and recyclability. It is worth briefly reviewing how these indicators are quantified in these criticality studies:
1. Country level concentration of production. In most studies, this was quantified either using HHI, or the production fraction of the top one to three producing countries. HHI is a commonly accepted measure of market concentration, and it is calculated by summing the of squares of each competing entity's percentage share. The idea behind using HHI as a supply risk indicator is that, if the production of a metal is concentrated in just one or a few countries, then all the other net-importing countries have to rely only on the supply of those few countries. If supply disruption events such as export restrictions are carried out in these producing countries, then only domestic metal consumers will still have access to that metal supply, while all other foreign consumers will be affected. A high supply concentration can be found for many minor metals, such as indium,
germanium, niobium and most of the rare earth elements, just to name a few (N. T. Nassar,
Graedel, & Harper, 2015).
2. Country governance. A high country-level concentration can be further exacerbated if the major producing countries are geopolitically unstable. This metric can be quantified by using composite indices published by international organizations, such as the Worldwide Governance Indicators developed by the World Bank (D. Kaufmann, Kraay, & Mastruzzi, 2011) and the Human
Development Index developed by the United Nations Environment Programme ("Human Development Reports," 2019). In most studies, these indices were then averaged for top producing countries to obtain the risk indicator for a material. Taking cobalt as an example, close to 60% of 2018 cobalt mining production is concentrated in the Democratic Republic of Congo (DRC), and the HHI was around 4000 in 2018 (Fu et al., 2019). According to the World Governance Indicators, DRC has consistently ranked in the lowest 10 percentile among all countries it investigates, in terms of political stability, government effectiveness, rule of law and control of corruption. The geopolitical riskassociated with DRC had significant impacts on the cobalt market: In the late 1970s, an invasion of the copper-cobalt mining region in the former Zaire was a major reason for the 'cobalt crisis' that led to a five-time price increase from 1977 to 1979 (T. D. Kelly &
Matos, 2015). The first and the second Congo War also led to substantial volatility in the cobalt market in the mid-1990s.
3. Byproduct dependency. In the 11 studies that include byproduct dependency as criticality
indicator, 4 of them quantified it by the byproduct fraction, i.e., the fraction of a material
produced as a byproduct in its global total production (British Geological Survey, 2015; Erdmann et al., 2011; T. E. Graedel et al., 2012; U.S. National Research Council, 2008). However, in the rest 7 studies either a score was assigned qualitatively, or the exact measure for byproduct dependency was unclear.
4. Recyclability. In the 9 studies that include recyclability as criticality indicator, four studies used end-of-life recycling input rate (EOL RIR) (European Commission, 2010; European Commission,