Reduced neural responses to food cues might contribute to the
anorexigenic effect of acute exercise observed in obese but not
lean adolescents
S.N. Fearnbacha,b, L. Silvertc,d, B. Pereirae, Y. Boirief,g,h,i, M. Duclosg,h,i,j, K.L. Kellera,k, and D. Thiveli,l,*
aDepartment of Nutritional Sciences, The Pennsylvania State University, University Park, PA, USA
bBrain and Metabolism Imaging in Chonic Disease, LSU Pennington Biomedical Research
Center, Baton Rouge, LA, USA
cClermont Université, Université Blaise Pascal, Laboratoire de Psychologie Sociale et Cognitive,
BP 10448, F-63000 Clermont-Ferrand, France
dCNRS, UMR 6024, LAPSCO, F-63037 Clermont-Ferrand, France
eClermont-Ferrand University hospital, Biostatistics unit (DRCI), Clermont-Ferrand, France
fDepartment of Human Nutrition, Clermont-Ferrand University Hospital, G. Montpied Hospital,
Clermont-Ferrand, France
gUniversity Clermont 1, UFR Medicine, Clermont-Ferrand, France
hINRA, UMR 1019, Clermont-Ferrand, France
iCRNH-Auvergne, Clermont-Ferrand, France
jDepartment of Sport Medicine and Functional Explorations, Clermont-Ferrand University
Hospital, G. Montpied Hospital, Clermont-Ferrand, France
kDepartment of Food Science, The Pennsylvania State University, University Park, PA, USA
lClermont Auvergne University, EA 3533, Laboratory of the Metabolic Adaptations to Exercise
under Physiological and Pathological Conditions (AME2P), Clermont-Ferrand, France
Abstract
Acute exercise has been found to reduce subsequent energy intake in obese adolescents. Although it has been suggested that some neural pathways are involved in this post-exercise energy intake regulation, it remains unknown whether the post-exercise attentional response to food cues differs as a function of weight status. We hypothesize that there will be a reduction in the neural response to food cues as a result of exercise in obese adolescents, but not in their lean counterparts. Fourteen obese and 14 lean adolescent boys (12–15 years) were randomized (within-subjects design) to remain seated (CON) or to exercise 45 minutes at 65% of their maximal capacities
HHS Public Access
Author manuscript
Nutr Res
. Author manuscript; available in PMC 2018 August 01.Published in final edited form as:
Nutr Res. 2017 August ; 44: 76–84. doi:10.1016/j.nutres.2017.06.006.
A
uthor Man
uscr
ipt
A
uthor Man
uscr
ipt
A
uthor Man
uscr
ipt
A
uthor Man
uscr
ipt
(EX). After the exercise or sitting period, the adolescents' cognitive engagement in the processing of food vs. non-food cues was assessed during an attentional computer-based task with
electroencephalography (EEG) recording. An ad libitum lunch meal was offered and appetite feelings were assessed (visual analog scales). There was no main effect of condition on energy intake in lean subjects, but obese adolescents ate significantly less following EX compared with CON (P < .05). There was no effect of condition or stimulus type (food vs. non-food) on the EEG-recorded amplitude of the P3b component in lean adolescents. However, the response to food cues was significantly reduced compared with non-food stimuli after exercise in obese participants (P < .01). Following EX, but not CON, total body weight, body mass index, and fat mass were inversely correlated with the EEG response to food–non-food stimuli (all P < .05). However, this response was not associated with ad libitum EI (both P > .1). Acute exercise favors decreased neural response to food cues compared with non-food cues in obese but not lean adolescents, suggesting differential effects of exercise on the neural processing of food cues based on weight status.
Keywords
Food cues; Exercise; Energy intake; Weight status; Adolescent
1. Introduction
Based on the increasing rates of pediatric overweight and obesity worldwide, energy balance regulation, particularly the relationship between energy intake (EI) and energy expenditure (EE), is currently of major interest. Long considered independently, EI and EE have been shown to closely interact suggesting new approaches to control and manipulate energy balance [1,2].
In both adults and children, an acute bout of intensive exercise (above 70% of the individual's maximal capacity) has been shown to favor a transient anorexigenic effect in obese patients, leading to a reduced subsequent energy consumption without any alteration of appetite sensations [3–5]. This acute effect of exercise on appetite control has mainly been attributed to its impact on particular gastro-peptides (eg, Peptide YY, GLP-1, ghrelin) involved in the short-term regulation of EI in adults [2,3,6] and youth [7].
Peripheral factors (such as gastro-peptides) communicate information regarding energy homeostasis to the hypothalamus, suggesting one potential explanation for this post-exercise modification of food consumption. In addition, recent studies have suggested a role for additional neural pathways implicated in the cognitive processing of food-related cues [8,9]. Results from one functional magnetic resonance imaging (fMRI) study in healthy adult men suggest that the activation of several brain areas involved in the attentional processing of food-related cues could be reduced with 60 minutes of intensive cycling exercise [8]. Using event-related potentials (ERPs) derived from electroencephalography (EEG) recordings, Hanlon and collaborators measured the late positive potential (LPP) evoked by visual food cues among lean and obese women [9]. According to their results, 45 minutes of moderate-to-vigorous treadmill exercise favored the reduction of the LPP in response to food cues in
A
uthor Man
uscr
ipt
A
uthor Man
uscr
ipt
A
uthor Man
uscr
ipt
A
uthor Man
uscr
ipt
both groups [9]. This effect was interpreted as a reduced neurologically determined food motivation (and more precisely as a lower attentional processing of the food stimuli). Unfortunately, the authors did not assess whether this was accompanied by an actual decrease in objectively-measured food consumption. More recently, we showed that the amplitude of the P3b component (another ERP component thought to reflect more directly the intensity by which cognitive resources in the brain are engaged to attend to certain stimuli [10]) is significantly reduced in response to food stimuli (compared to non-food) following a 45-minute moderate cycling exercise in obese adolescent boys. Importantly, this time, the reduced neural response to food cues observed after exercise was accompanied by a concurrent reduction in ad libitum food intake at the following meal (compared to a resting condition) [11]. However, since our previous study involved only obese adolescents, it remains unknown whether these effects differ by weight status in youth. The aim of the present study was therefore to compare the post-exercise neural P3b response to food cues, body composition, ad libitum energy intake, and appetite ratings between lean and obese adolescent boys. We hypothesize that there will be a reduction in the neural response to food cues as a result of exercise in obese adolescents, but not in their lean counterparts.
2. Methods and materials
2.1. ParticipantsTwenty-eight adolescent boys (14 with obesity, 14 lean as defined by Cole et al., 2000 [12]) aged 12–15 years (Tanner stage 3–4) took part in this study. Adolescents with obesity were recruited through pediatric consultations (Clermont-Ferrand University Hospital and Romagnat Children Medical Center, France), while lean participants were recruited through protocol advertisements. To be included in the study, participants had to be free of any medication that could interact with the protocol, could not present any contraindications to physical activity, had to take part in less than 2 hours of physical activity per week, and had to be unrestrained eaters (as assessed by the Dutch Eating Behavior Questionnaire, DEBQ). Only male adolescents were recruited for the present study to avoid any potential sex effect in the control of energy intake. All adolescents and their legal guardians received
information sheets and signed consent forms as requested by the ethical authorities (AU1107). This protocol is registered as a clinical trial (clinicaltrials.gov: NCT02100878). Fig. 1 illustrates the recruitment process.
2.2. Overview of the study protocol
First, a medical inclusion visit was conducted by a pediatrician to confirm eligibility of the candidates to participate in all aspects of the study. The participants were asked to perform a submaximal aerobic exercise test and their body composition was assessed by dual-energy X-ray absorptiometry (DXA) at baseline. The adolescents then visited the laboratory on 2 separate occasions (at least 7 days apart) following a within-subjects crossover design: (1) a control session consisting of quiet sitting (CON); (2) a cycling exercise session (EX). Heart rates were recorded during the two sessions (Polar technology monitors). Immediately following the resting control or exercise session; the participants were asked to perform a short visual food-related computer task while an electroencephalogram (EEG) was registered to assess their neural response to food cues. Thirty minutes after the end of the
A
uthor Man
uscr
ipt
A
uthor Man
uscr
ipt
A
uthor Man
uscr
ipt
A
uthor Man
uscr
ipt
exercise (EX) or resting (CON), the participants were served an ad libitum buffet-style meal. Their appetite feelings were assessed using visual analogue scales at regular intervals throughout the day. Energy expenditure was assessed during the exercise and resting conditions using a portable indirect calorimeter (K4b2).
2.3. Anthropometric and body composition measurements
Body weight was measured to the nearest 0.1 kg using a digital scale, and barefoot standing height was assessed to the nearest 0.1 cm using a wall-mounted stadiometer. Body mass index (BMI) was calculated as body weight (kg) divided by height squared (m2). Fat mass (FM) and fat-free mass (FFM) were assessed using DXA following standardized procedures (QDR4500A scanner, Hologic, Waltham, MA, USA). These measurements were obtained during the preliminary visit by a trained technician. The validity and accuracy of this method in this population have been previously demonstrated [13].
2.4. Aerobic capacities
Each participant's aerobic capacity was assessed during a submaximal graded cycling test performed at least 1 week before the experimental session (preliminary visit). The test was composed of 4 stages of 4 minutes each starting from 30 W with an increment of 15 W each. An electromagnetically braked cycle ergometer (Ergoline, Bitz, Germany) was used to perform the test. VO2 and VCO2 were measured breath-by-breath through a mask connected
to O2 and CO2 analyzers (Oxycon Pro-Delta, Jaeger, Hoechberg, Germany). Calibration of
gas analyzers was performed with commercial gases of known concentration. Ventilatory parameters were averaged across every 30 seconds. Electrocardiography was also used for the duration of tests. This test, performed under the supervision of an accredited medical doctor, aimed at establishing the individual relationship between heart rate and VO2, and
work load (W) and VO2 in order to calibrate the intensity of the exercise for the
experimental session. The procedures of this test followed the appropriate recommendations [14].
2.5. Attentional computer task
Fifteen minutes after the EX or CON condition, the adolescents were asked to complete a computer-based oddball task involving the presentation of infrequently presented food and non-food target visual stimuli among repeated presentations of a non-target item [9,15]. This task included 288 trials. The frequent, standard Non-Target item was a colored abstract pattern (n = 216). The Target items (n = 72) were colored pictures taken from the food.pics database [16] which includes pictures of food and neutral objects on a white background, homogeneous in terms of viewing distance and figure-ground composition. Half of the Target items (n = 36) were pictures of food (Food; eg, muffin, candies, sandwich, hamburger, etc.), the other half neutral household objects (Non-food; eg, stapler, ladder, flower bouquet, hairbrush, etc.). The sets of Food and Non-food pictures were chosen in such a way that, based on food.pics scores, they did not significantly differ (two-tailed t-tests) with regard to global perceptual characteristics (brightness, P = .35; contrast, P = .19) and visual complexity (jpg compression, P = .21; edge detection, P = .22), as well as to subjective ratings for complexity (P = .92).
A
uthor Man
uscr
ipt
A
uthor Man
uscr
ipt
A
uthor Man
uscr
ipt
A
uthor Man
uscr
ipt
Each of the Target items appeared only once during the experiment. All the stimuli were displayed for 750 milliseconds in the center of a computer screen, on a white background. In between each stimulus, a black fixation cross was shown, with a duration varying randomly between 1200 and 1800 milliseconds (with a mean of 1500 milliseconds). The stimuli were presented in a pseudo-randomized order, different for each participant, so that there were no consecutive Target trials. The experiment was divided into 2 blocks of 144 Non-Target and 36 Target stimuli (half Food), separated by a rest period which ended when the participant was ready to move on and pressed the space-bar.
Participants were asked to press the space-bar as quickly as possible every time they saw a picture different from the Non-Target item. Central fixation was required throughout and the participants were encouraged to blink only when the fixation cross was displayed on the screen. The oddball task lasted about 11 minutes.
2.6. Electrophysiological data recording
Sixty-four active electrodes were used to continuously record the EEG (extended 10–20 system) with BioSemi Active II System (BioSemi, Amsterdam, Netherlands), with a band pass from 0.16 Hz to 100 Hz and at a rate of 512 Hz. Off-line analyses were computed with BESA 5.2.3. ERPs time-locked to the stimuli (−100 to 600 milliseconds) were averaged separately for each channel and for each experimental condition, were digitally filtered at 40 Hz (12 Db/octave, zero phase shift digital filter) and recalculated to the average reference. Trials with blinks, saccades and non-ocular artifacts were rejected from further analysis: trials with signals exceeding ±100 μV as well as a gradient criterion with more than 75 μV were rejected automatically. A visual inspection of the grand-average waveforms for Target-Food versus Non-Target and Target-Non-food versus Non-Target trials in the CON condition revealed an enhanced posterior positivity for Target trials (P3b), which reached its maximum amplitude over Pz at around 430 milliseconds for the lean group and 480 milliseconds for the obese group. For all the experimental conditions, the P3b was therefore quantified as the mean amplitude at Cpz, Pz and POz from 380 to 480 milliseconds for the lean group and from 430 to 530 milliseconds for the obese group. The data from these electrodes were then averaged together. This method has been previously used and detailed in this population [11].
2.7. Energy intake assessment
At 8:30 am, the participants had to consume a standardized breakfast in its entirety (same composition and caloric content as previously detailed [17,18]). Thirty minutes after the end of the experimental session, an ad libitum lunch was offered to the participants. The composition of the buffet meal was conformed to the adolescents' tastes as determined by a food preference questionnaire completed prior to the experimental sessions (ie, during the preliminary visit). Top rated items were avoided to limit overconsumption, as well as rarely consumed items to avoid occasional eating, as generally seen in ad libitum feeding
experiments with adolescents published previously [18]. The buffet consisted of two choices per course and was composed of ham, turkey, salad and raw vegetables, mashed potatoes, beans, minced beef, chicken, cheese, yogurts, apple compotes, fruits and bread. The buffet offered to the participants was identical for the 2 experimental sessions. Macronutrient
A
uthor Man
uscr
ipt
A
uthor Man
uscr
ipt
A
uthor Man
uscr
ipt
A
uthor Man
uscr
ipt
composition and energy density of the meals were consistent across participants. Participants were told to eat until satisfied and additional food was provided if desired. Food
consumption was weighed and recorded by investigators (Bilnut 4.0 SCDA Nutrisoft software, France) to calculate total EI during lunch. The proportion of the total EI derived from fat, carbohydrate and protein was calculated using the same nutritional software used to assess total EI. Relative EI (REI) was then calculated as EI-EE for each condition. Ad libitum lunch meal methodology and spontaneous EI assessment were previously detailed [11] and their reproducibility and accuracy has been demonstrated in this population [19].
2.8. Subjective appetite sensations
At regular intervals throughout the day starting at 8:00 am, participants were asked to rate their hunger, fullness and prospective food consumption using visual analogue scales (VAS of 100 mm), for which the reliability has been reported previously [20]. Participants filled in VAS before and after the breakfast, before and after the EX and CON experimental sessions, before and after lunch, and 30 minutes after lunch. This method has previously been used among adolescents with obesity to evaluate appetite feelings [4,21].
2.9. Description of the experimental sessions
Control session (CON)—for 45 minutes (from 10:45 am to 11:30 am) the participants remained seated in a comfortable chair. They were not allowed to talk, read, watch TV, or complete any intellectual tasks. Energy expenditure was assessed by indirect calorimetry.
Exercise session (EX)—from 10:30 am the adolescents were asked to complete a 45-minute cycling exercise set at moderate intensity (65% of their individual VO2max). The
intensity was controlled using recorded heart rate and the workload setting on the cycle ergometer, based on the results from the submaximal aerobic capacity testing.
2.10. Statistical analyses
The number of subjects was determined on the basis of previous studies and after simulation of statistical power [22]. With n = 14 subjects per groups (28 total), the statistical power is greater than 80% with an intra-subject correlation coefficient greater than 0.5. Statistical analyses were performed using Statview 5.0 (SAS Institute, Cary, NC, USA). Results are expressed as means ± SD. The distribution of the data was tested using the Smirnov-Kolmogorov test prior to analysis and data did not require any transformation prior to analysis. Two-way ANOVA were used to compare total EI, REI and the energy ingested derived from each macronutrient (Protein, CHO and fat) (group: Lean vs Obese by condition: CON vs EX). A 2-way ANOVA with repeated measures was used to compare appetite feelings AUC (Area Under the Curve) between experimental sessions. Regarding the computer-based oddball task, reaction times (for correct responses) and ERP amplitudes were examined using 2 × 2 × 2 mixed-model ANOVAs with group (Lean vs Obese) as a between-subject factor and target type (Food vs Non-food) and condition (CON vs EX) as within-subjects factors. Clean EEG data were obtained for 11 lean and 12 obese participants. Tests of simple effects were used to decompose significant main effects and interactions. Correlations (Pearson or Spearman according to statistical distribution) were performed between anthropometric/body composition values and EI following both conditions (EX and
A
uthor Man
uscr
ipt
A
uthor Man
uscr
ipt
A
uthor Man
uscr
ipt
A
uthor Man
uscr
ipt
CON). Similarly, correlations were performed between anthropometric characteristics and body composition, EI, and the P3b amplitudes delta ([Food – Non-food]) following both conditions (EX and CON). The level of significance was set at P < .05.
3. Results
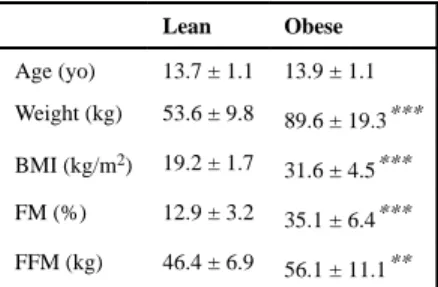
As presented in Table 1, there was no difference in age between the lean and obese groups. The adolescents with obesity had significantly higher body weight (89.6 ± 19.3 vs. 53.6 ± 9.8 kg), BMI (31.6 ± 4.5 vs. 19.2 ± 3.2 kg/m2) and FM percentage (35.1 ± 6.4 vs. 12.9 ± 3.2%) compared with the lean group (P < .001). FFM was also significantly higher in obese compared with lean adolescents (P < .01).
The EE induced by the 45-minute exercise was significantly higher in obese (373 ± 57 kcal) compared with lean (241 ± 93 kcal) (P < .001). The EE induced by the 45-minute rest was also significantly higher in obese (102 ± 19 kcal) compared with lean (85 ± 11 kcal) (P < . 01). The EE during EX was significantly higher compared with the EE during CON in both groups (P < .001).
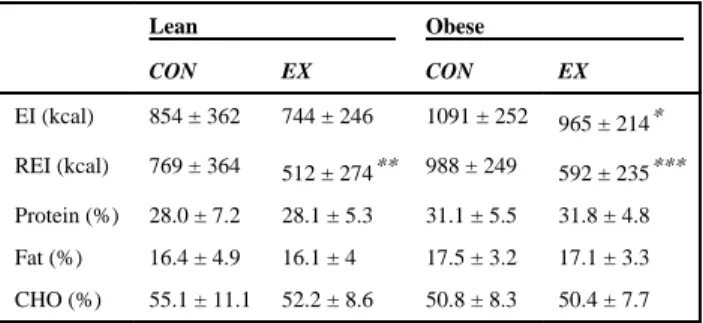
Our statistical analysis revealed a weight status effect for absolute EI, such that adolescents with obesity ate significantly more calories during the ad libitum lunch than lean adolescents (P < .05). There was no effect of condition in the lean sample, as presented in Table 2, but obese adolescents ate significantly less following EX compared with CON (P < .05). We did not find a main effect of weight status on REI, but REI was significantly lower in both lean and obese following EX compared with CON (P < .01 and P < .001 respectively, Table 2). While there was no significant condition or weight status effect on the energy derived from fat and carbohydrates, adolescents with obesity ate significantly more energy from protein than lean adolescents (P < .05), regardless of condition (Table 2).
For the full sample (lean and obese combined), correlations between EI and body composition are reported in Table 3. Total body weight, BMI and FM were all positively correlated with EI at the ad libitum buffet-style meal on both CON and EX (all P < .01). In addition, FFM was positively correlated with ad libitum EI on both days (P < .05). There were no significant differences in effect size between CON and EX.
As illustrated by the Fig. 2, there were no significant differences in appetite feelings (satiety, prospective food consumption, and hunger) between conditions or groups.
Regarding the behavioral results of the oddball task, the mean percentage of correct responses (Target stimulus; response given) was very high for both the lean (99.5 ± 0.4%) and the obese (99.4 ± 0.8%) samples. The 2 × 2 × 2 ANOVA (group × target type × condition) revealed no significant main effect or interaction between the three factors on percentage of correct responses (all P > .14). The same analysis performed on reaction times to targets indicated that the participants were overall faster to respond to Food (478 ± 32 milliseconds) than to Non-food (488 milliseconds ± 26 milliseconds) Targets (F(1,21) = 5.1; P < .05), regardless of weight status. However, none of the other main effects or interactions were significant (all P > .58). Finally, false alarms (Non-target stimulus; response given)
A
uthor Man
uscr
ipt
A
uthor Man
uscr
ipt
A
uthor Man
uscr
ipt
A
uthor Man
uscr
ipt
were very rare, occurring on only 0.42 ± 0.7% and 0.54 ± 0.8% of the trials in the lean and obese group respectively (P > .7).
Concerning the EEG data, the 2 × 2 × 2 ANOVA performed on P3b mean amplitudes revealed that the main effect of target type (Food vs Non-food) was significant (F(1,21) = 5.57; P < .05). However, this effect was better qualified by the interaction between the three factors (F(1,21) = 5.66; P < .05). A 2 × 2 repeated-measures ANOVA (Target type × condition) was therefore performed on P3b amplitudes separately for each group (Fig. 3A, B). In lean adolescents, none of the main effects or interactions reached significance (all P > .34, Fig. 3A). However, in adolescents with obesity, the Target type × condition interaction was significant (F(1,11) = 5.52; P < .05). Planned comparisons showed that while there was no difference between Food and Non-food Targets in the CON condition (P > .88), during the EX condition the P3b amplitude to Food Targets was significantly reduced compared with the P3b amplitude to Non-food Targets (P < .01, Fig. 3B).
Finally, correlations between EEG responses (delta [Food – Non-food]), EI, and body composition are presented in Table 4. Following EX, but not CON, total body weight, BMI, and FM were all inversely correlated with the response to Food – Non-food stimuli (all P < . 05). In other words, higher indices of adiposity were associated with lower brain
responsiveness to Food stimuli following exercise, but this association was not present after the control condition. FFM was not associated with EEG response on either EX or CON (both P > .2). In addition, EEG responses were not associated with ad libitum EI following either condition (both P > .1).
4. Discussion
Identifying the physiological and neurocognitive signals involved in the post-exercise energy intake responses previously observed in children and adolescents is of particular interest in order to better understand their energy balance regulation, and better prevent and treat pediatric overweight and obesity. The present results confirm our hypothesis that an acute bout of moderate intensity exercise would reduce the neural response to food stimuli in obese but not lean adolescent boys. This may reflect a difference in the cognitive effort engaged in response to food stimuli (compared with non-food stimuli) that may be specific to their weight status or body composition.
Previous neuroimaging research has begun to characterize the post-exercise neural responses to food, but differences by weight status (lean vs obese) have not been fully examined, especially in youth. Using fMRI, Evero et al. were the first to investigate the effect of an acute bout of exercise on the neural control of appetite. They showed that a 60-minute intensive (83% HRmax) bout of cycling exercise reduces the response to food vs. control images in several regions of the brain implicated in visual attention and the control of EI, but this protocol was only conducted in lean young adults [8]. Hanlon and collaborators
published the only results available thus far comparing post-exercise neural responses to food cues (based on an EEG exploration) and EI between lean and obese [9]. According to their results, a moderate-to-vigorous 45-minute treadmill exercise can favor the reduction of the Late Positive Potential (LPP) in response to visual food cues in both obese and lean
A
uthor Man
uscr
ipt
A
uthor Man
uscr
ipt
A
uthor Man
uscr
ipt
A
uthor Man
uscr
ipt
premenopausal women, without any differences in 24-hour self-reported energy intake [9]. Studies examining post-exercise neural responses to food and objectively measured food intake are lacking in the literature.
We recently explored the post-exercise neurocognitive responses to food cues and objective food intake in adolescents with obesity for the first time [11]. Our analyses revealed that a 45-minute cycling exercise set at 65% of individual maximal aerobic capacities favors decreased neural responses to visual food cues in 12- to 15-year-old adolescent boys with obesity [11]. Although appetite feelings (hunger, satiety and prospective food consumption) remained unchanged, the post-exercise decrease in the neural response to food stimuli observed in this work was accompanied by a concurrent, significant decrease in food intake [11]. The present analysis expanded on the original to examine the weight status effect, and found unchanged post-exercise neural responses, appetite feelings and food consumption in lean adolescents. These results suggest differential effects of exercise on neural processing of food cues and EI based on weight status. The current findings align with previous studies showing reduced post-exercise EI in obese but not lean age-matched adolescents [18].
Regarding the EEG findings, the current results are, however, contradictive with those published by Hanlon et al., who failed to identify any weight status differences in EEG response between lean and obese adult women [9]. In their study, participants were adult women and their dietary status (restrained or unrestrained) was not assessed, which may explain some of these discrepancies. In another study, Hofmann and collaborators found increased neural responses to food cues in obese compared with lean adolescents, but the obese sample was defined as restrained while the lean sample was defined as unrestrained according to DEBQ scores [23]. In the present work, both lean and obese adolescents were categorized as unrestrained. Taken together, these results suggest that dietary status may have a greater effect on the neural controls of food intake than weight status (see also Hill et al., 2013 [24]), but further studies are definitely warranted in this area.
Because weight status does not always fully capture differences in body composition, we also examined the influence of FM and FFM on EEG response to food cues and ad libitum energy intake following exercise, compared to a control condition, across the full sample. Interestingly, our results show negative correlations between obesity indicators (body weight, BMI and FM percentage) and the P3b amplitude difference between food and non-food cues (Food – Non-non-food) after the exercise bout. In other words, higher adiposity was associated with a greater reduction of the neural responses to food following acute exercise. However, these associations were not present on the control day. Such results underline the importance of considering body composition (and especially FM) rather than just weight status in the post-exercise attentional response to food cues. While chronic physical activity has been found to mainly affect food intake through its effect on FFM (as a homeostatic driver for energy balance) in both adults [25] and youth [26], FM might be implicated in the short term EI response to acute exercise.
Although the obese adolescents showed a greater intake of energy derived from protein, regardless of the condition (EX or CON), we did not observe any effect of exercise on macronutrient intake in either group. This absence of post-exercise modification of the EI
A
uthor Man
uscr
ipt
A
uthor Man
uscr
ipt
A
uthor Man
uscr
ipt
A
uthor Man
uscr
ipt
derived from each macronutrient remains difficult to interpret due to limited and
contradictive results in this population [11,18,27,28]. Our results regarding appetite feelings confirm once more the previously described “uncoupling effect” of acute exercise on appetite sensations and EI [29], since hunger, satiety or prospective food consumption were not modified by exercise in either lean or obese adolescents. This was despite the fact that obese adolescents showed a decrease in EI following EX compared to CON.
Some limitations of the current study should be acknowledged. Previous fMRI literature has shown that areas of the brain involved in reward signaling (eg, substantia nigra, amygdala) may be differentially associated with FM versus FFM [30]. However, these deep, subcortical regions of the brain cannot be accurately imaged using EEG methods, which tend to mainly capture neural activity closer to the scalp surface. This may be one reason why the current study was unable to characterize any associations between FFM and the neural response to food stimuli. In addition, fMRI studies in adults have found effects of exercise on activation in reward (eg, insula, putamen), homeostatic (eg, hypothalamus), and inhibitory (eg, dorsolateral prefrontal cortex) brain regions [8,31], which cannot be adequately measured using EEG. However, the extrapolation of these previous findings in adults to populations of children and adolescents is difficult given the inherent developmental differences in some of these brain areas. Although 14 subjects per group appeared sufficient from a statistical point of view (as indicated by the sample power calculation), larger sample sizes would have strengthened our results. It would be valuable to measure the post-exercise neural adaptations to food stimuli in young girls to expand on the generalizability of the current findings.
While the peripheral-central crosstalk between the hypothalamus and gastro-peptides from the gastro-intestinal tract (such as PYY3–36, GLP1, CCK, ghrelin) has traditionally been
hypothesized to explain the observed post-exercise nutritional adaptations, our results add to the recent literature that additional neurocognitive pathways must also be considered in adolescents with obesity. From a practical point, the present study reinforces the interest in prescribing moderate-to-high intensity exercise for adolescents with obesity, especially by the end of the morning to favor both increased energy expenditure and reduce energy intake. This illustrates that not only the exercise characteristics, such as its modality, duration or intensity, but also the chronobiology (time of day) are important to improve our weight loss interventions. However, further studies are needed to better understand the effects of acute exercise on the control of energy intake. In addition, future research must also be conducted to identify the potential effect of long-term exercise training programs on the central and peripheral pathways involved in appetite regulation to improve our current weight loss and weight control strategies.
Acknowledgments
The authors want to thank the Nestlé Foundation for its support through its 2013 Research Grant funding our energy balance and pediatric obesity projects. We want to particularly thank Dr. SEROG Patrick for his great help and support and all of the adolescents who took part in the study. The authors have no conflicts of interest to disclose. The authors have no financial relationships relevant to this article to disclose.
A
uthor Man
uscr
ipt
A
uthor Man
uscr
ipt
A
uthor Man
uscr
ipt
A
uthor Man
uscr
ipt
Abbreviations
EI Energy intake
EE Energy expenditure
BMI Body mass index
FM% Fat mass percentage
FFM Fat free mass
CON Control
EX Exercise
CHO Carbohydrates
References
1. Blundell JE, Gibbons C, Caudwell P, Finlayson G, Hopkins M. Appetite control and energy balance: impact of exercise. Obes Rev. 2015; 16(Suppl 1):67–76. [PubMed: 25614205]
2. Martins C, Morgan LM, Bloom SR, Robertson MD. Effects of exercise on gut peptides, energy intake and appetite. J Endocrinol. 2007; 193:251–8. [PubMed: 17470516]
3. Ueda SY, Yoshikawa T, Katsura Y, Usui T, Fujimoto S. Comparable effects of moderate intensity exercise on changes in anorectic gut hormone levels and energy intake to high intensity exercise. J Endocrinol. 2009; 203:357–64. [PubMed: 19737911]
4. Thivel D, Isacco L, Montaurier C, Boirie Y, Duche P, Morio B. The 24-h energy intake of obese adolescents is spontaneously reduced after intensive exercise: a randomized controlled trial in calorimetric chambers. PLoS One. 2012; 7:e29840. [PubMed: 22272251]
5. Tamam S, Bellissimo N, Patel BP, Thomas SG, Anderson GH. Overweight and obese boys reduce food intake in response to a glucose drink but fail to increase intake in response to exercise of short duration. Appl Physiol Nutr Metab. 2012; 37:520–9. [PubMed: 22530879]
6. Ueda SY, Yoshikawa T, Katsura Y, Usui T, Nakao H, Fujimoto S. Changes in gut hormone levels and negative energy balance during aerobic exercise in obese young males. J Endocrinol. 2009; 201:151–9. [PubMed: 19158129]
7. Prado WL, Balagopal PB, Lofrano-Prado MC, Oyama LM, Tenorio TR, Botero JP, et al. Effect of aerobic exercise on hunger feelings and satiety regulating hormones in obese teenage girls. Pediatr Exerc Sci. 2015; 26:463–9.
8. Evero N, Hackett LC, Clark RD, Phelan S, Hagobian TA. Aerobic exercise reduces neuronal responses in food reward brain regions. J Appl Physiol (1985). 2012; 112:1612–9. [PubMed: 22383502]
9. Hanlon B, Larson MJ, Bailey BW, LeCheminant JD. Neural response to pictures of food after exercise in normal-weight and obese women. Med Sci Sports Exerc. 2012; 44:1864–70. [PubMed: 22617393]
10. Polich J, Kok A. Cognitive and biological determinants of P 300: an integrative review. Biol Psychol. 1995; 41:103–46. [PubMed: 8534788]
11. Fearnbach SN, Silvert L, Keller KL, Genin PM, Morio B, Pereira B, et al. Reduced neural response to food cues following exercise is accompanied by decreased energy intake in obese adolescents. Int J Obes (Lond). 2016; 40:77–83. [PubMed: 26449418]
12. Cole TJ, Bellizzi MC, Flegal KM, Dietz WH. Establishing a standard definition for child overweight and obesity worldwide: international survey. BMJ. 2000; 320:1240–3. [PubMed: 10797032]
A
uthor Man
uscr
ipt
A
uthor Man
uscr
ipt
A
uthor Man
uscr
ipt
A
uthor Man
uscr
ipt
13. Aucouturier J, Meyer M, Thivel D, Taillardat M, Duche P. Effect of android to gynoid fat ratio on insulin resistance in obese youth. Arch Pediatr Adolesc Med. 2009; 163:826–31. [PubMed: 19736336]
14. Rowland TW. The biological basis of physical activity. Med Sci Sports Exerc. 1998; 30:392–9. [PubMed: 9526885]
15. Kong F, Zhang Y, Chen H. Inhibition ability of food cues between successful and unsuccessful restrained eaters: a two-choice oddball task. PLoS One. 2015; 10:e0120522. [PubMed: 25886063] 16. Blechert J, Meule A, Busch NA, Ohla K. Food-pics: an image database for experimental research
on eating and appetite. Front Psych. 2014; 5:617.
17. Thivel D, Isacco L, Rousset S, Boirie Y, Morio B, Duché P. Intensive exercise: a remedy for childhood obesity? Physiol Behav. 2011; 102:132–6. [PubMed: 20971128]
18. Thivel D, Metz L, Julien A, Morio B, Duche P. Obese but not lean adolescents spontaneously decrease energy intake after intensive exercise. Physiol Behav. 2014; 123:41–6. [PubMed: 24103421]
19. Thivel D, Genin PM, Mathieu ME, Pereira B, Metz L. Reproducibility of an in-laboratory test meal to assess ad libitum energy intake in adolescents with obesity. Appetite. 2016; 105:129–33. [PubMed: 27224220]
20. Flint A, Raben A, Blundell JE, Astrup A. Reproducibility, power and validity of visual analogue scales in assessment of appetite sensations in single test meal studies. Int J Obes Relat Metab Disord. 2000; 24:38–48. [PubMed: 10702749]
21. Thivel D, Isacco L, Taillardat M, Rousset S, Boirie Y, Morio B, et al. Gender effect on exercise-induced energy intake modification among obese adolescents. Appetite. 2011; 56:658–61. [PubMed: 21376093]
22. Bonett DG. Sample size requirements for estimating intraclass correlations with desired precision. Stat Med. 2002; 21:1331–5. [PubMed: 12111881]
23. Hofmann J, Ardelt-Gattinger E, Paulmichl K, Weghuber D, Blechert J. Dietary restraint and impulsivity modulate neural responses to food in adolescents with obesity and healthy adolescents. Obesity (Silver Spring). 2015; 23:2183–9. [PubMed: 26381395]
24. Hill C, Wu J, Crowley MJ, Fearon P. Restrictive feeding practices and adiposity are differentially related to P3b cortical responses to food stimuli in children. Appetite. 2013; 63:7–17. [PubMed: 23220393]
25. Blundell JE, Caudwell P, Gibbons C, Hopkins M, Naslund E, King NA, et al. Body composition and appetite: fat-free mass (but not fat mass or BMI) is positively associated with self-determined meal size and daily energy intake in humans. Br J Nutr. 2012; 107:445–9. [PubMed: 21733267] 26. Cameron JD, Sigal RJ, Kenny GP, Alberga AS, Prud'homme D, Phillips P, et al. Body composition
and energy intake—skeletal muscle mass is the strongest predictor of food intake in obese adolescents: the HEARTY trial. Appl Physiol Nutr Metab. 2016 Jun; 41(6):611–7. [PubMed: 27111402]
27. Chaput JP, Schwartz C, Boirie Y, Duclos M, Tremblay A, Thivel D. Energy intake adaptations to acute isoenergetic active video games and exercise are similar in obese adolescents. Eur J Clin Nutr. 2015; 69:1267–71. [PubMed: 25804270]
28. Thivel D, Metz L, Aucouturier J, Brakoniecki K, Duche P, Morio B. The effects of imposed sedentary behavior and exercise on energy intake in adolescents with obesity. J Dev Behav Pediatr. 2013; 34:616–22. [PubMed: 24131885]
29. Thivel D, Chaput JP. Are post-exercise appetite sensations and energy intake coupled in children and adolescents? Sports Med. 2014; 44:735–41. [PubMed: 24549478]
30. Fearnbach SN, English LK, Lasschuijt M, Wilson SJ, Savage JS, Fisher JO, et al. Brain response to images of food varying in energy density is associated with body composition in 7- to 10-year-old children: results of an exploratory study. Physiol Behav. 2016; 1:3–9.
31. Cornier MA, Melanson EL, Salzberg AK, Bechtell JL, Tregellas JR. The effects of exercise on the neuronal response to food cues. Physiol Behav. 2012; 105:1028–34. [PubMed: 22155218]
A
uthor Man
uscr
ipt
A
uthor Man
uscr
ipt
A
uthor Man
uscr
ipt
A
uthor Man
uscr
ipt
Fig. 1.
Selection of subjects for the study (VAS, Visual Analog Scale; EI, energy intake; VO2,
maximal aerobic capacity; BC, body composition; EEG, electroencephalogram).
A
uthor Man
uscr
ipt
A
uthor Man
uscr
ipt
A
uthor Man
uscr
ipt
A
uthor Man
uscr
ipt
Fig. 2.
VAS ratings of satiety through both conditions (EX and CON) in lean and obese adolescents (no condition and no group effect). (CON, Control; EX, Exercise; VAS, Visual Analogue Scale; BF, Breakfast; COND, condition).
A
uthor Man
uscr
ipt
A
uthor Man
uscr
ipt
A
uthor Man
uscr
ipt
A
uthor Man
uscr
ipt
Fig. 3.
Mean amplitudes of the P3b elicited by Food and Non-food visual cues during the Control (CON) and Exercise (EX) sessions in lean (A, 380–480 milliseconds) and obese (B, 430– 530 milliseconds)) adolescents. **P < .01.
A
uthor Man
uscr
ipt
A
uthor Man
uscr
ipt
A
uthor Man
uscr
ipt
A
uthor Man
uscr
ipt
A
uthor Man
uscr
ipt
A
uthor Man
uscr
ipt
A
uthor Man
uscr
ipt
A
uthor Man
uscr
ipt
Table 1Anthropometric characteristics and body composition
Lean Obese Age (yo) 13.7 ± 1.1 13.9 ± 1.1 Weight (kg) 53.6 ± 9.8 89.6 ± 19.3*** BMI (kg/m2) 19.2 ± 1.7 31.6 ± 4.5*** FM (%) 12.9 ± 3.2 35.1 ± 6.4*** FFM (kg) 46.4 ± 6.9 56.1 ± 11.1**
Values are means ± SD; yo, years old; ***
P < .001; **
A
uthor Man
uscr
ipt
A
uthor Man
uscr
ipt
A
uthor Man
uscr
ipt
A
uthor Man
uscr
ipt
Table 2Energy intake and macronutrient ingestion
Lean Obese CON EX CON EX EI (kcal) 854 ± 362 744 ± 246 1091 ± 252 965 ± 214* REI (kcal) 769 ± 364 512 ± 274** 988 ± 249 592 ± 235*** Protein (%) 28.0 ± 7.2 28.1 ± 5.3 31.1 ± 5.5 31.8 ± 4.8 Fat (%) 16.4 ± 4.9 16.1 ± 4 17.5 ± 3.2 17.1 ± 3.3 CHO (%) 55.1 ± 11.1 52.2 ± 8.6 50.8 ± 8.3 50.4 ± 7.7 Values are means ± SD; CON, Control. EX, Exercise;
* P < .05; ** P < .01; *** P < .001;
A
uthor Man
uscr
ipt
A
uthor Man
uscr
ipt
A
uthor Man
uscr
ipt
A
uthor Man
uscr
ipt
T ab le 3Correlations between ener
gy intak
e and anthropometric characteristics and body composition on both CON and EX.
EI-CON EI-EX Corr elation coeff icient [95%CI] P Corr elation coeff icient [95%CI] P W eight (kg) 0.564 [0.197–0.792] .004 0.590 [0.235–0.806] .002 BMI (kg/m 2) 0.500 [0.110–0.756] .014 0.551 [0.180–0.785] .005 FM (%) 0.517 [0.133–0.766] .010 0.528 [0. 148–0.772] .008 FFM (kg) 0.476 [0.080–0.743] .020 0.519 [0.135–0.767] .010
CON, Control, EX, Ex
ercise; CI, conf
idence interv
als; BMI, body mass inde
x, FM, f
at mass; FFM, f
at-free mass; EI, ener
gy intak
A
uthor Man
uscr
ipt
A
uthor Man
uscr
ipt
A
uthor Man
uscr
ipt
A
uthor Man
uscr
ipt
T ab le 4 Correlations between Δ[Food – Nonfood] and EI, anthropometric characteristics and body composition on both CON and EX.
Δ[F ood – Non-F ood]: CON Δ [F ood – Non-F ood]: EX Corr elation coeff icient [95%CI] P Corr elation coeff icient [95%CI] P W eight (kg) 0.119 [−0.308–0.506] .593 −0.445 [−0.724 – −0.040] .032 BMI (kg/m 2) 0.126 [−0.302–0.511] .571 −0.498 [−0.755 – −0.108] .024 FM (%) 0.222 [−0.209–0.581] .312 −0.542 [−0.780 – −0.167] .006 FFM (kg) −0.021 [−0.429–0.395] .925 −0.255 [−0.604–0.176] .244 EI 0.329 [−0.096–0.653] .125 −0.264 [−0.610–0.166] .226
CON; Control, EX, Ex
ercise; CI, conf
idence interv
als; BMI, body mass inde
x, FM, f
at mass; FFM, f
at-free mass; EI, ener
gy intak