HAL Id: tel-02426026
https://tel.archives-ouvertes.fr/tel-02426026
Submitted on 1 Jan 2020HAL is a multi-disciplinary open access archive for the deposit and dissemination of sci-entific research documents, whether they are pub-lished or not. The documents may come from teaching and research institutions in France or abroad, or from public or private research centers.
L’archive ouverte pluridisciplinaire HAL, est destinée au dépôt et à la diffusion de documents scientifiques de niveau recherche, publiés ou non, émanant des établissements d’enseignement et de recherche français ou étrangers, des laboratoires publics ou privés.
Ismat El Haffar
To cite this version:
Ismat El Haffar. Physical modeling and study of the behavior of deep foundations of offshore wind turbines in sand. Civil Engineering. École centrale de Nantes, 2018. English. �NNT : 2018ECDN0021�. �tel-02426026�
Firstly, I would like to express my sincere gratitude to my supervisors Luc Thorel and Matthieu Blanc for the continuous support of my Ph.D study and related research, for their patience, motivation, and immense knowledge. Their guidance helped me in all the time of research and writing of this thesis.
I would like to thank my thesis committee members for all of their guidance through this process; your discussion, ideas, and feedback have been absolutely invaluable.
I wish to thank the IFSTTAR and the Région Pays de Loire for their financial support to the thesis grants, within the context of which this study has been conducted.
My sincere thanks also goes to IFSTTAR Centrifuge team (Patrick Gaudicheau, Philippe Audrain, Alain Néel, Stéphane Lerat, Frantz Buisson, Alexandre Jagu) for their technical support and assistance during the centrifuge experimental campaign and also because they give me the opportunity to join their team and accepted me in the centrifuge little family as a Phd student. My thanks also goes also to Thomas Lenoir, Sophie Ricordel, Sandra Escoffier, Alberto Bretschneider, Jean Pierre David and the other members of the laboratory for the great times I spent with them in the last three years.
I thank my colleagues for the stimulating discussions and for all the fun we have had in the last three years.
To my closer friends, I express my gratitude for their unconditional friendship, support and patience throughout these years.
I would especially like to thank my amazing family for the love, support, and constant encouragement I have gotten over the years. In particular, I would like to thank my parents, my brothers, and my sister. I undoubtedly could not have done this without you.
Abstract: ... i
Résumé Etendue………iii
Notations and Abbreviations ... xi
List of figures ... xv
List of Tables ... xix
1 General introduction ... 1
2 Pile subjected to axial loading ... 5
Introduction ... 7
2.1 Literature review ... 8
2.2 2.2.1 Methods of installation of piles ... 8
2.2.1.1 Bored piles ... 8
2.2.1.2 Driven piles ... 8
2.2.1.3 Jacked piles ... 9
2.2.2 Axial capacity of piles: tip and friction ... 10
2.2.3 Design methods ... 11
2.2.3.1 API and DNVGL ... 11
2.2.3.2 French Standard ... 13
2.2.3.3 ICP-05 method ... 14
2.2.4 Parameters that can affect the behaviour of piles ... 17
2.2.4.1 Installation methods ... 17
2.2.4.2 Pile tip ... 18
2.2.4.3 Sand density and saturation ... 19
2.2.4.4 Pile material and roughness ... 20
2.2.5 Conclusion ... 22
Experimental campaign ... 23
2.3 2.3.1 Centrifuge modelling ... 23
2.3.4 Pile roughness measurement ... 25
2.3.5 Grains size effects ... 26
2.3.6 Experimental campaign and tests table ... 28
Results analysis ... 31
2.4 2.4.1 Determination of ultimate capacity ... 31
2.4.2 Effect of the installation method ... 31
2.4.2.1 Pile installation and experimental campaign ... 32
2.4.2.2 Determination of shaft and tip resistance ... 33
2.4.2.3 Compression test analysis ... 34
2.4.2.4 Pull out tests analysis ... 36
2.4.3 Effect of sand density and saturation and pile tip type ... 39
2.4.3.1 Pile installation and experimental campaign ... 40
2.4.3.2 Bearing capacity tests ... 40
2.4.3.3 Pull out capacity tests ... 44
2.4.3.4 Ultimate load ... 46
2.4.3.5 Ratio of the tension to the compression resistance ... 47
2.4.3.6 Pile displacement until tension failure ... 48
2.4.3.7 Initial tension stiffness ... 50
2.4.3.8 Embedded volume versus jacking load ... 51
2.4.3.9 Comparison between experimental results and standards ... 54
2.4.3.9.1 Close-ended piles ... 54
2.4.3.9.2 Open-ended piles ... 58
2.4.4 Impact of pile roughness ... 59
2.4.4.1 Pile installation and experimental campaign ... 60
2.4.4.5 ICP comparison ... 67
Conclusion ... 72
2.5 3 Pile subjected to lateral loading ... 75
Introduction ... 77
3.1 Literature review ... 79
3.2 3.2.1 Classification of piles under lateral loading: flexible and rigid ... 79
3.2.2 Different types of loadings ... 79
3.2.3 Design of laterally loaded piles ... 80
3.2.4 Parameters that can affect lateral behaviour of piles ... 84
3.2.4.1 Pile installation method ... 84
3.2.4.2 Load eccentricity ... 85 3.2.4.3 Sand saturation ... 86 3.2.4.4 Effect of cycles ... 86 3.2.4.4.1 Global behaviour ... 87 3.2.4.4.2 Local behaviour ... 88 3.2.5 Conclusion ... 89 Experimental campaign ... 90 3.3 3.3.1 Model soil ... 90 3.3.2 Model pile ... 90
3.3.3 Experimental campaign and tests table ... 91
Results analysis ... 94
3.4 3.4.1 Pile installation and loading ... 94
3.4.2 Monotonic loading tests ... 96
3.4.2.1 Failure reference tests (rigid piles) ... 97
3.4.2.3.2 Moments profiles ... 107
3.4.2.3.3 Establishment and study of p-y curves ... 109
3.4.2.3.3.1 Impact of load eccentricity ... 109
3.4.2.3.3.2 Effect of sand saturation on the p-y curves ... 110
3.4.2.3.3.3 Effect of the installation method ... 111
3.4.2.3.3.4 Effect of the coefficient of the subgrade reaction ... 113
3.4.2.3.3.5 Quantitative comparison ... 114
3.4.3 Cyclic loading tests ... 115
3.4.3.1 Pile tests ... 116
3.4.3.2 Global study ... 119
3.4.3.2.1 Pile displacement at sand surface ... 119
3.4.3.2.2 Maximum moment ... 122
3.4.3.3 Cyclic p-y curves ... 123
3.4.3.3.1 Cylic p-y curves comparison ... 125
Conclusion ... 128
3.5 4 Conclusion and perspectives ... 131
5 References ... 137 Appendix 1 : Summary of the realized tests ... Appendix 2 : Model pile instrumented with strain gauges and pile calibration ... 1. Model pile ... A2-1 2. Lateral calibration: flexion beam ... A2-1 2.1 Calibration principales ... A2-1 2.2 Calculation of the gauges coefficients ... A2-2 2.3 Calculation of the maximum admissible loading ... A2-3 2.4 Calibration results ... A2-4
3.1 Calibration principles ... A2-6 3.2 Calculation of the maximum admissible loading ... A2-6 3.3 Calibration process ... A2-6 3.4 Axial coefficients ... A2-6 Appendix 3 : Centrifuge force inside the sand massif ... 1. Profile of the centrifuge force inside the sand model ... A3-1 2. Centrifuge force at the surface of the sand ... A3-3 3. Conclusion ... A3-4 Appendix 4 : Characterization of sand mass reconstituted in rectangular strongboxes ... 1. Determination of the unit dry weight of the pluviated sand ... A4-1 2. Pluviation parameters and prepared densities ... A4-1 3. CPT tests ... A4-4 Appendix 5 : Determination of the maximum and minimum dry unit weight ... 1. Determination of the relative density: ... A5-1 1.1 Determination of the minimum unit dry weight ... A5-1 1.2 Determination of the maximum unit dry weight ... A5-4 2. Application to Fontainebleau NE 34: ... A5-6 3. Uncertainty calculus: ... A5-7 4. Summary: ... A5-7 Appendix 6 : Laser particle size distribution ... 1. The laser size distribution experience ... A6-2 2. Test results ... A6-3 2.1 Intact Fontainebleau NE 34 sand ... A6-3 2.2 Results of the plugged Fontainebleau NE 34 sand inside the open piles ... A6-3 Appendix 7 : Sensors list ...
i
The axial and lateral capacity of piles jacked in Fontainebleau sand NE34 are studied using centrifuge modelling at 100×g.
The effect of the installation method, sand density and saturation, pile diameter and pile tip geometry (open or closed-ended) and pile roughness on the axial capacity of piles are firstly studied. A significant increase in the tension capacity is observed in cyclically-jacked piles unlike piles monotonically jacked at 100×g. The saturation of dense sand accelerates plug formation during pile installation. The increase in pile roughness and sand density increases significantly the shaft resistance of the piles tested here. For all the cases, pile capacities are compared with the current design codes for offshore wind turbines.
A parametric study of the effect of the installation method, load eccentricity and sand saturation on the lateral response of jacked piles is then realized using of an instrumented pile. The pile is loaded monotonically, then a thousand cycles are applied. A new methodology has been developed for determining of the constants needed in the integration procedure to identify the lateral displacement profile of the pile. The installation method influences directly the global (maximum moment and lateral displacement) and local behaviour (p-y curves) of the piles. The effect of the load eccentricity and sand saturation on the behaviour of the piles is also presented. In each case a comparison with the p-y curves extracted from the DNVGL code is realized.
iii
Les fondations profondes transfèrent les charges d'une structure vers des couches géologiques situées à plusieurs dizaines de mètres sous la surface du sol. Les pieux doivent équilibrer les charges axiales ou latérales, par les interactions avec le sol environnant. Dans le domaine offshore, ces charges peuvent varier de manière monotone ou cyclique (généralement une somme de cycles due au vent, aux vagues ou au courant), ce qui complique encore le dimensionnement des pieux en prenant en compte les variations de l'interaction sol-structure. Sous chargement axial, différents paramètres peuvent affecter la capacité axiale du pieu: méthode d'installation, diamètre du pieu, rugosité du pieu, géométrie de la pointe du pieu, densité et saturation du sable. Ces paramètres ont une influence directe sur la capacité de la pointe et sur le frottement latéral du pieu soumis à une charge axiale, ce qui génère des biais et des incertitudes multiples pendant le dimensionnement des pieux. Plusieurs études, réalisées dans le but de déterminer la capacité axiale des pieux, ont conduit à l’établissement des codes de dimensionnement, qui sont utilisés de nos jours pour le dimensionnement des pieux. Ces codes ne sont pas toujours bien adaptés aux applications offshore en raison de (1) les charges multiples appliquées sur les pieux et (2) les paramètres supplémentaires qui existent en milieu offshore par rapport au milieu onshore, comme la saturation totale du sable, la formation des bouchons dans les pieux ouverts et la complexité de la méthode d'installation.
Les charges latérales proviennent généralement des vagues, du courant, du vent et des tempêtes marines et sont appliquées à des excentricités différentes sur les structures offshores fixes. Les charges globales induisent sur les pieux, à des intensités différentes selon le type de structures et de fondations (monopieu, structure jacket sur pieux,…), des chargements monotones ou cycliques. Le dimensionnement des pieux sous chargement latéral est basé sur l'approche de transfert de charge appelée également courbes de réaction p-y. Cette méthode, basée sur la théorie des poutres, est largement utilisée pour dimensionner des pieux soumis à une charge latérale monotone, mais les effets des cycles ne sont pas encore bien identifiés. De plus, la capacité latérale d'un pieu peut également être affectée par la méthode d'installation du pieu, l'excentricité de la charge et la saturation du sable.
Pour mieux comprendre l’influence de ces paramètres sur la capacité axiale et latérale des pieux, une étude expérimentale paramétrique a été effectuée dans le sable de Fontainebleau NE 34 afin de quantifier l’effet de chaque paramètre sur le dimensionnement du pieu. La
iv
chargement et d'homogénéité du sable. Deux montages expérimentaux ont été développés pour réaliser l’étude souhaitée sous chargement axial ou latéral à 100×g sur des pieux modèles à l’aide de la centrifugeuse géotechnique de l’IFSTTAR-Nantes.
Les objectifs de cette thèse sont:
- Étudier l'effet de la méthode d'installation, du diamètre du pieu, de la rugosité du pieu, de la géométrie de la pointe du pieu (ouverte ou fermée), de la densité et la saturation du sable sur la capacité axiale du pieu.
- Évaluer la performance des codes de dimensionnement de pieux sous chargement axial par rapport aux résultats expérimentaux.
- Etudier l'effet de l'excentricité de la charge, de la méthode d'installation du pieu et de la saturation du sable sur le comportement global (moment et déplacement) et local (courbes p-y) des pieux.
- Comparer les courbes p-y de la DNVGL et les courbes p-y extraites d'expériences sur des pieux instrumentés chargés latéralement.
Cette thèse est décomposée en deux: la première partie montre les tests réalisés sur les pieux sous chargement axial et les résultats obtenus. Alors que, la deuxième partie montre les tests des pieux sous chargement latérale et les résultats obtenus.
46 expérimentations de chargement axial ont été réalisées en utilisant un vérin hydraulique fixé sur le conteneur de sable de Fontainebleau NE34. Ce montage expérimental permet de mettre en place des pieux en utilisant différentes méthodes d’installation (fonçage monotone à 1×g, monotone à 100×g et cyclique à 100×g en utilisant diffèrents pas de chargement). Afin d’étudier l’effet de la rugosité du pieu, de la formation du bouchon et de la densité et saturation du sable, neuf pieux modèles, de différents diamètres et rugosités ont été foncés de 250 mm à 100×g dans de sable moyennement dense et dense de Fontainebleau sec et saturé. L’étude sur l’effet de la méthode d’installation a été réalisée avec 6 tests à 100×g et de 250 mm de profondeur. Les méthodes d’installation réalisées sont le fonçage monotone à 1×g, le fonçage monotone à 100×g et le fonçage cyclique à 100×g avec des pas de fonçage allant de 2.5 mm à 25 mm. Cette étude a permis d’établir les résultats suivants :
v
offrent une capacité environ 8% plus élevée que celle des pieux cycliquement foncés. 2. L'impact des techniques d'installation sur la capacité de traction des pieux a été étudié.
La différence la plus significative a été constatée pour les pieux foncés à 100 × g, s'ils sont foncés d’une manière monotone ou cyclique. Malgré la limitation de l’étude à un test pour chaque méthode d’installation et à une densité étudiée, la capacité en traction des pieux a clairement tendance à augmenter avec l’augmentation du nombre de pas d’installation. Les résultats montrent un gain de capacité d'extraction allant jusqu'à 67% avec l'augmentation des pas d'installation cyclique. L'explication discutée dans cette étude suggère qu'il pourrait exister une relation entre le gain de capacité et la dilatation et l’écrasement du sable habituellement observés dans les cas où des surfaces rugueuses sont en contact avec du sable dense.
3. Pour les deux approches, une comparaison avec les normes de dimensionnement a été faite. Les standards de dimensionnement se sont révélés très conservateurs par rapport aux résultats expérimentaux. De plus, aucune approche n'a été trouvée dans ces méthodes pour prédire le gain de capacité trouvé dans les tests d'arrachement.
L’effet de la densité et de la saturation du sable est ensuite étudié en réalisant des tests dans des conteneurs de sable moyennement dense (Dr=58%) et dense (Dr=99%) sec ou saturé :
1. La présente étude suggère d’abord que la saturation du sable dense a une influence importante sur la création de bouchons lors de l’installation de pieux.
2. Les pieux installés dans du sable sec présentent des capacités supérieures à celles des pieux installés dans du sable saturé en traction et compression.
3. Le déplacement en traction jusqu'à la rupture diffère selon les conditions de densité et de teneur en eau. Ses valeurs ne sont pas toujours égales à la valeur conventionnelle de 10% de B.
4. La rigidité initiale est affectée par la densité et la saturation du sable. La rigidité initiale augmente avec la densité du sable, qui est cependant plus faible dans le sable saturé que dans le sable sec. Une relation linéaire entre la force de fonçage et le volume encastré des pieux testés est décrite.
Des tests réalisés avec des pieux en acier de 4 diamètres différents (12,14,16 et 18 mm) permet également de discuter l'effet du diamètre du pieu:
vi
2. Le rapport entre la capacité en traction et en compression diminue avec l’augmentation du diamètre.
L’étude sur l’effet de la géométrie de la pointe (ouverte ou fermée) a montré :
1. Les pieux ouverts ont des capacités en traction supérieures à celles des pieux fermés. 2. Le rapport capacité de traction/compression est systématiquement plus grand pour les
pieux ouverts que pour les pieux fermés.
Une comparaison entre les résultats expérimentaux et les codes de dimensionnement existants (NF, ICP-05 et API et DNVGL) utilisés pour la réalisation d'éoliennes en mer montre que:
- En mode compressif, les codes de dimensionnement étudiés révèlent différents degrés de conservatisme par rapport aux résultats expérimentaux. ICP est le plus proche des résultats expérimentaux. Vient ensuite NF, dont les résultats sont approximativement la moitié des capacités expérimentales. Enfin, nous trouvons API et DNVGL, qui sont les codes de conception les plus conservateurs et qui donnent des résultats allant de 20% à 35% des capacités expérimentales sans les limitations suggérées dans les codes. Avec l'utilisation de ces limitations, les deux normes sont encore plus éloignées de la représentation du comportement réel des pieux.
- En mode de traction, la performance ICP est bonne dans le sable dense. Cependant, ICP et NF fournissent une surestimation des capacités de traction du pieu dans le sable moyennement dense. API et DNVGL surestiment également la capacité de traction dans le sable moyennement dense, tout en la sous-estimant dans le sable dense. - La performance de la méthode ICP dans le cas de pieux ouverts semble dépendre de
l'estimation précise de l'état de création de bouchon du pieu et du choix de la meilleure condition de bouchon entre les différentes conditions disponibles trouvées dans le code.
L’effet de la rugosité de pieu sur sa capacité axiale a été étudié en utilisant deux pieux possédant deux rugosités différentes (Rn= 0.014 et 0.33):
1. L'augmentation de la rugosité montre que la résistance à la traction augmente de 36% dans le sable dense et de 57% dans le sable moyennement dense. De plus, le
vii
moyennement dense. De plus, les pieux lisses révèlent des résistances de frottement à l’enfoncement et à l'arrachement quatre fois plus élevées dans le sable dense que dans le sable moyennement dense.
3. Le rapport de résistance au frottement entre la traction et la compression est de 0,8 dans le sable dense et de 1 dans le sable moyennement dense pour les pieux lisses. Les pieux rugueux présentent un frottement à l’enfoncement environ trois fois supérieur au frottement à l'arrachement dans les deux densités.
4. La comparaison des résistances expérimentales de frottement avec les résistances obtenues en utilisant les méthodes ICP montre que l'utilisation d'un angle de frottement de 15 ° et 20 ° pour des pieux lisses fournit une bonne estimation du frottement latéral déduit de l’ICP dans les sables à la fois moyennement denses et denses. Par ailleurs, 25 ° et 30 ° sont les angles de frottement utilisés dans l’ICP respectivement à afin de faire correspondre le frottement de traction des pieux rugueux dans le sable moyen et dense.
Les pieux offshore de structures jacket sont soumis non seulement à des charges axiales, mais également à de lourdes charges latérales provenant des vagues, du courant et du vent. Cela rend nécessaire d'étudier ces fondations également sous des chargements latéraux. Après l’étude réalisée sur les paramètres influençant la capacité axiale des pieux, cette thèse se concentre sur la capacité latérale des pieux.
Un nouveau montage expérimental, qui permet non seulement le fonçage en vol du pieu, mais également son chargement latéral en vol sans arrêter la centrifugeuse a été développé. Cela peut être réalisé en ajoutant un vérin électrique latéral au montage développé précédemment pour étudier la capacité axiale du pieu. De plus, un nouveau pieu modèle instrumenté a été développé possédant 16 niveaux de jauges à l'échelle 1/100 avec une profondeur d'encastrement de 200 mm. Ce pieu a été testé, en utilisant la centrifugeuse géotechnique à 100 × g, afin de déterminer les effets de la méthode d'installation (fonçage à 1×g et fonçage à 100×g), de l'excentricité du chargement et de la saturation du sable sur le comportement latéral de pieu sous chargement monotone et cyclique.
Une nouvelle méthode est développée pour la détermination des constantes requises pour la procédure d'intégration utilisée pour déterminer le profil de déplacement latéral du pieu. L'identification de la deuxième constante consiste à déterminer le centre de rotation du pieu à
viii
courbes p-y des tests effectués sur des pieux instrumentés, même si une seule condition limite peut être mesurée de manière fiable au cours des tests.
Après l’identification de la méthode de la double intégration, les effets de la méthode d’installation, de l’excentricité de la charge et de la saturation du sable sur le comportement global (déplacement du pieu et moment) et local (courbes p-y) sont déterminés.
A. Pour l'analyse de chargement monotone:
1. L’excentricité croissante de la charge produit une réponse plus douce des courbes p-y. DNVGL ne prend pas en compte l'effet de ce paramètre. Comme les effets
d'excentricité de la charge ne sont pas très importants et pour des raisons pratiques, nous suggérons d'utiliser le même ensemble de courbes p-y pour évaluer la réponse du pieu lorsque différentes excentricités de la charge sont appliquées.
2. La saturation du sable s'est avérée être un paramètre important: 1) elle peut affecter le déplacement latéral avec une augmentation pouvant atteindre 57% du déplacement par rapport au sable sec. 2) la saturation du sable moyennement dense a entraîné une réponse plus faible d'environ 40% des courbes p-y par rapport au sable sec.
3. L'installation en vol de pieux provoque une diminution de 24% du déplacement latéral des pieux à la surface du sable. Ils ont également des valeurs maximales de moment inférieures et moins profonds qu’aux moments maximaux des pieux foncés à 1 × g. Les résultats précédents peuvent être attribués à la densification des couches de sable en surface. Les courbes p-y correspondant à ces pieux présentent un seuil final
supérieur de 70% et une réponse initiale jusqu'à 45% plus rigide que les pieux installés à 1 × g.
La comparaison avec les courbes p-y du code DNVGL a montré que le code ne prend pas en compte l’effet de l’excentricité et de la méthode d’installation sur les courbes p-y. Pour le sable sec, la DNVGL a montré une rigidité 7 fois supérieure à celle expérimentale. Par contre, pour le sable saturé, le DNVGL était 4 fois plus élevé.
B. Pour l'analyse du chargement cyclique (jusqu'à 1000 cycles):
Le moment maximum dans le pieu au cours des cycles est analysé et il a été montré que sa valeur diminuait et devenait moins profonde avec l’augmentation du nombre des cycles. Le déplacement à la surface du sable est également présenté. Un examen détaillé et une
ix
1. L’accumulation du déplacement latéral du pieu diminue avec l’augmentation de l’excentricité, mais l’excentricité de la charge ne semble pas avoir d’effet important sur le développement des courbes cycliques p-y.
2. La saturation du sable montre une légère diminution de l’accumulation de
déplacement latéral mais ne semble pas avoir d’effet important sur le développement des courbes cycliques p-y.
3. L'installation du pieu en vol induit généralement une diminution de l'accumulation du déplacement. En ce qui concerne les courbes p-y, les faibles profondeurs ont montré une amélioration de la réaction du sol à un meilleur taux pour le pieu installé à 1 × g par rapport au pieu installé en vol. Par contre, dans les profondeurs importantes, le pieu installé en vol présente un taux de dégradation plus élevé au cours des cycles que le pieu installée à 1 × g.
xi
Ab The gross end area of the pile
As The side surface area of pile
B Pile diameter
Binner Inner diameter of the pile (m)
Ci Calibration coefficient
D Embedment length
Dr Relative density (%)
Dt Tension displacement
EM Pressiometric modulus
The modulus of elasticity of the pile The modulus of elasticity of the soil Fr Failure force
G Centrifuge acceleration H Horizontal applied load
Hc The half amplitude of the cyclic component
Hm The mean value of the applied lateral load
Hmin The minimum horizontal load in the cycles
Hmax The maximum horizontal load in the cycles
The moment of inertia of the pile K The coefficient of lateral earth pressure M Moment
xii
P The perimeter of the foundation � Radius of the application stresses
� Radius between the rotation axes of the machine and the strongbox surface � Centrifuge radius
Rb Tip capacity
Rc Compression resistance
Rinner Inner radius
Router Outer radius
� ax Depth of asperities
Rn Normalized roughness
� Radius of the application of the centrifuge acceleration Rs Shaft friction resistance
Rt Tension resistance
Rz The maximum height of the pile surface profile
R* Modified radius
Uc Coefficient of uniformity
� Inside volume of the test mold
Latinas lowercases
d50 Mean diameter of the sand
dx The grain size, at which x% of particles by weight are smaller
Void ratio of the material
xiii
f The unit skin friction capacity
f Function dependent on the type of the soil and the values of q Earth gravity
h Model height
hp Correspond to the prototype notation of h
hm Correspond to the model notation of h
k Bearing factor dependent on the type of the soil and the installation method of the pile Mass of the mold and it content
Dry weight of the sand Mass of the empty test mold Porosity
qb Base capacity
qc CPT resistance
p Soil reaction
y Lateral displacement
yN Lateral displacement at the N cycle
z Depth coordinate
ω Rotation speed of the centrifuge
Greeks uppercases
∆ Increment of soil length inside the pile ∆ Increment of pile penetration depth
xiv
Density
The unit dry weight of the material
� Minimum dry unit weigh � Maximum dry unit weigh
The dry unit weight of the solid particles � The internal critical state friction angle � Vertical stress
σ′ The effective overburden pressure at the point in question Δ The friction angle between the soil and pile wall
α Degradation factor of the lateral displacement
α i − Dimensionless parameter which depend on the type of the pile and the type of the soil τ The local shear stress
xv
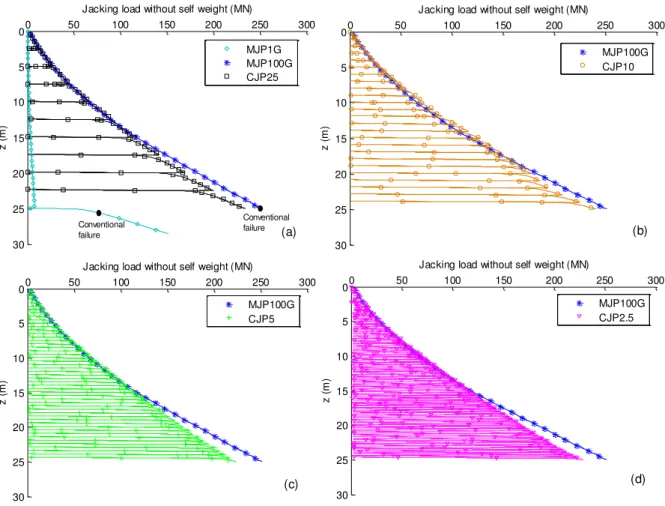
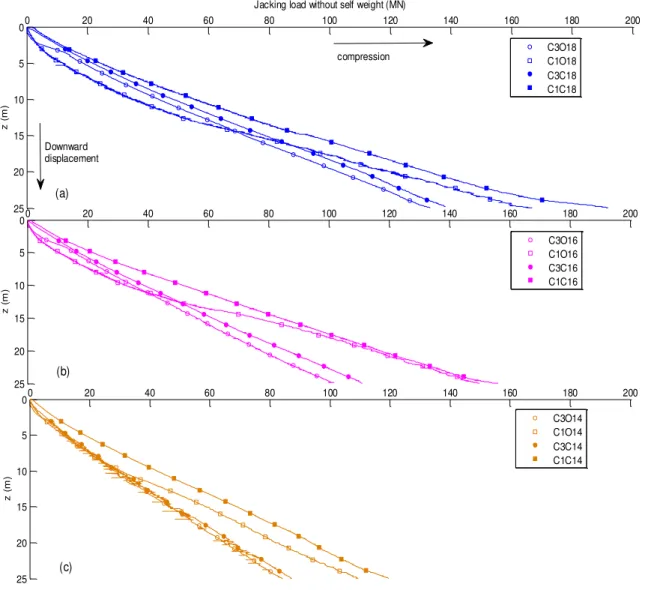
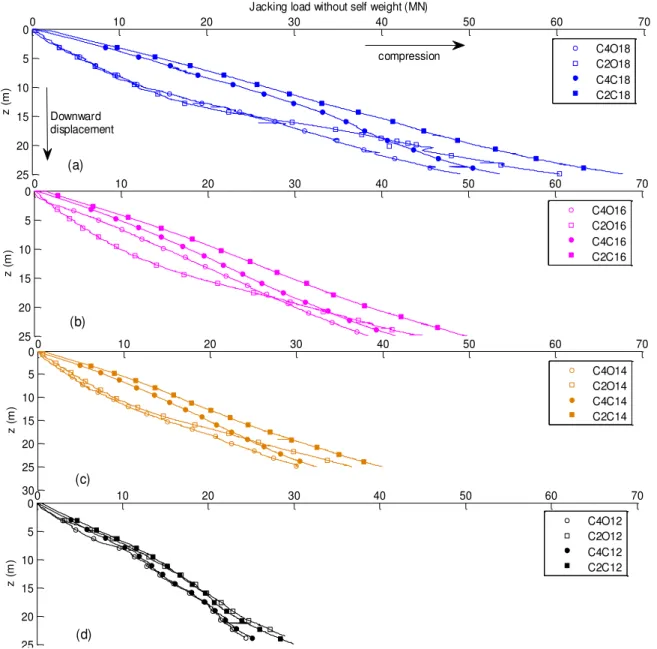
Figure 2-2: Axial capacity of pile decomposition ... 10 Figure 2-3 : Detail of the rough instrumented model pile (pile 1 diameter=18mm) ... 25 Figure 2-4 : Smooth model pile ... 25 Figure 2-5 : (a) Experimental set up (inside dimensions), (b) Rough instrumented model pile ... 27 Figure 2-6 : Roughness profiles ... 27 Figure 2-7 : Jacked pile using strokes of 2.5m ... 33 Figure 2-8 : Shaft and tip resistance decomposition ... 34 Figure 2-9 : Jacking load without self weight versus penetration depth for MJP100G (reference) and (a) MJP1G and CPJ25 – (b) CJP10 – (c) CJP5 – (d) CJP2.5 ... 36 Figure 2-10 : Pull out tests ... 37 Figure 2-11 : Jacking load of piles installed in saturated or dry dense sands (a) B=1.8m (b) B=1.6m (c) B=1.4m ... 42
Figure 2-12 : Jacking load of piles installed in saturated or dry medium dense sands (a) B=1.8m (b) B=1.6m (c) B=1.4m (d) B=1.2m... 43
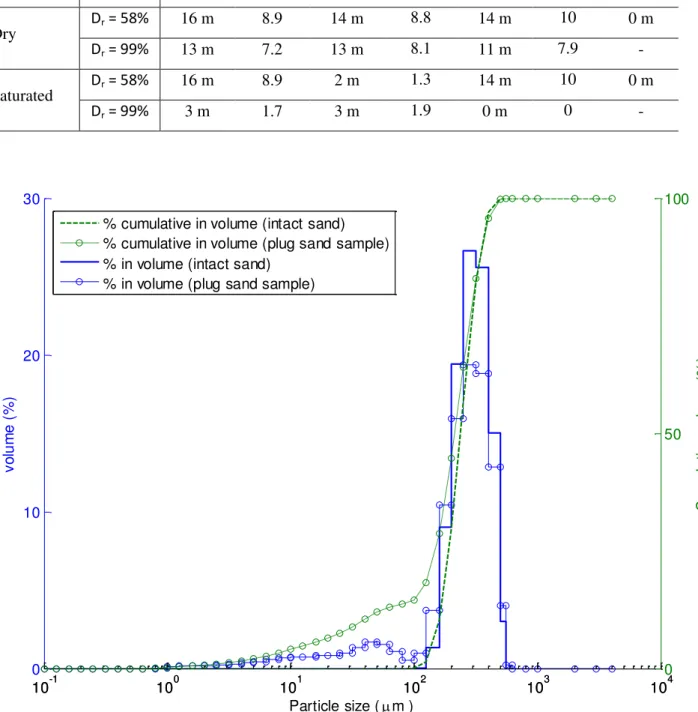
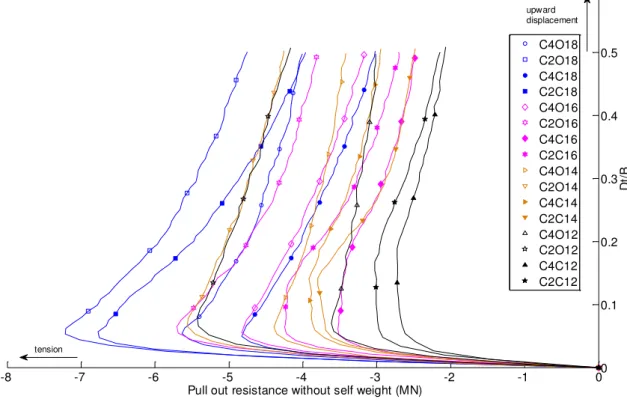
Figure 2-13 : Particle size distribution for intact Fontainbleau sand and plug sand sample .... 45 Figure 2-14 : Pull out resistance of piles installed in saturated or dry dense sands ... 46 Figure 2-15 : Pull out resistance of piles installed in saturated or dry medium dense sands ... 46 Figure 2-16 : Ultimate capacity in compression mode (Rc) and in tension (Rt): (a) Rc for dry sand – (b) Rc for saturated sand – (c) Rt for dry sand – (d) Rt for saturated sand ... 47 Figure 2-17 : Tension/compression capacity: (a) for dense and dry sand – (b) for dense and saturated sand – (c) for medium dense and dry sand – (d) for medium dense and saturated sand ... 49 Figure 2-18 : Pile failure displacement ratio: (a) for dry sand – (b) for saturated sand – Pile failure displacement ratio (c) for dry sand – (d) for saturated sand ... 50 Figure 2-19 : Initial pile tension stiffness: (a) for dry sand – (b) for saturated sand ... 51 Figure 2-20 : Closed pile embedded volume versus jacking load: (a) for dense and dry sand – (b) for dense and saturated sand – (c) for medium dense and dry sand – (d) for medium dense and saturated sand ... 52
xvi
saturated sand ... 53 Figure 2-22 : Experimental vs design codes results (compression) ... 57 Figure 2-23 : Experimental vs design codes results (tension) ... 57 Figure 2-24 : Open piles in C2: (a) for C2O18 – (b) for C2O12 ... 59 Figure 2-25 : Shaft and tip resistance decomposition of pile PSD ... 61 Figure 2-26 : PRD/PSD comparison ... 62 Figure 2-27 : PRM/PSM comparison ... 63 Figure 2-28 : PRD/PRM comparison ... 65 Figure 2-29 : PSM/PSD comparison ... 66 Figure 2-30 : PSD/ICP comparison ... 69 Figure 2-31 : PSM/ICP comparison ... 70 Figure 2-32 : PRD/ICP comparison ... 71 Figure 2-33 : PRM/ICP comparison ... 71 Figure 3-1 : p-y model for lateral loading ... 78 Figure 3-2 : Parameters of the cyclic lateral loading ... 80 Figure 3-3 : Initial modulus of subgrade reaction k as function of friction angle ... 83 Figure 3-4 : Coefficients as functions of friction angle ... 84 Figure 3-5 : Experimental set up (inside dimensions) ... 95 Figure 3-6 : loading sequence of flexible piles ... 96 Figure 3-7 : Failure force interpretation ... 98 Figure 3-8 : DFL1g: (a) pile deflection (b) pile rotation (c) moment profiles (d) shear force (e) soil reaction ... 102 Figure 3-9 : Principle of determination of the second constant for lateral displacement integration ... 103 Figure 3-10 : Depth for y=0 using both methods of constant identification for DFL1g ... 104 Figure 3-11 : Depth for y=0 using the incremental method ... 104 Figure 3-12 : H vs. displacement at sand surface ... 106 Figure 3-13 : Moment vs. pile rotation at sand surface ... 106 Figure 3-14 : Pile rotation vs. displacement at sand surface ... 107 Figure 3-15 : Moment profiles ... 108 Figure 3-16 : Effect of eccentricity on p-y curves in dry sand (DFL1g vs DFH1g) ... 110 Figure 3-17 : Effect of saturation on p-y curves ... 111
xvii
Figure 3-20 : DH1g: (a) pile deflection (b) pile rotation (c) moment profiles (d) shear force (e) soil reaction ... 117 Figure 3-21 : Principle of determination of the second constant for lateral displacement integration ... 118 Figure 3-22 : Effect of saturation and installation method and eccentricity on the lateral displacement of piles ... 120 Figure 3-23 : Effect of saturation and installation method and eccentricity on the pile rotation at sand surface ... 122 Figure 3-24 : Cyclic p-y curves DH1g ... 125 Figure 3-25 : Effect of the installation method on cyclic p-y curves ... 127 Figure 3-26 : Effect of the eccentricity on cyclic p-y curves ... 127 Figure 3-27 : Effect of saturation on cyclic p-y curves ... 128
xix
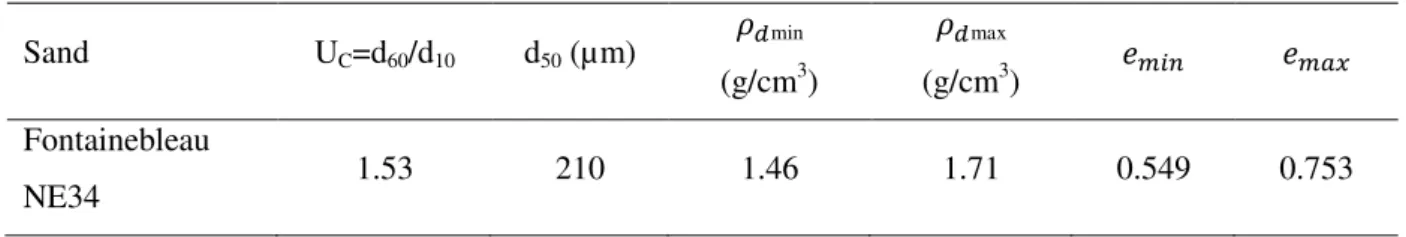
Table 2-2: Scale factors ... 23 Table 2-3 : Characteristics of the Fontainbleau NE34 sand ... 24 Table 2-4 : Model piles (model scale) ... 25 Table 2-5 : Experimental campaign ... 28 Table 2-6 : Transition table for tests nomenclature ... 32 Table 2-7 : Static ultimate capacities in compression and tension (prototype values) ... 35 Table 2-8 : Transition table for tests nomenclature ... 39 Table 2-9 : Depth of plug formation ... 45 Table 2-10 : Static ultimate capacities in compression and tension modes (prototype values) 55 Table 2-11 : Transition table for tests nomenclature ... 60 Table 2-12 : Static ultimate capacities in compression and tension modes (prototype values) 64 Table 2-13 : Effect of the studied parameters on Rc and Rt... 74
Table 3-1 : Coefficient A in function of sand density ... 81 Table 3-2 : Mean values of Es for cohesionless soil... 82
Table 3-3 : Overview of values put forward for the coefficient α in the case of sandy soils ... 88 Table 3-4 : Experimental campaign ... 92 Table 3-5 : transition table for tests nomenclature ... 97 Table 3-6 : Failure test analysis ... 99 Table 3-7 : Analysis of the maximum moments for Hmax ... 109 Table 3-8 : p-y curve comparison ... 114 Table 3-9 : p-y curve stiffness at 0.5% of y/B ... 115 Table 3-10 : transition table for tests nomenclature ... 116 Table 3-11 : lateral displacement in mm ... 120 Table 3-12 : lateral displacement fitting ... 121 Table 3-13 : Evolution of the moment with cycles ... 123 Table 3-14 : stiffness in MN/m ... 125
3
Deep foundations transfer the loads of a structure towards geological layers located several tens of meters below the soil surface. The piles have to equilibrate axial or lateral loading, by the interactions with the surrounding soil. In the offshore domain, these loadings may vary as monotonic or cyclic (typically a summation of cycles due to wind, wave or current) which makes the design of the piles even more complicated in taking into account the variations of soil-structure interaction.
Under axial loading, different parameters can affect the axial capacity of the pile: installation method, pile diameter, pile roughness, pile tip geometry, sand density and saturation. These parameters influence directly the tip capacity (and bearing) and the shaft resistance of a pile submitted to axial loading, which put the design of the pile under multiple bias and uncertainties. Several studies, realized in order to design the axial capacity of piles, have led to establishing design codes, which are used nowadays for pile design. These codes are not always well adapted to offshore application because of (1) the multiple loadings applied on piles and (2) the additional parameters that exist in offshore in comparison with onshore area like full sand saturation, pile plugging and the complexity of the installation method.
Lateral loadings are usually originated from waves, current, wind and offshore storms and
are applied at different eccentricity on the fixed offshore structures. The global loads induce on the piles, at different intensities depending on the type of structures and foundations (monopole, jacket on piles, …), monotonic or cyclic loading. Cyclic lateral loadings can be characterised by four parameters, additionally to the period: the maximum applied load (Hmax), the cycle amplitude (Hc), the cycles number (N) and the type of the cyclic loading
(one-way or two-way). The design of piles under lateral loading is based on the load-transfer approach called also p-y curves. This method based on the beam theory, is widely used to design pile under monotonic lateral loading, but the effects of cycles are not well identified yet. Moreover, the lateral capacity of a pile can also be affected by the installation method of the pile, the load eccentricity and the sand saturation.
For a better understanding of the influence of these parameters that affect the axial and lateral capacity of piles, a set of parametric experiments has been performed in Fontainebleau NE34 sand, to quantify the effect of each parameter on pile design. Centrifuge modelling is considered as the best solution to make such type of parametric tests in economical way and under controlled condition of loading and sand homogeneity. The use of instrumented model piles makes possible to analyse the effect of each parameter on pile capacity. This is why two
4
experimental set-ups have been developed in order to realize the desired study under axial or lateral loading on model piles using the beam geotechnical centrifuge of IFSTTAR-Nantes. The objectives of this thesis are:
- To study the effect of installation method, pile diameter, pile roughness, pile tip geometry (open or closed-ended), sand density and sand saturation on the axial capacity of pile.
- To evaluate the performance of design codes used to design pile under axial loading toward the experimental results.
- To study the effect of load eccentricity, pile installation method and sand saturation on the global (moment and displacement) and local (p-y curves) behaviour of piles. - To compare the DNVGL p-y curves and the p-y curves extracted from experiments on
instrumented laterally loaded piles.
This report includes two chapters, where the data is presented at the prototype scale:
The first, one begins with a literature review on the parameters affecting the axial capacity of piles (installation method, pile diameter, pile tip geometry, sand density and saturation, pile roughness). Then, is presented the experimental set-up and the tests campaign realized. Finally the experimental results as well as the comparison with the design codes is analysed and discussed.
The second chapter focuses on lateral loading where a literature review on the different types of lateral loadings and the parameters (the installation method of the pile, the load eccentricity and the sand saturation) which can affect the lateral behaviour of piles is firstly presented. The new experimental set-up and the results of the realized tests are then presented and discussed. A set of 8 appendixes presents the results at the model scale of each test, as well as ancillary information linked to the experiments.
5
7
Introduction
2.1
With the increasing size of the civil construction structures, the use of piles shows a greater interest. The increase of the size of the structures lead to that their weight increases proportionally. As consequence the traditional ways of the use of shallow foundation is not sufficient. Nowadays, the use of piles under these types of structures in order to transfer the load to deeper layers of soil is the leading solution.
In the offshore domain, the use of piles to maintain oils and gas structures was also widely used from the beginning of the exploitation of the offshore environment. Moreover, the construction of the offshore wind turbines profited from the development that was initially realized in the design of offshore piles in the construction of the oil and gas structures. Their design methods were applied to the foundation of the offshore wind turbines. But the fact that the condition in which the offshore wind turbines are constructed is different from the condition of the oil structure implies a lot of uncertainty about the use of the same design methods. The oil and gas platforms are heavy with high self-weight. Heavy self-weight (from 500 and up to 10000 tonnes) implies that the platform piles are in a compressed condition even when the structure is subjected to severe weather impacts tending to lift the platform. Conditions are different as regards offshore wind structures (smaller than 800 tonnes). Weather, in this case, may generate direct actual uplift loads on the piles, which must then be carefully designed to resist such stress.
The uncertainty that exist in the construction of the deep foundation of the offshore wind turbines makes necessary to study the different methods used in their design. This chapter will present the different methods used nowadays in the design of the foundation of the offshore wind turbines and the bias that exist about these methods. Moreover, the different parameters that have an influence on the design of the pile under axial loading are also presented.
The literature review will be followed by a presentation of the experimental campaign that was realized in this thesis in order to address the problem of uncertainty related to the design of offshore piles using centrifuge testing. The results of this experimental campaign are finally presented and analysed.
8
Literature review
2.2
2.2.1 Methods of installation of piles
Different methods of the installation of the piles exist. These methods can have an important influence on the axial capacity of the pile. According to the used method the soil around the pile at the end of the installation can be denser or looser than it initial state. This can impact directly the axial capacity that the pile can develop during its life time. The most used methods are presented as:
Bored piles Driven piles Jacked piles
2.2.1.1 Bored piles
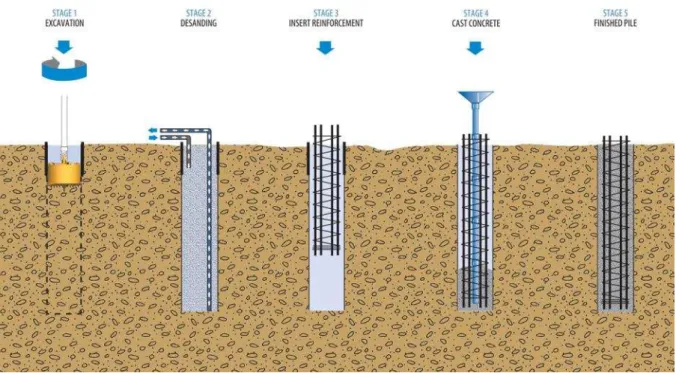
Bored piles known also as replacement piles were widely used in the past years due to the fact they are practical in big structure where large number of piles are needed. They are a commonly-used form of building foundation that provides support for structures, transferring their load to deeper layers of soil or rock that have sufficient bearing capacity and suitable settlement characteristics. They are popular in urban areas as there is minimal vibration. They are essentially preferred when the concrete piles are used. The principle of the construction of this type of piles is based on drilling a hole in which the steel reinforcement will be placed and the concrete will be poured in the case of concrete pile (Figure 2-1) or the pile tube will be placed in the case of steel piles.
During the construction of this type of piles they create a lot of perturbations in the soil which impact lately the axial capacity of the bored pile. Although the practical use of this type of piles, this installation method is considered to create piles that have the smallest axial capacity between all the cited installation methods.
2.2.1.2 Driven piles
Driving piles is considered as a displacement method because of the fact that the pile displaces the soil during its installation. The driving of these piles is realized with the use of large driving machines. As consequence, driving piles into the soil cause a high level of noise and ground vibration as well as ground movement. This is why it is not preferable for urban
9
use. But this method is the main method used in the installation of the offshore piles which are the main objective of the studies in this thesis.
In the literature, the use and capacity of driven piles are extensively studied (Randolph et al. 1994; Jardine et al. 2005; Puech and Benzaria 2013). These studies have helped to reduce the uncertainty related to the axial capacity of driven piles. They have initiated the development of approaches and standards nowadays widely used in pile design (e.g., API, DNVGL, Eurocode 7, ICP (Jardine et al. 2005)).
2.2.1.3 Jacked piles
This method is developed as an alternative to the driving method in the urban area when piles with high level of axial capacity are needed. It is also considered as a displacement method and consists of jacking the piles in the soil with the use of a large hydraulic jack.
The use of jacked piles has received increasing attention in the past few years. The possibility of jacking piles without noise and vibration is indeed more suitable for urban use and more acceptable by current European recommended limits for noise and vibration (Eurocode 3, White et al. 2002). However, compared to driven piles, jacked pile behaviour remains largely unknown and little research has been devoted to the comparison of their respective capacities (Yu et al. 2012; Yang et al. 2006a).
10
2.2.2 Axial capacity of piles: tip and friction
The axial capacity of piles can be decomposed, in compression (Rc), to the shaft friction capacity (Rs) and the tip capacity (Rb). On the other hand, in tension (Rt) the capacity of the pile is generated only by the shaft friction (Figure 2-2).
Rc = Rs + Rb and Rt = Rs (1)
The shaft friction is generated from the contact between the pile and the lateral soil and depends on the level of contact of the pile with the surrounding soil. The pile installation method is the most important factor that can influence the shaft friction of the pile. The tip capacity is generated by the capacity of the soil compressed under the tip of the pile. It can be influenced by the installation method of the pile, it geometry and the shape of the tip.
Figure 2-2: Axial capacity of pile decomposition
R
cR
tR
b11
2.2.3 Design methods
Different design methods were developed in order to better design the pile foundations. In general the methods used in designing the piles are empirical or semi-empirical methods and they derived from laboratory or in-situ tests. These methods predict separately the shaft resistance and the tip capacity of the pile. In this section the design methods used in the design of piles in sand are presented.
The shaft resistance Rs and the tip capacity Rbare generally given by:
Rs = fAs and Rb = Abqb (2)
Where:
f is the unit skin friction capacity As is the side surface area of pile qb is the unit end bearing capacity Ab is the gross end area of the pile
2.2.3.1 API and DNVGL
The API (American Petroleum Institute) standard developed by the American oil and gas industry is used to design offshore foundations of the oil and gas structures. DNV GL (2016) is based on the standard Design of offshore wind turbine structures (DNV 2004) and represents the current state of the art for design of the pile of the offshore wind turbines. API and DNVGL give similar formula for the design of offshore pile capacity.
Both standards are based on the hypothesis that the shaft friction and tip capacity increase linearly with the effective vertical stress �′.
The unit skin friction is given for a depth z as: = �′ z
(3)
where:
is the dimensionless shaft friction factor for sands. �′ is the effective overburden pressure at the depth z
12
In the absence of specific data, β values for open-ended pipe piles that are driven unplugged may be taken from Table 2-1. For full displacement piles (i.e. closed-ended or fully plugged open-ended piles) values of β may be assumed to be 25 % higher than those given in Table 2-1. For long piles, f(z) does not necessarily increase linearly with the overburden stress as implied by Equation 3. In such cases, it may be appropriate to limit f to the values given in Table 2-1.
The unit bearing capacity is computed using:
qb(z) = �′(z) Nq (4)
Nq is a dimensionless bearing capacity factor given in Table 2-1. According to the pile type,
the bearing capacity may be assumed to act over the entire cross section of the pile for plugged piles or on the pile annulus only for unplugged piles.
Although that the shaft friction and tip capacity are considered to increase linearly with the effective vertical stress, the standard gives limit values for the unit skin friction and the unit bearing capacity which can be used in the case of long piles. The use of limit values assumes the existence of a critical depth beyond which the shaft and tip capacities remain constant. The existence of a linear relationship between tip resistance and pile depth appears in many works found in the literature (e.g. Jamiolkowski et al. (2003), Kim et al. (2016)). Kim et al. (2016) show that this linear relationship exists up to a critical depth, beyond which the tip resistance is then almost constant. The hypothesis of the existence of the critical depth is well presented in Silva (2014). He cited that several authors have reported the measurement of limiting values, in laboratory model tests and in full-scale field tests (Kerisel 1961, Biarez and Gresillon 1972, Hanna and Tan 1973, Meyerhof 1976). Vesic 1970 realized field tests on instrumented piles and found that the increase of base resistance with increasing depth isn’t linear and that the rate of increase, decreases with depth. Poulos and Davis 1980 suggested that the critical depth can be defined in the range of 10-20 times pile diameter after which a constant value should be considered. On the other hand, Silva (2014) explained also that several authors such as Kulhawly (1984), Fellenius and Altaee (1995), Kraft (1991), Randolph et al. (1994) have discussed the reality of a limiting value arguing that this idealization has little support and is difficult to explain in physical terms. Randolph et al. (1994) explained that nowadays it is commonly accepted that for a homogenous sand deposit the end-bearing resistance will continue to increase with depth but at a gradually decreasing rate.
13
Table 2-1 : Design Parameters for Cohesionless Siliceous Soil (API standard)
Density Soil description Shaft Friction factor, Limiting skin friction values (kPa) Nq Limiting Unit End Bearing Values (MPa) Very Loose Loose Sand Not applicable
Loose Sand-Silt Not applicable Not
applicable Not applicable Medium Dense Silt Medium Sand-Silt 0.29 67 12 3 Medium Sand 0.37 81 20 5 Dense Sand-Silt Dense Sand 0.46 96 40 10
Very Dense Sand-Silt
Very Dense Sand 0.56 115 50 12
2.2.3.2 French Standard
In the French standard, the determination of the tip and shaft resistance of the pile is based on the CPT tests or on pressuremeter test, but the main principles are similar. Many empirical values are also given in tables presented in the standard and used during the determination of the resistances.
The tip resistance formula in the NF 94 262 is directly related to the CPT profile and given as:
= (5)
is a “bearing factor” dependent on the type of the soil and the installation method of the
pile and given in the table G.4.2.1 page 141 of the French standard. q is calculated using the following formula :
14 with :
a= max{B/2,0.5m} where B is the width of the foundation is the corrected CPT profile
h the height embedment of the foundation b= min(a,h)
The lateral friction is given as:
� = � . ∫� . (7)
� is the perimeter of the foundation
is the unitary lateral friction at z given by this formula :
= � − [ ] (8)
is the CPT resistance smoothed at the depth z.
� − is an dimensionless parameter which depend on the type of the pile and the type of
the soil and given in the table G.5.2.2 of the French standard.
is a function dependent on the type of the soil and the values of q .
The f functions are defined for the different type of soils by the following equations:
= + − −
(9) The coefficients a,b and c are given in table G.5.2.2 of NF 94-262.
2.2.3.3 ICP-05 method
ICP (Imperial College Pile) is an empirical method based on tests realized using an instrumented pile on principally 6 sites between France and the UK. The pile is a 102 mm cylindrical steel pile with a conical tip. The sensor placed at it tip make possible the separation of the shaft and tip resistance.
Shaft friction of cylindrical piles The shaft capacity is given as:
15
� = ∫ � (10)
The local shear stress is :
� = �′tan (11)
is the interface angle of friction at failure and �′ is decomposed into two parts the local
radial effective stress �′ and the dilatant inc²rease in local radial effective stress during pile
loading ∆�′ :
�′ = �′ + ∆�′
(12) The local radial effective stress �′ is given as :
�′ = . �′/� . ℎ/� − . (13)
�′ is the free-field vertical effective stress
� = 100 kPa is the absolute atmospheric pressure h : relative depth to tip.
R : pile radius ( R =( R2outer - R2inner)0.5 for the case of open-ended piles)
h/R is limited to a minimum value of 8
The dilatant increase in local radial effective stress during pile loading is given as:
∆σ′ = G∆r/R (14)
G : sand shear stiffness
∆ = R = .
� : Pile roughness In the tension case :
This equation �′ = . �′ + ∆�′ is used in place of the equation (12) for close-ended pile.
For open-ended pile in tension �′ = . . �′ + ∆�′ will be used in place of (12). Base capacity of closed-ended cylindrical piles
The determination of the base resistance is derived in this approach from CPT. A good selection of the qc is mandatory as it can have an important effect on the tip capacity
16
calculation. ICP approach follows the suggestion of Bustamante & Gianeselli 1982 to average qc over 1.5 pile diameters above and below the pile toe, providing that (i) the variation in qc
are not extreme and (ii) the depth intervals between the peak and trough qc values are no
greater than B/2. ICP mentioned that a qcvalue below the mean should be adopted for design, if these conditions are not met as the base capacity may be controlled by a localized failure within any significant weaker layer.
The base capacity for closed-ended pile is given as:
Rb = qbπB2/4 (15)
Where
qb = qc[1-0.5log(B/BCPT)] (16)
qc average CPT end resistance at the founding depth.
B and BCPT are the relative pile and CPT diameters.
A lower limit of qb = 0.3 qcis suggested for piles with B>0.9 m. Base capacity of open-ended cylindrical piles
ICP differed several formulas for the determination of the base capacity of open-ended piles according to the state of the plugging that pile exhibits at the end of the installation.
A rigid basal plug is considered to develop during static loading if the following criteria are satisfied:
Binner < 0.02 (Dr– 30) Binner is in meters and Dr in % (17) Binner/BCPT < 0.083 qc/ Pa Absolute atmospheric pressure Pa (18)
Fully plugged piles are considered to develop 50% of the end resistance of closed-ended piles of the same diameter after a pile head displacement of B/10:
Rb = qbπR2outer (19)
qb= qc[0.5-0.25log(B/BCPT)] (20)
Two lower limits must be applied according to ICP : (i) the fully plugged capacity should be no less than the unplugged capacity and (ii) qb should not fall below 0.15qc.
17
Unplugged piles can sustain end bearing capacity on the annular pile base are only with qba =
qc
Rb= qbaπ(R2outer - R2inner) (21)
2.2.4 Parameters that can affect the behaviour of piles
2.2.4.1 Installation methods
The installation method is a main parameter which affects the axial capacity of pile, because of the effect on the surrounding soil. The quality of the soil-pile contacts depends on the installation method, and so the lateral stresses applied on pile may vary from one method to another. Consequently, a significant difference in pile shaft friction may be induced (Puech 2013, Yang et al. 2006a).
The constructions of drilled shaft or cast in place piles are popular in urban area because of their advantages of having a minimal impact on existing foundations and producing relatively little noise (Fisher et al. 1995). However a disadvantage of drilled shafts is that their quality and performance can be affected by (and sensitive to) construction procedures (Petek et al. 2002). Also the high loosening of the surrounding soil induced during the installation of these types of piles put this type of piles in a disadvantage concerning the axial capacity in comparison with the other types of installation methods.
Driven piles are generally installed using drop hammers where a hammer with approximately
the weight of the pile is raised to a suitable height and released to strike the pile head. The behaviour of driven piles can be differed if the pile is driven in cohesionless or cohesive soil. In cohesionless soil during the driving of high-displacement piles, adjacent soils will experience high compressive stresses, causing a build-up of large lateral effective stresses. This effect is most pronounced when driving high displacement piles into soil with high density. Such soils experience shearing as the pile is driven in, and they tend to dilate generating very high lateral contact stresses between the pile and the soil. On the other hand, in cohesive soil, driving high displacement piles strongly compresses adjoining soils and leads to a build-up of excess pore water pressure. This temporary build-up of excess pore water pressure coupled with the sensitivity of the clay causes the soil to lose a good fraction of its shear strength in the short term. This excess of pore water pressure dissipates over a time scale of a few weeks to a few months. As this occurs, the adjoining soil consolidates and
18
increases its strength (Swan). Lehane & White (2005), using centrifuge tests on pile installed by different methods in sand, remarked that the cyclic installation methods create either greater dilation during loading of the pile or stiffer confinement as a result of densification of the surrounding soil.
Jacked piles are installed using hydraulic jack. Their advantages over driven piles came from
generating a lower level of noise and vibration during their installation (Yang et al. 2006b, Deeks et al. 2005). They are also considered to develop high capacity as a result of the preloading of the soil below the base (Zarrabi & Eslami 2016).
In the literature, different works were interested on the effect of the installation method on the axial capacity of piles. Puech & Benzaria (2013) realised in-situ tests using three different installation methods (driven, bored and screwed piles). The driven pile developed the highest compression capacity between the tested piles and the authors concluded that the higher the amount of soil displacement at installation, the higher the ultimate pile capacity. Other observation concerning the displacement at failure is also presented as the pile head displacement at failure is found to be lower for the displacement piles than for the non-displacement piles. In the literature, it is generally remarked that the jacked piles had higher capacity values than those of driven pile (Zarrabi et Eslami 2016, Yang et al. 2006a) and that the response of the drilled shaft and precast-in-place pile to loading were much weaker than the jacked and driven piles (Zarrabi et Eslami 2016). Deeks et al. 2005 found also that the stiffness of jacked piles is considerably higher than conventional driven or bored piles. Yang et al. 2006a have stated that jacked piles derive their resistance predominantly from shaft friction whereas the overall load carrying capacity of the driven piles is more evenly distributed between shaft and base. They also stated that the shaft resistance of the jacked piles is generally stiffer and stronger than that of the driven piles.
2.2.4.2 Pile tip
Pile tip is an important factor that can influence the axial capacity of piles. As presented before, standards suggested different formula for pile tip and shaft capacity depending on the type of pile tip. De Nicola and Randolph (1999) have used centrifuge testing for the evaluation of the API standard. They demonstrate the presence of bias in the type of pile as regards the calculation of the standard end bearing capacity. Testing shows that the experimental value of the Nq factor used for the calculation of the API end bearing capacity is 1.7 times higher than the recommended API values for open-ended pile tests. The tests carried
19
out on close-ended piles also show that the experimental values of Nq are on average 2.4 times higher than the recommended values. Similar results are found in Hossain and Briaud (1993).
Another key factor for offshore pile design is the plug formation, because the piles used for jacket structures are driven open-ended piles. During the installation of open-ended piles, if the pile is driven in an unplugged mode into the soil, the soil gets into the piles at a rate equal to the pile penetration rate. On the other hand, if the pile is driven in a plugged mode into the soil, a soil plug finally attaches itself to the inner surface of the pile, preventing additional soil from entering the pile. Measurement data show that plug length ranges between 10-20 % of the embedded length of the pile (Henke and Grabe 2008). Plugging is a real technical and economical problem. In very dense sand pile plugging can go as far as the available pile hammer becomes unable to drive the pile to design depth. The pile must then be pulled out and alternative solutions must be considered. Lehane and Randolph (2002) postulate that pipe piles driven into the soil in fully coring mode have some base capacities only slightly higher than those of non-displacement piles. Piles driven in fully plugged mode present base capacities that are similar to those of close-ended piles. Paikowsky and Whiteman (1990) also conclude that plugged piles behave almost identically to closed-ended ones and that under working loads both will have the same response. Plugging is a key factor, not only because it directly contributes to tip bearing capacity, but also because it indirectly contributes to the developed shaft capacity. More soil is displaced with a plugged pile than with a pile driven in a coring mode, which increases the effective stresses surrounding the pile (Iskander 2010). More generally, the degree of soil plugging can be represented using the Incremental Filling Ratio IFR (Paik et al. 2003, Lehane and Gavin 2001, Ko and Jeong 2015) defined as:
� = ∆ / ∆ × (22)
where ∆ is the increment of the soil length inside the pile and ∆ is the increment of the pile penetration depth.
2.2.4.3 Sand density and saturation
The effect of density and saturation is taken into account normally in the standards by the use of effective stresses. The increasing number of the use of offshore piles makes necessary to validate this method of evaluation of the effect of density and saturation. De Nicola and Randolph (1999) demonstrate that the recommended end-bearing limits are very conservative in the case of dense sand. Gavin et al. (2011) report the study of Lings (1985) conducted to
20
assess the predictive reliability of the API method. Lings demonstrates the presence of a significant relative density bias, in which the API method prediction overestimates pile capacity in loose sand and significantly underestimates pile capacity in dense sand.
The effect of sand saturation wasn’t a priority in the literature as it was considered that the water can dissipate easily in sand and no accumulation of the pore pressure can be created. As a result the use of effective stresses was considered to be satisfactory and no further studies have focused on the effect of saturation.
2.2.4.4 Pile material and roughness
Nowadays, the use of piles has increased significantly in all the domains of geotechnical and construction engineering. Piles are installed using different techniques (bored, jacked, driven) and different construction materials (steel, concrete, wood. The use of different construction materials affects skin friction between piles and soil (Potyondy 1961). The soil nature, the technical installations and the pile materials are classically taken into account in standards to determine the pile ultimate resistance (e.g., NF 94-262). A survey of the literature reveals that many studies have been conducted to examine the different parameters affecting skin friction between soil and pile materials (Aksoy et al. 2016, Potyondy 1961, Tiwari and Al-Adhadh 2014). Potyondy (1961) has been among the first to address this problem. Through direct shear testing, Potyondy studies concrete, steel and wood interfaces with different types of soil (sand, sandy silt, cohesive soil, silt and clay). The change in skin friction in relation to soil grain size distribution, moisture content, normal load, construction materials and surface finishing are observed. The increased use of jacked and driven steel piles gives more importance to well qualify the behaviour of the interface between steel and sand. With this aim in view, Uesugi and Kishida (1986b) propose some direct shear tests carried out between sand and steel plates of different roughness. They conclude that steel surface roughness, d50 of
sand and sand type have a significant influence on coefficient of friction at yield between sand and steel. On the other hand, uniformity coefficient and normal stress have little influence on the friction coefficient at yield. The sand/steel interface is also discussed in Tejchman and Wu (1995) where the friction coefficient values obtained from the friction tests and the silo model experiments carried out between sand and steel of different roughness are summarized in a table. This study highlights the significant effects that both roughness and sand density have on the interface behaviour. Steel roughness is then classified as smooth, rough and very rough with, for each case, two different sand densities (loose and dense).