Assessment of High-burnup LWR Fuel Response
to Reactivity-Initiated Accidents
by
Wenfeng Liu
B.E., Engineering Physics,
Tsinghua University, P.R.China (1997)
Submitted to the Department of Nuclear Science and Engineering
in partial fulfillment of the requirements for the degree of
Doctor of Philosophy
at the
MASSACHUSETTS INSTITUTE OF TECHNOLOGY
September 2007
@
Massachusetts Institute of Technology 2007. All rights reserved.
/0)
Author ...
Department otNuclear Science and Engineering
August 20, 2007
Certified by ...
U)
Mujid S. Kazimi
TEPCO Professor of Nuclear Engineering
j
F
-
,
.
^ c Thesis Supervisor
C r b
...
..
Jacopo
y.
Buongiorno
o
Assistant Professor
df
Nuclear S ience and Engineering
Accepted by...
MASACUSrTS w4rm]rOF
TEC*tNOLOGYhairman,
JU
L
2 4 2008
ARCfHNES
LIBRARIFR
r' /Thesis Reader
Jeffrey A. Coderre
Department Committee on Graduate Students
Certified by.Assessment of High-burnup LWR Fuel Response to
Reactivity-Initiated Accidents
by
Wenfeng Liu
Submitted to the Department of Nuclear Science and Engineering on August 20, 2007, in partial fulfillment of the
requirements for the degree of Doctor of Philosophy
Abstract
The economic advantages of longer fuel cycle, improved fuel utilization and reduced spent fuel storage have been driving the nuclear industry to pursue higher discharge burnup of Light Water Reactor (LWR) fuel. A design basis accident, the Reactivity Initiated Accident (RIA), became a concern for further increase of burnup as sim-ulated RIA tests revealed lower enthalpy threshold for fuel failure associated with fuel dispersal, which may compromise the core coolability and/or cause radiological release should this happened in LWRs. Valuable information on the behavior of high burnup fuel during RIA are provided by the simulation tests. However atypical design and operating conditions in simulated tests limited the application of experimental data directly to evaluate the failure potential of LWR fuels. To better interpret the experimental results and improve the capability of the fuel performance codes to predict high burnup fuel behavior, this thesis developed mechanistic models of high burnup fuel during an RIA and implemented models in a transient fuel performance code FRAPTRAN 1.3.
Fission gas release (FGR) and swelling were systematically modeled to quantify gaseous loading effects. The grain boundary fission gas inventory is simulated prior to the transient using a diffusion model in FRAPCON 3.3 code. The restructuring of high burnup fuel in rim region is described in terms of porosity, pore size distribution, fission gas concentration, and pore overpressure.
The model assumes the fragmentation of fuel upon the separation of grain bound-ary or when a threshold temperature is exceeded in the rim region. The fission gas in fragmented fuel is assumed to release instantaneously to the free volume when the fuel expansion and swelling creates sufficient pellet-clad gap. The relaxation of rim pore at rapid temperature increase and the thermal expansion of fission gas in fragmented fuel are considered as additional loads on the cladding besides the contact force due to fuel thermal expansion. An analytical approximation is made to calculate the clad radial displacement subjected to fission gas expansion accounting for the constraint of the cladding on the fission gas which would otherwise be neglected in a rigid pellet model FRACAS-I in the FRAPTRAN code.
In comparison to the measured FGR from CABRI, NSRR and BIGR test facilities, this mechanistic model can reasonably predict fission gas release fraction for most of the test cases covering a burnup range of 26-64 MWd/kgU and enthalpy deposit of 37-200 cal/g. It reveals the effects of burnup and enthalpy deposit on the fission gas release: burnup is an important parameter affecting fission gas inventory and fuel micro-structure evolution during base irradiation; enthalpy deposit is directly connected to the availability of fission gas release via the grain boundary separation by the intergranular bubble over-pressurization.
Analysis of the fission gas radial profile is made with the aid of the neutronic code MCODE to validate the fission gas release from the rim of UO2 fuel. The analysis indicates fission gas release is partly from the rim region and the majority of fission gas release is from grain boundaries for burnup up to 50 MWd/kgU. Fission gas induced hoop strain is predicted to be less than 0.3% in the early phase of RIA with peak fuel enthalpy less than 145 cal/g. Given the fact that the concerned failure mode is the PCMI failure at low energy deposit, the pellet thermal expansion is still considered as effective in analyzing the PCMI failure.
However at high level of enthalpy deposit, when clad yield strength is decreased at escalated temperature due to film boiling, the fission gas either released into the plenum or retained in the fuel pellet might strain more the cladding. This is observed in the large deformation of the cladding in some test cases in NSRR and BIGR due to pressure load.
A new set of heat transfer correlations were selected and implemented in the FRAPTRAN code to model the cladding-coolant heat transfer of high burnup fuel at room temperature and atmospheric pressure condition. This new set of correlations addressed the effects of subcooling and oxiation on the heat transfer characteristics at pool boiling conditions. They reflect the increase of rewetting temperature and increase of Critical Heat Flux (CHF) due to subcooling. They account for oxidation effects on the transition and film boiling regime and heat conduction through thick oxide as the oxidation is considered as a prominent feature of surface condition change
of high burnup fuel.
In addition to high burnup fuels tested in NSRR, several fresh fuel tests with different degree of subcooling and a few separate-effects RIA tests are also included to validate the applicabilty of this set of correlations. For fuel enthalpy up to 190 cal/g and oxidation up to 25 micron, the predicted peak cladding temperature (PCT) and duration of DNB achieves generally good agreement with the experimental data. The analysis of high burnup fuel heat transfer reveals that the surface oxidation could cause an early rewetting of high burnup fuel or suppression of DNB. Surface oxidation can delay the heat conducting to the surface while keeping the surface heat transfer in the effective nucleate boiling regime. It also raises the miniumum stable film boiling temperature by lowering the interface temperature during liquid-solid contact resulting from vapor breaking down.
Also modeled was Pellet-Cladding Mechanical Interaction (PCMI) failure of irra-diated and hydrided cladding. The hydride rim accumulated at outer clad is assumed to cause the crack initiation. The fracture toughness of irradiated and hydrided cladding is obtained by fitting experimental data at different temperature range. The
model sets forth a simple criterion for failure associated with crack growth based on the J integral approach. The simplification is that for the thin clad, failure is assumed to occur at the onset of crack tip growth.
In comparison to CABRI and NSRR test results and other failure models, the model shows a good capability to separate the failure cases from non-failure cases. These models have been applied to LWR conditions to determine the failure potential of high burnup fuel. It shows that, at high burnup (and therefore high hydride levels in the cladding), the failure enthalpy is smaller than at low burnup. The pulse width is an important parameter in the burnup up to 50 MWd/kg, but starts to become less important for higher burnup with highly corroded cladding.
Thesis Supervisor: Mujid S. Kazimi
Title: TEPCO Professor of Nuclear Engineering
Thesis Reader: Jacopo Buongiorno
Acknowledgments
I am grateful to my advisor, Professor Mujid Kazimi, for his patient guidance and generous support in the past four years. He revised numerous versions of my papers and thesis, encouraged me to go further in research, and gave me helpful suggestions on many aspects of my study at MIT. Also thanks to my thesis reader, Professor Jacopo Buongiorno for his comments and suggestions to improve the thesis.
Many thanks to Dr. Antonino Romano at ENUSA who had been working with me at the starting stage of the work and help present my work at conferences when I was not able to attend. Special thanks to Dr. Chan Bock Lee at Korea Atomic Energy Research Institute (KAERI) for many discussions during his visit at MIT. Thanks to Dr. Yun Long at Westinghouse for his guidance when I entered into this field.
I benefited a lot from my colleagues: Dr. Pavel Hejzlar, Dr. Yi Yuan, Dr. Zhiwen Xu, Dr. Edward E. Pilat, and Dr Pradip Saha on various aspects of the work.
I would like to express my gratitude to Mr. Harold Scott at Nuclear Regulatory Commission (NRC), Dr. Beyer and Mr. Kenneth Geelhood at Pacific Northwest Na-tional Laboratory (PNNL), Dr. Rashid and Mr. Robert Montgomery at ANATECH Corp. for their comments and/or help.
I am greatly indebted to my mother-in-law, Shuxia Zhang. This work would not have been completed without her help taking care of my daugher, Yao Pei Liu, Finally, thanks to my wife, Lei Zheng, who stimulated me to finish the thesis.
Contents
1 Introduction 19
1.1 M otivation . . . . . . . .... . 19
1.2 Background . . . .. . . . . 20
1.2.1 High burnup fuel issues . . . . 20
1.2.2 Reactivity initiated accidents . . . . 23
1.3 O bjective . . . 27
1.4 Model development ... 29
1.4.1 Analysis codes ... 29
1.4.2 M odel diagram ... 30
1.5 Thesis organization ... 32
2 Modeling fission gas release and swelling 33 2.1 Introduction . . . .. . . . .. . . . . 33
2.2 Fission gas release ... 34
2.2.1 Mechanism of steady state fission gas release . . . . 34
2.2.2 Mechanisms of transient fission gas release . . . . 39
2.2.3 Burst release model ... ... . 40
2.3 Swelling during transients ... 42
2.3.1 Modeling of high burnup structure . . . . 42
2.3.2 Modeling of rim pore relaxation . . . . 48
2.3.3 Coupling with FRACAS-I model in FRAPTRAN . . . . 53
2.4 Gas release and fuel swelling model implementation . . . . 60
2.4.2 Discussion ...
2.5 Summary and conclusions . . . .
3 Modeling cladding-coolant heat transfer 3.1 Introduction ...
3.2 Model description . . . . 3.2.1 Oxidation effects . . . . 3.2.2 Subcooling effects . . . . 3.2.3 Transient effects . . . . 3.2.4 Heat transfer models . . . . 3.3 Model implementation . . . . 3.3.1 Model validation . . . . 3.3.2 Discussion ...
3.4 Summary and conclusions . . . .
4 Modeling PCMI failure
4.1 Introduction and literature review . . . .
4.1.1 4.1.2
Strain based failure model SED and CSED model . . 4.1.3 Scaling analysis . .
4.1.4 Fracture mechanics 4.2 Model description . . . . .
4.2.1 Flaw size model . .
4.2.2 Fracture toughness 4.2.3 Failure criterion . . 4.3 Model implementation . . 4.3.1 Model validation . 4.3.2 Discussion . . . . . 4.4 Summary and conclusions
. . . .
. . . .
. . . . 117 119 119 121 123 125 125 127 128 134 136 140 140 142 148 75 79 81 81 82 83 84 85 89 95 95 1055 Fuel failures at LWR conditions
5.1 Introduction ... 5.2 PW R HZP ... 5.3 BW R CZP ...
5.4 Summary and conclusions ...
6 Summary, conclusions and recommendations
6.1 Summary and conclusions ... 6.2 Recommendations for future work ...
6.2.1 Improvement of models ...
6.2.2 Analysis of advanced cladding alloys . 6.2.3 Other transients of concern . . . .
149 . . . . 149 . .. . . .. 151 . . . .. . . . 157 . . . . .. . . . 166 167 . . . . 167 . . . . 170 . . . . 170 . . . . 172 . . . . 173
A RIA test data
B Computer codes
B.1 Subroutine for FGR and swelling . . . . B.2 Subroutine for PCMI failure ...
B.3 Subroutine for heat transfer . . . .
C A user manual for FRAPTRANMIT
175 181 181 213 223 259
List of Figures
1-1 Illustration of RIA Mechanisms [11] . . . . 28
1-2 Diagram of models implementation and validation . . . . 31
2-1 Xenon diffusion coefficient at a fission rate of 36 W/g [19] . . . . 36
2-2 Illustration of intergranular bubble . . . . 39
2-3 Fitting of porosity in the rim region . . . . 44
2-4 Porosity vs. pore number density . . . . 46
2-5 Thermal conductivity calculated by FRAPCON model . . . . 47
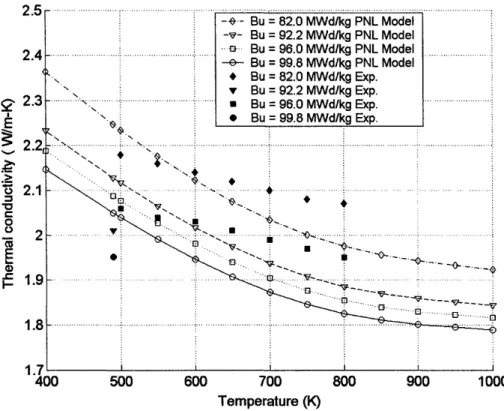
2-6 Comparison of FRAPCON model with experimental thermal conduc-tivity . . . 49
2-7 Comparison of Halden model with experimental thermal conductivity 50 2-8 Pore pressure vs. pore radius at different burnup . . . . 52
2-9 Illustration of fission gas induced deformation . . . . 55
2-10 Prediction of fission gas release for CABRI and NSRR cases . . . . . 61
2-11 Prediction of fission gas release for BIGR cases . . . . 62
2-12 Illustration of pin cell model [14] ... 63
2-13 Xe to Kr ratio for PWR fuel vs. burnup . . . . 64
2-14 Xe to Kr ratio for BWR fuel vs. burnup ... 64
2-15 Validation of Xe to Kr ratio for PWR fuel ... 65
2-16 Validation of Xe to Kr ratio for BWR fuel . . . . 66
2-17 Prediction of permanent hoop strain for CABRI and NSRR cases . . 67
2-18 Prediction of permanent hoop strain by FRAPTRAN 1.3 and FRAP-TRAN 1.3_M IT ... 67
2-19 Prediction of permanent hoop strain for BIGR cases . . . . 68
2-20 Measured FGR vs. enthalpy for CABRI and NSRR cases . . . . 75
2-21 Calculated FGR vs. enthalpy for CABRI and NSRR cases . . . . 76
2-22 EPMA analysis of FK1-2 [49] ... ... 77
2-23 Prediction of gas retention for FK1-2 . . . . 77
2-24 Sensitivity study of 012 ... 78
2-25 Yield stress of Zry-4 predicted by MATPRO . . . . 78
3-1 Bubble growth kinetics at different super heat . . . . 85
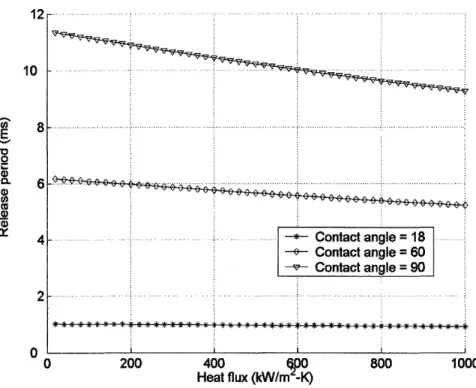
3-2 Bubble release period as a function of heat flux at different contact angles . . . .. 86
3-3 Cladding heating rate and temperature with adiabatic boundary con-dition . . . . 86
3-4 Pool boiling curve at power excursion (From Ref.[60]) . . . . 88
3-5 Tmin correlation vs. subcooling at 0.1 MPa . . . . 92
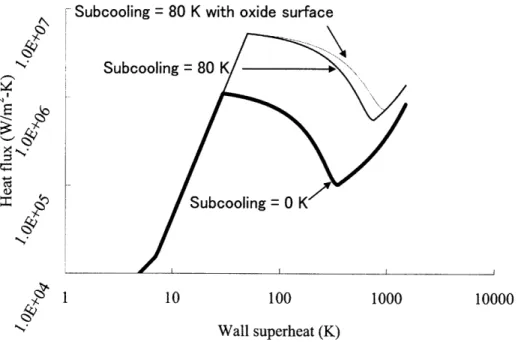
3-6 Pool boiling curve change due to subcooling and oxidation . . . . 92
3-7 Comparison of calculated PCT and measured PCT . . . . 96
3-8 Comparison of calculated duration of DNB and experimental data . . 97
3-9 Prediction of Cladding Surface Temperature History for NH . . . . . 98
3-10 Prediction of Cladding Surface Temperature History for NM .... . 99
3-11 Prediction of Cladding Surface Temperature History for OH . . . . . 99
3-12 Prediction of Cladding Surface Temperature History for OM . . . . . 100
3-13 Prediction of Cladding Surface Temperature History for TK3 . . . 100
3-14 Prediction of Cladding Surface Temperature History for FK3 . . . 101
3-15 Prediction of Cladding Surface Temperature History for FK4 . . . 101
3-16 Prediction of Cladding Surface Temperature History for Fresh01 . . . 102
3-17 Prediction of Cladding Surface Temperature History for Fresh02 . . . 103
3-18 Prediction of Cladding Surface Temperature History for Fresh03 . . . 104
3-19 Thermal conductivity of Zry and zirconia . . . 105
3-21 Cladding surface temperature dependence on oxide thickness for case F K 3 . . . . 3-22 Cladding surface temperature dependence on Tmin for case FK3 . . . 3-23 Effect of oxide layer thickness on interface temperature . . . . 3-24 Quench front velocity vs. initial temperature in film boiling regime . 3-25 Cladding surface temperature dependence on CHF for case FK3 . . . 3-26 Power and heat flux calculated by modified FRAPTRAN for case FK3 3-27 Gap size effect for case FK3 ...
3-28 Gap conductance effect for case FK3 . . . .
Failure morphology for FK9 [72] . . . . Failure morphology for HBO5 [73] . . . . Failure morphology for RepNal0 [46] . . . . . BWR Zry-2 cladding with radially orientated h Hydrogen redistribution ...
Hydride rim prediction with Tco = 573 K . . Hydride rim prediction with Tco = 700 K . . Fracture toughness ...
Illustration of fracture of hydrided cladding. . Errors for prediction of failure enthalpy . . . .
Enthalpy rise and J vs. time for case FK6 . . Enthalpy rise and J vs. time for case HBO5 . Enthalpy rise and J vs. time for case RepNa8 Sensitivity to flaw size ...
lydri . . . . . 120 . . . . . 120 . . . . . 120 de [50] . . . . 129 . . . 132 . . . . . 133 . . . . . 134 . . . 135 . . . . . 139 . . . . 142 . . . . . 143 . . . . 143 . . . . 144 . . . 144
Effect of power history on the corrosion of high burnup fuel . . . . Linear power of PWR rod ...
Buildup of oxide layer as a function of burnup for simulated PWR rod Hydrogen content vs. burnup for simulated PWR rod . . . . Peak fuel enthalpy vs. burnup for PWR failure cases . . . . Effects of power pulse width on failure . . . .
152 153 153 155 156 157 107 108 110 111 113 115 115 116 4-1 4-2 4-3 4-4 4-5 4-6 4-7 4-8 4-9 4-10 4-11 4-12 4-13 4-14 5-1 5-2 5-3 5-4 5-5 5-6
5-7 Linear power of BWR rod ... . ... 159 5-8 Oxide vs. burnup for simulated BWR rod . . . 160 5-9 FRAPCON simulation of irradiation of a BWR case up to 54.3 MWd/kgU 161 5-10 Hydrogen content vs. burnup for simulated BWR rod . . . 162 5-11 Peak fuel enthalpy vs. burnup for BWR failure cases . . . 163 5-12 RIA transient at burnup 51.8 MWd/kgU with power pulse width of 20
m s . . . . . . 164 5-13 RIA transient at burnup 51.8 MWd/kgU with power pulse width of 10
m s . . . 165
List of Tables
2.1 Thermal conductivity of high b 2.2 Coefficient of excess pressure of
2.3 Test Results for fuel rod RT1 2.4 Test Results for fuel rod RT2 2.5 Test Results for fuel rod RT3 2.6 Test Results for fuel rod RT4 2.7 Test Results for fuel rod RT5 2.8 Test Results for fuel rod RT6 2.9 Test Results for fuel rod RT7 2.10 Test Results for fuel rod RT8 2.11 Test Results for fuel rod RT9 2.12 Test Results for fuel rod RT10 2.13 Test Results for fuel rod RT11 2.14 Test Results for fuel rod RT12
3.1 Nomenclature for Eq 3.2-Eq 3.
3.2 3.3
Nomenclature for Eq 3.2-Eq 3.1 Various effects on pool boiling
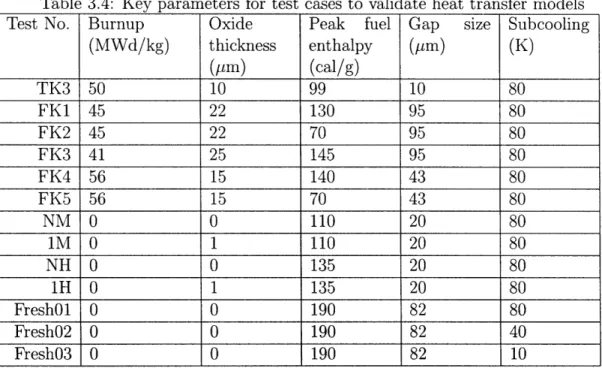
urnup fuel . . . . 48 rim pores . . . . 52 . . . .. . . . 68 . . . .. . . . 69 . . . .. . . . 69 .. . . .. . . . 70 .. . . .. . . . . 70 . . . . .. . . .. . . 7 1 . . . . .. . . .. . . . . 7 1 . . . . .. . . .. . . 72 . . . .. . . . 72 . . . .. . . . 73 S . . . .. . . .. . 74 . . . .. . . . 74 15 . . . .. 93 15 (continued) . . . . 94 heat transfer . . . . 94 3.4 Key parameters for test cases to validate heat transfer models
4.1 Parameters for simulating hydride rim . . . . 4.2 Summary of failure prediction for CABRI tests . . . . 4.3 Summary of failure prediction for NSRR PWR fuel . . . . 4.4 Summary of failure prediction for NSRR BWR fuel . . . .
132 140 140 141
4.5 Summary of scaling analysis by NRC [46] . . . . 146
4.6 Analysis of HBO1 extrapolated to PWR HZP condition . . . . 147
4.7 Analysis of RepNa8 extrapolated to PWR HZP condition . . . . 147
4.8 Analysis of RepNal0 extrapolated to PWR HZP condition . . . . 147
5.1 Difference between test conditions and LWR conditions . . . . 150
5.2 Parameters for simulated PWR RIA at HZP . . . . 154
5.3 Peak fuel enthalpy of failure for PWR HZP . . . . 155
5.4 Parameters for simulated BWR RIA at CZP . . . 158
5.5 Peak fuel enthalpy vs. burnup for BWR CZP . . . . 162
6.1 Summary of test for advanced cladding alloy . . . . 172
6.2 Chemical composition for various Zircaloy cladding . . . . 173
A.1 Parameters of PWR fuel HBO series in NSRR RIA tests . . . . 175
A.2 Parameters of PWR fuel OI, MH and GK series in NSRR RIA tests . 176 A.3 Parameters of BWR fuel TS series in NSRR RIA tests . . . . 177
A.4 Parameters of BWR fuel FK series in the NSRR RIA tests . . . . 178
A.5 Parameters of PWR fuel in the CABRI RIA tests . . . . 179
A.6 Parameters of VVER fuel in the BIGR RIA tests . . . . 180
C.1 Input variables for PCMI data block . . . 259
C.2 Input variables for FGR data block . . . 260
Chapter 1
Introduction
1.1
Motivation
The economic advantages of longer fuel cycle, improved fuel utilization and reduced spent fuel storage have been driving the nuclear industry to pursue a higher discharge burnup for the LWR fuel.
This has been largely achieved by increasing the reload U0 2 enrichment and by technical improvement of the cladding alloy. Nevertheless, owing to the already long duty in LWR environment, it is becoming more challenging to increase the burnup of current LWR fuel and especially to accommodate transient conditions.
At high burnup, corrosion and irradiation degrades the mechanical properties of the cladding, the gaseous fission products released into the free volume increase the fuel plenum pressure, the gaseous and solid fission products contained in the ceramic pellet cause swelling of the pellet, imposing a displacement loading during pellet cladding gap closure. These issues raise concerns of fuel failure and consequent radiological release during operational transients or postulated accident conditions.
One specific concern is the Reactivity-Initiated Accident (RIA) as fuel failures in simulation tests indicate it might be a constraint for further increasing burnup.
In spite of the fact that many in-pile and out-of-pile experiments provide infor-mation on various aspects of high burnup fuel, prediction of the fuel performance by computer codes, especially for transient conditions, is still less satisfactory. Important
phenomena pertinent to high burnup fuel are often missed or not well addressed in fuel performance codes.
It is of important to accurately model the high burnup fuel behavior and phenom-ena identified in the transient tests to improve prediction of the thermal-mechanical response of the fuel pin, to evaluate the burnup limits for safe operation, and to provide insights on how to improve the fuel design.
1.2
Background
1.2.1
High burnup fuel issues
High burnup fuel is associated with either increased irradiation time or uprated power. In either case, detrimental effects can occur to the fuel element or the cladding en-closure. Typical issues associated with high burnup fuel are listed below:
* Oxidation
The Zircaloy water reactions produce zirconia on the outer surface of the cladding. In PWRs, the corrosion tends to be uniform, while in BWRs, a nodular corro-sion is more likely. Although the thickness of oxide layer varies significantly at a certain burnup, it does increase at high burnup. For example, in a PWR fuel rod with average burnup greater than 60 MWd/kg, at a coolant outlet temper-ature > 327 'C, an oxide layer thickness can be greater than 100 microns [1]. A thick oxidation layer:
- Degrades the cladding thermal conductivity, - Thins the metallic cladding wall,
- Leads to formation of hydride blisters when spallation occurs.
Another form of oxidation occurs at the inner side of the cladding surface. As burnup increases, the pellet cladding gap is closed due to swelling of pellet and creep down of cladding. After the gap closure, a chemical bonding is formed between the cladding inner surface and pellet outer surface. The full bonding
occurs at a fuel burnup of about 50 MWd/kg [2]. This bonding prevents the axial transport of fission gases in the fuel and induces severe pellet cladding mechanical interaction.
* Hydrogen pickup
Hydrogen in the water loop is generated either by chemical reaction between the zirconium alloy and water coolant or by radiolytic decomposition of water. The released hydrogen, subsequently permeates through the porous oxide layer and migrates into the metallic cladding. Because of the low solubility of hydrogen in alpha phase zirconium, (50-100 ppm at 280-300 'C), the excess hydrogen precipitates as brittle hydrides in the metallic cladding. As a result, the ductility of the cladding is reduced.
* Crud deposition
Depending on the water chemistry characteristics, crud is deposited on the outer surface of the cladding. Sometimes, the amount of deposition is a function of burnup [2]. The crud deposition may cause
- Unexpected change in core power distribution.
- Axial offset abnormality when boron is picked up in the crud. - Localized corrosion when the process is chemically favorable. - Dryout of fuel rod surface when the crud is thick.
* Irradiation hardening
Both zirconium and its alloys show mechanical properties change under the ir-radiation environment. The defects clusters produced by fast fluence introduces a hardening mechanism to change the mechanical properties of the cladding:
- Increases the yield strength and the ultimate tensile strength. - Decreases the rate of work hardening.
* Fission gas release and swelling
Fission gas release (FGR) results in the pressure increase of the fuel internal plenum. This has always been the safety concern of fuel design for its potential to lift off the cladding. At a burnup higher than 40-50 MWd/kg, fission gas release of UO2 fuel tends to increase rapidly. This leads to high plenum pressure as well as deteriorate the gap gas heat transfer. Even worse, deterioration of gap heat transfer introduces a feedback mechanism to further increase fission gas release by increasing the fuel temperature.
The gaseous products precipitated as intergranular or intragranular bubbles and solid fission products cause additional swelling of the pellet especially during transient condition.
* Formation of high burnup structure
As the LWR fuel is irradiated at an average burnup of 40 MWd/kg , a typical high burnup structure is formed in the rim region of the UO2 pellet that depends on temperature, fuel enrichment and neutron flux spectrum. This is due to the fact that U-238 neutron absorption is particularly higher near a surface exposed to water, thus leading to higher Pu-239 build up. Plutonium in turn has a high fission cross-section yielding a higher fission rate per unit volume at pellet surface when the pellet reaches high burnup. Post irradiation examination shows that this structure is characterized by:
- Large sized pores
- High porosity of about 10-20% - Formation of sub-micron grains
- Depletion of fission gas from fuel matrix
The high fission gas content and high porosity increases the potential for fission gas release and swelling.
* Degradation of thermal conductivity
irradiation environment. For example, at a linear power of 25 kW/m, the centerline temperature of UO2 fuel with a burnup of 86 MWd/kg increases by 250 K over its initial value [3]. The thermal conductivity degradation can be attributed to:
- Build-up of solid and gaseous fission products - Presence of radiation defects
- Formation of porosities
The degraded thermal conductivity raises the fuel temperature, increases the fission gas release and leads to a narrower margin to fuel melting.
* Other issues
Beside these issues associated with cladding and pellet, fuel assembly growth and distortion under irradiation, grid-to-rod fretting wear from debris caught in assembly, and failure to full insertion of control rod are exacerbated at high burnup.
1.2.2
Reactivity initiated accidents
A reactivity initiated accident is a postulated accident. The design basis accident for PWRs is the control Rod Ejection Accident (REA): whereby the high system pressure is assumed to eject outside the core the control assembly at the failure of the control rod drive mechanism housing. The design basis accident for BWRs is the control Rod Drop Accident (RDA): the control blade is assumed to drop down below the core by gravity resulting from detachment from the rod drive.
The significance of the RIA lies in that if a reactivity insertion is greater than prompt critical, the power surge would only be limited by fuel temperature feedback, until eventually terminated by a reactor trip. Safety concerns over RIA are: whether the fuel can withstand such a transient without failure; whether the coolability of the core is compromised; whether the radiological release is acceptable in the event of fuel failure.
Based on the evaluation of early simulated RIA tests SPERT-CDC and TREAT in 1970s, the Nuclear Regulatory Commission (NRC) in the U.S. adopted two criteria. The first one is concerning the core coolability: the radial average peak fuel enthalpy can not exceed 280 cal/g. The second one is for evaluating radiological consequence due to fuel clad failure: cladding failure is assumed when Departure from Nucleate Boiling (DNB) occurs in PWR and critical heat flux is reached for BWR at high power condition and radial average fuel enthalpy exceeds 170 cal/g for BWR at zero and low power condition.
In 1980s, MacDonald reevaluated the early results from SPERT and TREAT as well as the new Power Burst Facility (PBF) test results conducted at the Idaho National Engineering Laboratory [4]. He concludes that a design limit of 230 cal/g might be chosen and a possible failure threshold of 140 cal/g has been identified for fuel rods irradiated up to a burnup of 4.6 MWd/kg, although the RIA will not pose a safety concern considering the low enthalpy deposit calculated in the event [4].
In 1990s, the nuclear industry continued its efforts to increase the burnup. Sim-ulated tests conducted at CABRI and Nuclear Safety Research Reactor (NSRR) re-vealed that fuel rod failures can occur at an enthalpy level less than 70 cal/g [5] [6]. Moreover, fuel dispersal was found to be associated with most of the high burnup fuel failure [5]. Thus, this area has attracted attention from nuclear industry and regulatory authorities as it might impose a limitation for increase fuel burnup.
The simulated RIA tests can be categorized by test facilities:
* SPERT
In 1970s, tests were conducted in the SPERT Capsule Driver Core (CDC) for the U.S. Atomic Energy Commission. Single rods were tested in an instrumented water-filled capsule at ambient conditions. The power pulse width was about 20 ms. The burnup was up to 32 MWd/kg.
* PBF
During 1980s, simulated RIA tests were conducted in the Power Burst Facility (PBF) at Idaho National Laboratory. The reactor consisted of a driver core in
a water pool and a pressurized water loop that can provide a wide range of test conditions. The power pulse width was 15 ms.
* NSRR
NSRR is a modified TRIGA-ACPR (Annular Core Pulse Reactor) with a dry space located in the center of the core. A single instrumented fuel rod in a water-filled capsule was placed in the center of the core and pulse irradiated in the simulated RIA test. About 1200 experiments have bee performed by the the test facility of NSRR to evaluate the thresholds, modes, and consequences of fuel rod failure in terms of fuel enthalpy, fuel burnup, coolant conditions and fuel design [7].
Since 1989, many irradiated fuel have been tested in the NSRR. For PWRs, about twenty-nine tests, with burnup ranging from 38 to 79 MWd/kg, have been performed. Sixteen tests with BWR fuel have been performed with burnup of 26 to 61 MWd/kg. In recent tests, the integrity of advanced cladding alloy MDA and Zirlo under RIA have been investigated. All the irradiated tests were conducted at atmospheric pressure and most of them were at room temperature. NSRR features a very narrow power pulse about 5 ms.
* CABRI
In 1993, the first high burnup test was performed in the CABRI facility led by Institute for Protection and Nuclear Safety (IPSN). It indicated failure of high burnup fuel can occur at a much lower enthalpy deposit than assumed thus far. The objective of the CABRI Rep-Na program was to investigate the high burnup effects on fuel behavior and to verify the RIA safety criteria. The driver core of the reactor is in a water pool while the test loop has sodium coolant at a pressure of 0.5 MPa at a temperature of 280 'C. Since the heat transfer characteristics of the sodium are different from the LWR conditions. It could only represent the fuel behavior in the early phase of RIA. Except for RepNa2, which is a rod irradiated in BR3, all the others have been cut from commercial rods and refabricated to fit the size of the CABRI reactor. In
addition to UO2 fuel, tests of MOX fuel have also been conducted in CABRI reactor. In 2000, IRSN launched in a new international program called CABRI Water Loop, in which the tests would be conducted in a pressurized water loop, more representative of the thermal hydraulics conditions of LWRs. In reference tests CIPO in 2002, advanced cladding alloy M5 and Zirlo have been tested in the sodium loop. After renovation with a water loop, six other test series are undergoing and planned: CIPQ, CIP1-CIP5.
SIGR
During the 1980s and early 1990s, the Russian Research Centre "Kurchatov Institute" (RRC KI) conducted simulated RIA tests and post test examinations of more than 200 VVER fuel rods [8]. At the final stage of the program, refab-ricated fuel rods manufactured from commercially irradiated VVER fuel up to 50 MWd/kg were tested in IGR test reactor. Fresh fuel were tested at a power pulse from 0.14 to 1.5 second and coolant conditions varies from 0.1 to 16 MPa at 20 oC. High burnup fuel were tested at a power pulse from 0.6 to 0.8 second at room temperature and ambient conditions. Ballooning and subsequent burst has been identified as the failure mechanism with no appreciable difference be-tween fresh fuel and high burnup fuel. The peak fuel enthalpy at failures of high burnup fuel takes approximately the same values as fresh fuel.
* BIGR
To study the VVER high burnup fuel behavior in a wide range of peak fuel enthalpy generated by narrow power pulse, 12 test fuel rods refabricated from VVER 440 and VVER 1000 commercial fuel rods irradiated from 47-60 MWd/kg were tested at BIGR. The BIGR reactor is a fast pulse research reactor with a homogeneous uranium-graphite core. The Zr-1%Nb cladding shows again suffi-cient ductility during the RIA tests. The failure occurs at an peak fuel enthalpy level around 170 cal/g similar as the tests results in IGR [9] [10].
The fuel failure observed in the simulated RIA tests above can be illustrated by Figure 1-1. Depending on the cladding temperature and the nature of loading
force, the failure modes are characterized as brittle fracture, ballooning and melting failure. The failure of high burnup fuel in NSRR tests and CABRI tests belongs to the category of fracture. The high burnup VVER fuel in IGR and BIGR tests have failed by ballooning with less corrosion and higher fuel enthalpy deposit.
Among high burnup issues identified in section 1.2.1, oxidation and hydride are known as the reason for the fracture failure by reducing the ductility. This is further exacerbated with irradiation and transient loading.
The effects of fission gas release and swelling during an RIA are not well un-derstood. Experimental programme for separate effects due to fission gas are still undergoing to further reveal its contribution and kinetics.
1.3
Objective
In view of the key high burnup issues identified for RIA scenario, this thesis aims at developing and improving mechanistic models to predict high burnup fuel response during RIA. Modeling efforts are directed towards:
* Modeling fission gas release and swelling to quantify the effects due to fission gas loading systematically by accounting for the grain boundary fission gas accumulation and formation of high burnup structure.
* Modeling Pellet-Cladding Mechanical Interaction (PCMI) failure of irradiated and hydrided cladding to best differentiate the failure fuels from non-failure fuels.
* Modeling heat transfer of high burnup fuel by capturing effects of subcooling and oxidation to provide the basis of predicting cladding temperature to characterize the failure modes.
Models are assembled in an integrated fuel performance code FRAPTRAN and are validated by experimental data from international programme. Models are applied to LWR conditions to determine the failure conditions of high burnup fuels.
1.4
Model development
1.4.1
Analysis codes
Models are developed and integrated in existing fuel performance codes to analyze the burnup fuel behavior during RIA conditions, The analysis codes in this report are listed below.
* FRAPCON 3.3
FRAPCON is a code developed by Pacific Northwest National Laboratory (PNNL) to model the fuel performance of UO2 and MOX pellet with Zry-2 and Zry-4 cladding. The code calculates the temperature, pressure, and defor-mation of a fuel rod as functions of time-dependent fuel rod power and coolant boundary conditions. The phenomena modeled by the code include
- Heat conduction through the fuel and cladding,
- Cladding elastic and plastic deformation, - Fuel-cladding mechanical interaction, - Fission gas release,
- Fuel rod internal gas pressure,
- Heat transfer between fuel and cladding, - Cladding oxidation,
- Heat transfer from cladding to coolant.
The latest version 3.3 is used for base simulation in this work to provide pre-transient parameters. This version is also modified to provide parameters the fission gas release and swelling models applied to RIA.
* FRAPTRAN 1.3
FRAPTRAN is a transient fuel performance code developed by PNNL to model LWR fuel behavior up to 65 MWd/kg [12]. Phenomenological models including heat conduction, rod internal gas pressure and cladding stress strain calculations
are coupled to predict the thermal and mechanical response under transient conditions. It features solving 1-D radial heat conduction through a composite cylinder including a pellet, a gap and a cladding by finite difference method. In the closed regime of a gap, mechanical deformation of the clad is modeled by the free thermal expansion of the pellet. In open regime of gap, the thin-walled theory is applied. The thermal and mechanical properties of Zircaloy cladding UO2 fuel at temperatures ranging from room temperature to melting are defined in a material property package, MATPRO [13]. A modified version of MATPRO-11 Revision 2 is used in FRAPTRAN and FRAPCON to reflect the burnup dependency of material thermal and mechanical properties.
* MCODE 1.0
MCODE is a core/fuel depletion code developed at MIT [14]. It couples the particle transport code MCNP4c3 and isotope generation/depletion code ORI-GEN2.1. It is used to study the fission products generation profile within the fuel pellet.
1.4.2
Model diagram
The models implemented in the fuel codes are shown schematically in Figure 1-2. The transient fission gas release and swelling models are developed and applied in the FRAPTRAN code. A heat transfer incorporating the oxidation effects of high burnup fuel is implemented. A PCMI failure model based on fracture mechanics is applied in the FRAPTRAN code. FRAPCON code is modified and coupled with FRAPTRAN to generate fission gas inventory. MCODE 1.0 is used together with the fission gas release model in FRAPTRAN to calculate the Xe/Kr ratio. The thermal-mechanical parameters in CABRI UO2 tests, NSRR tests, and BIGR tests are used to validate the models.
1.5
Thesis organization
This reports consists of six chapters.This chapter (Chapter 1) provides an introduction to the issues of high burnup fuel behavior during RIA conditions, and to describe the motivation, objectives, and analysis tools used in the thesis.
Chapter 2 then describes fission gas release and swelling models.
Chapter 3 presents the development of heat transfer models during reactivity initiated accident conditions.
Chapter 4 presents a model for the PCMI failure of the high burnup fuel in most test conditions.
Chapter 5 are the applications of the models to LWR conditions. The two con-ditions representing the reactivity insertion are the Hot Zero Power (HZP) condition of a PWR and the Cold Zero Power (CZP) condition of a BWR.
In chapter 6, the work is summarized, concluding remarks and recommendations for future work are made.
Chapter 2
Modeling fission gas release and
swelling
2.1
Introduction
This chapter describes fission gas release and swelling models developed for high burnup UO2 fuel during RIA and their implementations in the FRAPTRAN and FRAPCON codes.
The fission gas inventory prior to an RIA transient is systematically established. Fission gas at the grain boundaries and in fuel matrix are provided by simulating the base irradiation of each test case by FRAPCON code. The fission gas in the rim pores is calculated based on a new high burnup structure model accounting for the depletion of fission gas from fuel matrix.
A new method is developed in the thesis to couple the fission gas induced de-formation of pellet under the constraint of cladding with the existing fuel thermal expansion model, FRACAS-I, in FRAPTRAN. Gaseous swelling accounts for both the rim pore relaxation and fission gas thermal expansion.
All models are validated by extensive database covering simulated RIA tests from NSRR, CABRI and BIGR.
2.2
Fission gas release
Due to the insolubility of gaseous fission products in UO2 the fission gas is either trapped into the natural or irradiation induced defects or released to a free volume like cracking, open porosity, and fuel surface. The fission gas can precipitate in the fuel matrix in the form of intragranular bubbles or at the grain boundary as intergranular bubbles.
Gaseous fission products such as Xe and Kr released into plenum could increase the internal pressure of the fuel rod and degrade the heat transfer. Therefore, fission gas release is a very important parameter affecting fuel performance.
For high burnup, the fission gas inventory is increased at grain boundaries and in the rim region where there is high fission gas content due to local radial power peaking. As burnup is above 40-50 MWd/kgU, fractional fission gas release tends to increase rapidly. During a transient condition, thermal shock entailed cracking or fuel fragmentation promotes additional release path connecting the free volume to the grain boundary fission gas. For example, post irradiation examination (PIE) of simulated RIA indicates a large fraction of fission gas is released (5 to 30%). They contribute additional pressure loading on the cladding besides filling gas, and increase the possibility to fail the cladding.
2.2.1
Mechanism of steady state fission gas release
The generally accepted mechanisms for fission gas release in LWR fuels are: * Athermal release
After a nuclear fission reaction, fission fragments are born with significant ki-netic energy. They, as heavy charged particles, will generally be stopped in the fuel matrix via the Coulomb forces of the electrons. If this process happens near a free surface within the range of fission fragments motion of around 10 pm gaseous products in the fragments might be released directly to the free volume.
will displace atoms from the lattice. These displaced atoms, called primary-knock-ons, can further collide with other atoms to produce a cascade of collision. Any gaseous atoms in the fuel matrix might be knocked out in a collision and be released to a nearby free volume if they obtain sufficient kinetic energy.
Both of the recoil and knockout process are independent of temperature. They are the dominating mechanisms of fission gas release at low temperature (less than 600 'C). They generally contribute a small fraction of fission gas release unless high open porosity are available to increase the specific surface of open porosity.
When burnup increase, high porosity and grain subdivision are formed in the rim region, which gives additional surface, thus increasing the possibility of fission gas release. This athermal release had been modeled by some research work to explain the enhanced fission gas release of high burnup [15] [11]. However there is an argument that pore coalescence and initial channeling of porosities will not take place at the outermost rim until local burnup is very high (> 150 MWd/kgU) [16]. By Monte Carlo simulation according to porosity and pore size distribution in the rim region, Koo concluded that above a threshold porosity of 24%, the number of rim pores forming release channel increases rapidly [17]. Spino pointed out that 24% is too low considering the experimental results and supporting evidence from 3-D pore-reconstruction technique [18].
An alternative explanation of the enhanced fission gas release of high burnup fuel is that a restructured rim serves as an added thermal resistance of the fuel, thus increasing fission gas release via the thermal diffusion mechanism by raising fuel temperature.
* Thermal diffusion controlled release
An increase of fuel temperature causes an increase of mobility of gas atoms due to lattice diffusion as illustrated by a typical diffusion coefficient shown in Figure 2-1. Gas atoms are able to migrate along a temperature gradient to a favorable sink like grain boundaries. Precipitated gas bubbles may further grow
via the incoming atoms and vacancies. At a certain point, when bubbles touch a free surface like open porosities or cracks, the fission gas would be released to the free volume. The classic model is Booth's diffusion model [20], in which the
Xe diffusion coefficient
10-14 10-1510-
16 -17 I55
7 9 11 13 15 17 19 Reciprocal temperature (K) x 104Figure 2-1: Xenon diffusion coefficient at a fission rate of 36 W/g [19]
fuel grains are assumed to be spherical and a perfect sink is set as the boundary condition at a grain boundary.
-C =
1
D -r
2 C(r, t) + 6(t)(2.1)
Initial condition:C(r,
0)
=
0
Boundary condition:C(a,
t) = 0
OCacIr=o = 0
19r
CD 04 NE O C.r 4-' O C 0 C€.-An analytic solution for the fractional fission gas release is thus obtained by solving the diffusion equation:
6a2 6a2 1
Frelease = 1 - Dt
+ -
- exp(-n 2 Ir2Dt/a2) (2.2)90Dt
7ý4Dtn4
An approximation for Freeasle < 57% is:I 4( Dt 1/2
3Dt
for
2D< ,Frelease
=
-(2
-2a2
2Dt/a 2)•22 -
(2.3)
1-0.43a 2 6(e-X--e- 7r2D/)a2 IDt 2o > 1
rr 4
Dt Or
T 2 -a
where D is the gas diffusion coefficient in m2/s, a is the grain radius in meters and t is the time in seconds. 0(t) is the gas production rate. Along the same line, many mechanistic models have been developed. Speight proposed a model to account for the trapping of intragranular bubble and irradiation induced resolution [21]. White and Tucker developed a model with an elaborate tunnel network accounting for the gas transfer through an intermittent open grain-edge tunnel network [22]. Forsberg and Massih developed a model with grain bound-ary saturation as the condition for fission gas release from grain boundbound-ary to the free volume [23]. Kim theoretically analyzed a two stage release accounting for lattice diffusion as well as grain boundary diffusion and demonstrated that the model can explain the burnup enhancement of fractional fission gas release [24]. Koo proposed a model consisting of two module: grain face and grain edge, the interlinkage of fission gas at the grain edge by swelling is a prerequisite condition for fission gas release [25]. Given the simplicity and computational efficiency, Massih's model had been adopted in FRAPCON. Accounting for the resolution of intergranular bubbles, Forsberg and Massih changed the boundary condition to
C(a, t) = b(t)AN(t)/2D (2.4)
where N = surface gas concentration, A = resolution layer depth and b =
express the fission gas accumulation at the grain boundary and in the fuel grain. 4Trr2C(r, t)dr = K(-r - Tro)3c(To)dro (2.5) 00
De = 4/D
T = Dt oo K = 8a3/r E exp(-n27r2T/a2)/n 2 n=1In a new published paper [26], a four-term approximation of the integration kernel is made. This is used in FRAPCON 3.3 [27]. In FRAPCON, the resolu-tion rate is treated as an adjustable parameter. The partiresolu-tion of fission gas is defined as:
AGRnesolved = AG°F/(1 + F) (2.6)
AGB = AGO/(1 + F) (2.7)
where, F is an adjustable multiplier, AGO is the originally calculated fission gas at grain boundary, AGB is the grain boundary fission gas after resolution. The resolved fission gas at grain boundary as well as the fission gas in inter-granular bubbles is also treated to be released when the saturation criterion is met. The saturation criterion in Massih's model is determined by an assumed
intergranular bubble size and critical surface fractional coverage:
N =4rbf () f 27
Nat =
(
+PH)
(2.8)
a
3kBT sin2 rb
where
7-y is surface tension of the bubble = 0.6 N/m 2
r is bubble radius = 0.5 micron
kB is Boltzmann constant T is the temperature in K
PH is the hydrostatic pressure in Pa
fc
is the fractional coverage of grain boundary at saturation = 0.25 9 is the dihedral half-angle = 50 0f(0)
= 1 - 3cos 0/2 + cos3 0/2.This model has been validated by 28 steady state cases with a standard deviation of 2.8% FGR and 18 power ramp cases with a standard deviation of 5.3% FGR [28]. Before the saturation criterion is reached, the gas accumulation at the
G
Figure 2-2: Illustration of intergranular bubble
grain boundary can be calculated by the Massih model. This provides a fission gas inventory available for the transient burst release discussed in Section 2.2.2. Thus the FRAPCON code had to be modified in our work to provide in the output the pre-transient parameters characterizing the fission gas inventory for RIA analysis.
2.2.2
Mechanisms of transient fission gas release
In post irradiation thermal annealing experiments, an initial rapid release has been observed followed by release kinetics controlled by thermal diffusion [29]. This burst release of fission gas from polycrystalline UO2 is believed to be the venting of fission gas accumulated at grain boundaries. Analogous to thermal annealing and other temperature transients, an RIA transient leads to a very high heating rate at 10' K /sec. Thus the burst release process should be the same as for the other. However due to the short duration of a power pulse, bulk thermal diffusion is unlikely to be activated. Micrographs from TEM shows that for a previously irradiated fuel held at
1500 'C for 6 hr, no evidence of large amounts of gas collected at grain boundaries [30]. Kashibe's work also confirmed that the diffusional release is estimated to be less than 1% during the 1500 oC and 6 hr annealing [31]. Given a power pulse duration of only from 5 milliseconds to a few hundred milliseconds in simulated tests, even at a higher temperature, a simple estimation based on diffusion theory can rule out the bulk diffusion effects on fission gas release. Mechanisms of burst release involve two possible pathways [32]:
* Interlinkage of bubbles by the growth of bubbles from the arrival of the vacancies and gas atoms.
* Micro-cracking along the grain boundary due to the stress exerted by the over-pressure of intergranular bubbles.
Both approaches or the combination of the above mechanisms have been adopted in modeling transient fission gas release [321. The nature of fast heating during an RIA enables the cracking along grain boundary to be the more likely mechanism. This is also evidenced by extensive fuel fragmentation observed in most of the RepNa tests and in the NSRR tests [33].
2.2.3
Burst release model
Calculating the micro-cracking along the grain boundary requires detailed information of bubble distribution and the stress field. This is often empirically modeled [25][34]: the entire grain boundary gas inventory is assumed to be vented out instantaneously as the linear power level changes and temperature exceeds a certain value.
In modeling fission gas release during RIA in the SCANAIR code [33], Lemoine used the following condition for grain boundary separation:
PH 1-f
P
>
p,+
-
+(
)
(2.9)
where f is the grain surface gas coverage fraction, p, is the surface tension pressure in Pa and or is the fuel fracture stress in Pa. Some estimation of the GB gas content
as a function of burnup in irradiated UO2 and MOX have been made based on few microprobe results [33].
We also use Eq 2.9 as the criterion for grain boundary separation. Recognizing that the fission gas content in grain boundary depends largely on the irradiation history, we use the Massih model in FRAPCON code to provide this fission gas inventory. The grain surface gas coverage is also determined from the code calculation instead of setting a constant value. For the rim region, in which the grain boundary information is quite different from the central region of the fuel pellet, a threshold temperature is set for fragmentation of the fuel. From the SILENE experiments, the temperature threshold of fragmentation can be 2300-2400 K [35]. It is clearly lower in PWR fuel <
1500 K [35] and it is possible to obtain grain boundary cracking at a lower temperature (around 900 to 1000 OK) [33]. In fact, the high burnup fuel disc experiment indicates some fragmentation when temperature increases [36]. This can be rationalized by the fact that high porosity appears in the rim region: increasing the porosity of UO2 from 5 to 16% causes a 70% reduction in fracture strength [29]. In our model, the threshold temperature is set as 1400 K.
Therefore, transient fission gas release is assumed to occur as long as the fragmen-tation occurs. Once the grain boundary is separated, fission gas would be released through the grain boundary edges, faces, and corners as they are connected to free volume of fuel. Neglecting the gas flow in the porous media, a simultaneous release is assumed in this process.
So far, fission gas release during RIA tests has been measured by the rod punc-ture, in which gas are collected with determination of total volume, interior void and composition of the collected gas. PIE analysis using Electron Probe Micron-Analysis (EPMA) provide additional information about the distribution of fission gas. But no information concerning the kinetics of fission gas release is available.
A program of separate effects of fission gas release, SILENE, is undergoing to obtain a better quantification of the kinetic aspects of fission gas under RIA transients [35]. Our model can be further improved if such information becomes available.
2.3
Swelling during transients
2.3.1
Modeling of high burnup structure
As an LWR fuel pin is irradiated to an average burnup of 40 MWd/kgU and a local rim burnup range of 70-80 MWd/kgU, a typical high burnup structure is formed in the rim region of the fuel pellet that depends on the fuel enrichment and neutron flux spectrum. Post irradiation examination shows that this structure is characterized by large micrometer sized pores that contribute a porosity of 10-20% in the rim region of the fuel, and by formation of fine grains of the size of fractions of micrometers.
It is generally agreed that this micro-structure is due to the combination of high burnup and low operating temperatures. It can be characterized by parameters such as thickness of rim, porosity, pore size distribution and xenon gas depletion.
* Thickness of the rim region
The thickness of the rim region is generally correlated with the burnup. A simple model based on the average burnup can be deduced from Ref. [371:
wrim, = 7.02BUavg - 178 (2.10)
where BUavg is the fuel radial average burnup in MWd/kgU and wrim is the thickness of the rim in ptm
* Xenon depletion
The xenon depletion observed by EPMA indicates that the majority of the fission gas produced during fuel irradiation is contained in the large rim pores. A correlation for the amount of xenon is [38J:
1 1
Xec = c - c(- + (BUo - -exp(-a(BU - BUo))) (2.11)
a a (.1
where Xec is the xenon concentration in %wt. c is the xenon production rate in %wt /BU, BUo is a threshold burnup for the xenon depletion measured in MWD/kgU and a is a constant measured in the reciprocal of BU units related
to the xenon equilibrium concentration.
* Porosity
The porosity is correlated to the radial position in the fuel by an exponential formula:
P(r/ro) = a, + exp(a2 + a3(r/ro)) (2.12)
where ro is the fuel radius and a,, a2, and a3 are burnup dependent parameters as follows:
a, = 0.001144BUavg - 0.02287 (2.13)
a2 = 1.05BUavg - 100.6 (2.14)
a3 = -1.057BUavg + 99.01 (2.15)
It is fitted with experimental specimen for UO2 initially with 3-5% U-235 and covering burnup 40 MWd/kgU to 67 MWd/kgU and average linear heat from 170 to 230 W/cm as shown in Figure 2-3.
* Pore size distribution
According to Ref. [39], the pore size follows the lognormal distribution in the rim region except for the very outermost fuel region. The probability f(rp)drp that the pore radius is within rp and rp + drp is given as:
1 (ln r_ - p)2
f
(rp)drp- = exp(- 2 2 )dr, (2.16)where the pore size rp is in m, / and o2 are the statistical mean and variance
for ln rp respectively. To determine the parameters p and a, the pore size distribution of a 40.3 MWd/kgU sample is used [39]: rp,,min = 0.25 pm rp,max - 2.0 gm and rp,mode = 0.55 pm. Since:
In rp,max = P + 3a (2.17)
We can get: y = -14.27, ua2 = 0.1457.
To verify the assumption that the pore size distribution can be represented by the same set of parameters, consider the dependence of porosity, P, on pore number density, N. The porosity would depend linearly on pore size number density if the pore size distribution is not dependent on burnup and radial position. Therefore:
P(r/ro) = V(rp)N(r/ro) (2.19)
Where V is the average volume of each pore in m :
V
j
7= rf (rp)drp (2.20)r3
=ý
10 14 12 o 810 a. 42
* 40.3(MWd/kg) Exp. - 40.3(MWd/kg) Fit o S56.9(MWd/kg) Exp. o - 56.9(MWd/kg) Fit. o 66.6(MWd/kg) Exp. . 66.6((MWd/kg) Fit. :" I C i 0 .o : * ... 6... I I I 0.5 0.6 0.7 0.8 0.9 1Relative pellet radius
Since we have: rpma (in x - p)2
]
xnexp(-
)dx
rp,min 2u2 exp((1 + n)(2 + a2 + n 2) = -uaexp( 22
F (erf (•/ + 2 na2 - ln(rp,m~ax) -e
+ 2
+
na2 -ln(rp,min)- ef()
-
erf (
))
(2.21)
The average volume of pores is obtained as:47r 3(2t + 3a2)
V(rp) = -- a exp( 2
3 U 222
(2.22) (erf (y +
3a
2 - ln(rp,max) p + 3a2 - n(p,min)(erf ( ) - erf ( ))
Figure 2-4 plots the experimental porosity versus pore number density at a certain radial position for burnup from 40.3-67 MWd/kgU. As can be seen, the above parameters can reasonably represent the pore size distribution.
* Thermal conductivity of high burnup fuel
It is generally accepted that the thermal conductivity of UO2 will degrade in
the irradiation environment. This can be attributed to:
- Build-up of solid and gaseous fission products - Presence of radiation defects
- Formation of porosity
At a temperature below 1900 K, the elementary theory of conductivity of a solid
UO2 describes the lattice vibration as the mechanism of heat transport in the ionic solid [29]. This is usually described by:
1
K = A+BT (2.23)
where A and B are coefficients accounting for defects and