Publisher’s version / Version de l'éditeur:
Spectrochimica Acta - Part A: Molecular and Biomolecular Spectroscopy, 77, 5, p.
973, 2010-01-01
READ THESE TERMS AND CONDITIONS CAREFULLY BEFORE USING THIS WEBSITE. https://nrc-publications.canada.ca/eng/copyright
Vous avez des questions? Nous pouvons vous aider. Pour communiquer directement avec un auteur, consultez la première page de la revue dans laquelle son article a été publié afin de trouver ses coordonnées. Si vous n’arrivez pas à les repérer, communiquez avec nous à PublicationsArchive-ArchivesPublications@nrc-cnrc.gc.ca.
Questions? Contact the NRC Publications Archive team at
PublicationsArchive-ArchivesPublications@nrc-cnrc.gc.ca. If you wish to email the authors directly, please see the first page of the publication for their contact information.
NRC Publications Archive
Archives des publications du CNRC
This publication could be one of several versions: author’s original, accepted manuscript or the publisher’s version. / La version de cette publication peut être l’une des suivantes : la version prépublication de l’auteur, la version acceptée du manuscrit ou la version de l’éditeur.
For the publisher’s version, please access the DOI link below./ Pour consulter la version de l’éditeur, utilisez le lien DOI ci-dessous.
https://doi.org/10.1016/j.saa.2010.08.033
Access and use of this website and the material on it are subject to the Terms and Conditions set forth at
Raman spectroscopic investigations on natural samples from the
Integrated Ocean Drilling Program (IODP) Expedition 311 : Indications
for heterogeneous compositions in hydrate crystals
Schicks, J. M.; Ziemann, M. A.; Lu, H.; Ripmeester, J. A.
https://publications-cnrc.canada.ca/fra/droits
L’accès à ce site Web et l’utilisation de son contenu sont assujettis aux conditions présentées dans le site LISEZ CES CONDITIONS ATTENTIVEMENT AVANT D’UTILISER CE SITE WEB.
NRC Publications Record / Notice d'Archives des publications de CNRC:
https://nrc-publications.canada.ca/eng/view/object/?id=cc69b12e-e909-48b3-bc5d-a942e86cb8b2
https://publications-cnrc.canada.ca/fra/voir/objet/?id=cc69b12e-e909-48b3-bc5d-a942e86cb8b2
Raman spectroscopic investigations on natural
samples from the Integrated Ocean Drilling
Program (IODP) Expedition 311: Indications for
heterogeneous compositions in hydrate crystals
J.M. Schicksa, , , M.A. Ziemannb, H. Luc and J.A. Ripmeesterca Helmholtz Centre Potsdam GFZ German Research Centre for Geosciences, Telegrafenberg, 14473 Potsdam, Germany
b University of Potsdam, Institute for Earth and Environmental Sciences, Karl-Liebknecht-Str. 24, 14476 Potsdam, Germany
c Steacie Institute for Molecular Sciences, National Research Council Canada, Ottawa, Canada
Received 31 March 2010; accepted 19 August 2010. Available online 27 August 2010.
Abstract
Natural gas hydrates usually are found in the form of structure I, encasing predominantly methane in the hydrate lattices as guest molecules, sometimes also minor amount of higher hydrocarbons, CO2 or H2S. Raman spectroscopy is an approved tool to determine the composition of the hydrate phase. Thus, in this study Raman spectroscopic analyses have been applied to hydrate samples obtained from Integrated Ocean Drilling Program (IODP) Expedition 311 in two different approaches: studying the samples randomly taken from the hydrate core, and – as a new application – mapping small areas on the surface of clear hydrate crystals. The results obtained imply that the gas composition of hydrate, in terms of relative concentrations of CH4 and H2S, is not homogeneous over a core or even within a crystal. The mapping method yielded results with very high lateral resolution, indicating the coexistence of different phases with the same structure but different compositions within a hydrate crystal.
Keywords: Gas hydrates; IODP Expedition 311; Cascadia margin; Raman mapping
Article Outline
1. Introduction
2. Experimental
3. Results and discussion
4. Conclusion Acknowledgements References
1. Introduction
Natural gas hydrates form in complex natural environment and consequently are composed of various gases. Although CH4 has been found as the main component of most of the hydrate samples recovered up to now, other hydrocarbons, CO2 and H2S are guest molecules within some hydrate samples [1]. Especially marine gas hydrate, when it is sampled in sulfate-reduction zone in sediments or about seafloor, may also contain H2S [2],
[3] and [4]. Depending on the enclathrated guest molecules, not only structure I but also structure II and even structure H hydrates occur. Recent investigations on natural hydrate samples from the Cascadia margin confirmed the coexistence of structure II and structure H hydrates, containing molecules which were not known previously as hydrate formers such as n-pentane and n-hexane beside CH4 and lighter hydrocarbons [5]. The coexistence of these hydrates was identified using Nuclear Magnetic Resonance (NMR) and X-ray
Spectrochimica Acta Part A: Molecular and Biomolecular Spectroscopy Volume 77, Issue 5, December 2010, Pages 973-977
doi:10.1016/j.saa.2010.08.033 | How to Cite or Link Using DOI
Copyright © 2010 Elsevier B.V. All rights reserved. Permissions & Reprints
diffraction (XRD) methods. Another example for coexisting hydrate phases in nature could be verified by Klapp et al. They observed the coexistence of structure I and structure II hydrates in natural samples retrieved from mud volcano and gas and oil seeps in the eastern Black sea [6]. Although the complexity in hydrate composition and structure have been recognized and studied by Raman spectroscopy, NMR and XRD both qualitatively and quantitatively, the distribution regarding the composition in the natural samples remained unknown. Information regarding the spatial homogeneity of a hydrate sample may be important for the understanding of hydrate formation, reservoir estimation and discussion of origins but is not available up so far.
Against such background, the aim of this study was to obtain information about the spatial variation in structures and/or compositions coexisting in natural gas hydrates. We used samples from Integrated Ocean Drilling Program (IODP) Expedition 311 and employed Raman spectroscopy for this research. Besides using confocal Raman spectroscopy for single-point analyses which has also been performed by other groups [7], we additionally applied a high resolution scanning mode, resulting in Raman maps of the surface of the samples. The samples investigated in this study were taken from Hole U1328B and U1328E at Site U1328 of IODP Expedition 311, which were drilled at a cold vent with active fluid and gas flow with advanced piston corer (APC) system and extended core barrel (XCB) system, respectively (Table 1) [8] and [9]. Since the samples were taken only a few meters below seafloor ( 4.6 mbsf), the local temperature is supposed to be similar to the seafloor temperature (276.65 K). As the water depth was 1268.1 m the pressure at hydrate depth was about 12.7 MPa. At these P–T conditions pure CH4 hydrate is stable. At Site U1328 massive gas hydrates were sampled near the sea floor. On-board geochemical analyses of the headspace and vacutainer gas samples indicated CH4 as the predominant component of the gas mixture, but also traces of ethane, propane and isobutane could be detected [9]. However, those hydrate samples which were analyzed in this study contained small amounts of H2S in various concentrations beside CH4, but there was no indication of higher hydrocarbons.
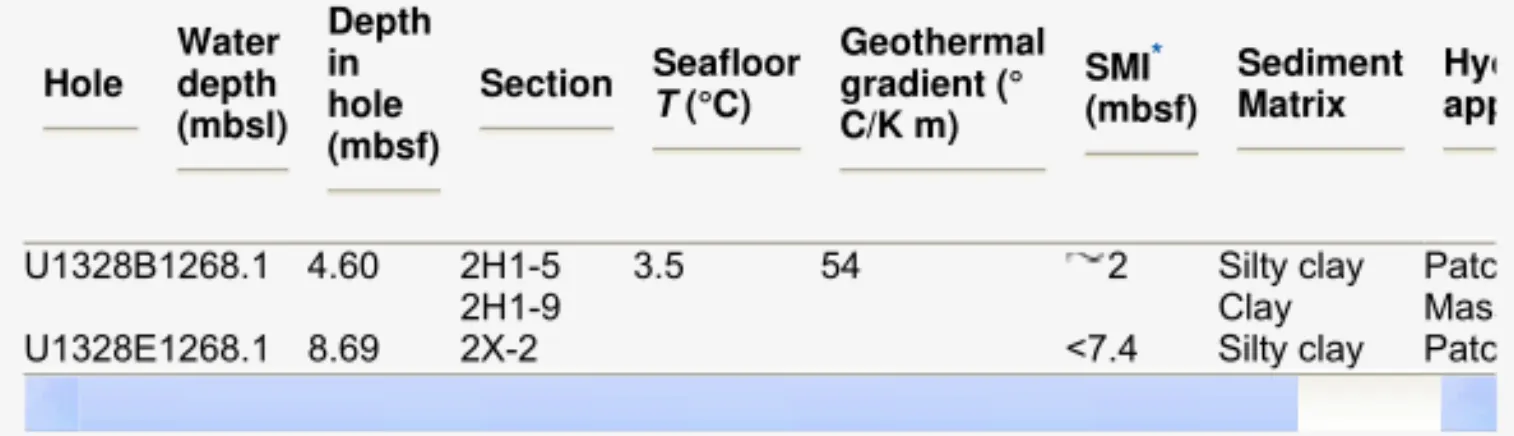
Table 1. Occurrences of gas hydrates – analyzed in this study – at Site U1328 of IODP 311.
* SMI – sulfate–methane-interface.
2. Experimental
The recovered hydrate samples were stored in liquid nitrogen immediately. For the Raman mapping experiments clear hydrate pieces, appearing as crystals with an edge length of about 1 mm, were selected from the massive hydrate sample from Section 2H1-9 of Hole U1328B. We note that although these samples appeared to be homogeneous and transparent crystals, they were probably not “single crystals” as understood from the point of view of crystallography but probably an agglomerate of micro-crystals. A search for true single crystals suitable for X-ray diffraction from the same sample set showed that a typical sI hydrate single crystal had dimensions of 0.5 mm × 0.5 mm × 0.45 mm [10]. These selected hydrate pieces, which we will refer as polycrystals, were placed at ambient pressure and 150 K in a Linkam cooling stage under the microscope (micro-objective 50× ULWD), without further preparation of the surface. Raman spectra of the samples were taken with a confocal Labram HR 800 spectrometer from Horiba Jobin Yvon. Beside single-point Raman measurements and line scans several parts of the surface of different polycrystals were analyzed applying 2D-Raman mapping at high resolution mode (lateral resolution 2 μm). During mapping a selected area is scanned step by step in x and y direction. A complete Raman spectrum (Fig. 1) is recorded at each of these points thus providing the information about the hydrate composition at this point. The colour coded image named “Raman map” is the visual representation of the values of
Hole Water depth (mbsl) Depth in hole (mbsf) Section Seafloor T (°C) Geothermal gradient (° C/K m) SMI* (mbsf) Sediment Matrix Hyd app
U1328B1268.1 4.60 2H1-5 3.5 54 2 Silty clay Patc
2H1-9 Clay Mass
a particular parameter of a selected Raman band which is calculated for each individual Raman spectrum of the area [11]: in this study the Raman map shows the integral intensities of the index Raman bands of the gas species CH4, H2S, and H2O of the hydrate (see Table 2). Thus the Raman map displays the spatial distribution of hydrate composition of the analyzed area. The mappings were performed on fresh, condensate-free, flat and homogenous-looking area of the natural surface of a clear polycrystal. The dimensions of the scanned areas were 22 μm × 22 μm with 1 μm (=1 pixel) step size, resulting in maps with 484 spectra. The Raman spectra were collected in a depth of about 4 μm strongly reducing effects from the surface. For mapping (compared to the single-point measurements) a grating with lower dispersion was used to collect spectra with all index Raman bands in one spectral window and to set the accumulation time per pixel to 10 s, in contrast to 60 s for high resolution single-point measurements. The chosen acquisition time and number of accumulations led to an acceptable signal-to-noise ratio of the spectra on the one hand, and a reasonable total time for the measurements in the cooling stage on the other hand. For the Raman stimulation of the sample a Nd:YAG laser (λ = 532 nm) was used with a reduced laser power of about 5 mW to prevent sample heating. Microscopic checks of the sample surface confirmed that no changes occurred during measurements.
Fig. 1.
High resolution Raman spectra of gas hydrate from Section 2H1-9 of Hole 1328B. (a) Complete spectrum showing the prominent bands of H2S (2593 cm−1 and
2604 cm−1), CH4 (2569 cm−1, 2902 cm−1 and 2913 cm−1) and H2O (broad bands between 3000 cm−1 and 3700 cm−1). (b and c) Detailed spectra of the H–S stretching area showing different H2S contents of the samples. The strong band at 2569 cm−1 is assigned to CH4.
Table 2. Assignment of the bands detected in Raman spectra of hydrate samples in this study.
* Index Raman bands of the Raman maps.
3. Results and discussion
In this study, different samples from Hole U1328B and Hole U1328E were analyzed using
Full-size image (33K)
Peak position (cm−1)
Component Assignment of the bands References
2569* CH4 2ν4 (overtone of the bending) Chazallon et al. [13]–
2593* H2S ν1 (S–H symmetric stretching) Dubessy et al. [14] Bény et al. [15] 2604 H2S ν1 (S–H symmetric stretching) Dubessy et al. [14]
Bény et al. [15]
2902* CH4 ν1 (C–H symmetric stretching) Chazallon et al. [13] 2913 CH4 ν1 (C–H symmetric stretching) Chazallon et al. [13] 3049 CH4 2ν2 (overtone of antisymmetric bending)Chazallon et al. [13]–
3100*–3500H2O Various Dubessy et al. [14]
confocal Raman spectroscopy, resulting in single-point spectra. These were obtained from several points on the surface of the samples which were selected randomly. Those spectra, taken from sample 2H1-5 (Hole U1328B) did not show any indication of the presence of H2S. In contrast, the Raman spectra of sample 2X-2 (Hole U1328E) and 2H1-9 (Hole U1328B) show the prominent bands of H2S in large and small cavities of structure I clathrate hydrate (2593 cm−1 and 2604 cm−1, respectively). There was no indication of higher hydrocarbons in the region of the C–C stretching bands in the spectra. The hydration number of these hydrate samples was determined to be about 6.19 ± 0.05 by use of Raman spectroscopy and NMR [12]. Polycrystals, selected from the hydrate samples from Hole U1328B (2H1-9) were analyzed in detail to learn more about the distribution of H2S and CH4. For this purpose an area without obvious irregularities on the surface was chosen for the mapping. It could be shown, that the hydrate contained very small amounts of H2S beside CH4 in various concentrations. Fig. 1a shows one representative Raman spectrum, taken as a single-point spectrum of the analyzed polycrystals. The ratio of the C–H stretching bands of CH4 in large and small cages at 2902 cm−1 and 2913 cm−1 clearly indicates a structure I hydrate. In some parts of the polycrystal, H–S stretching bands at 2592 cm−1 and 2604 cm−1 prove the existence of H2S (Fig. 1b), whereas in other parts of the sample H2S could not be detected (Fig. 1c). All detected and assigned Raman bands are listed in Table 2[13], [14], [15] and [16]. Calculations based on those single-point Raman spectra at different spots of the surface of the polycrystal leads to the following average gas composition in the hydrate phase: 0.4 mol% H2S and 99.6 mol% CH4. For the calculations the same routine was used as for the determination of fluid inclusion compositions [17]. The integrated band intensities were corrected for cross-section factors of 6.4 and 7.6 for H2S and CH4, respectively [18]. It was assumed that the cross-sections do not vary with cage type or the overall
composition of the hydrate. Based on the variation of composition values in our data sets we assume an error of ±0.15 mol% for H2S.
In order to obtain further information on the distribution of the hydrate phases with different compositions and the spatial compositions in the hydrate polycrystals, it is helpful to present the spatial variations of the integral intensities of the Raman bands of each species as a map as described in Section 2 and shown in Fig. 2a–c. Although the surface of the polycrystal looked homogeneous, there were some areas where the measured intensities decreased for all components. Please note, that the single species map of H2S (Fig. 2b) shows remarkable differences compared to the other single species maps of CH4 and H2O. Nevertheless, the single species map of water differs from that of CH4 too. Due to the fact that the integral intensity for CH4 is more reduced compared to those of water and H2S the relative composition of the sample in this area changes. These changes are much more distinct in the presentation of the relative intensities between H2S, CH4 and H2O as shown in Fig. 2d–f. These maps exhibit clearly a relative enrichment of H2S in some parts of the mapped surface of the polycrystal.
Fig. 2.
Intensity distribution images created from the 22 μm × 22 μm Raman map. The variations of the integral intensities of the index Raman bands (cf. Table 2) are coded as colours for each of the different species (a) blue: CH4 band at 2902 cm−1), (b) green: H2S band at 2593 cm−1, (c) red: H2O band at 3100 cm−1, (d) blue–red: intensity ratio I (CH4)/I (H2O), (e) green–red: intensity ratio I (H2S)/I (H2O), (f) green– blue: intensity ratio of I (H2S)/I (CH4). The colour columns on the right side of the
images show the intensity and intensity ratio scales (a.u.). (For interpretation of the references to colour in this figure legend, the reader is referred to the web version of the article.)
The results presented give a clear indication that in hydrate samples that appear quite homogenous and that resemble large “single crystals”, the composition is not uniform but shows spatial variation. The apparent enrichment of H2S in some areas of a polycrystal likely arises from the coexistence of small amounts of H2S-rich hydrate portions in bulk CH4 hydrates with small or no amounts of H2S. Further investigations on this sample with differential scanning calorimetric measurements result in the observation of two
endothermic processes (hydrate decomposition) which occurred at TO = 208.2 ± 1.1 K and 249.3 ± 0.2 K, respectively [12]. The measured TO = 249.3 K corresponds to the
dissociation temperature of a H2S-rich hydrate, whereas the dissociation temperature of pure CH4 hydrate is slightly lower than the measured onset temperature
(TO = 200.8 ± 0.3 K versus 208.2 ± 1.1 K). In contrast, DSC measurements on
homogeneous gas hydrates which were synthesized from ice and a H2S–CH4-gas mixture result in only one dissociation peak at 236.7 ± 1.2 K [19]. These results support the assumption of coexistence of various gas hydrate phases with different compositions in the natural sample. Experimental studies with CH4–H2S mixtures confirmed that the relative composition of CH4–H2S in the hydrate phase corresponds to the feed gas composition upon hydrate formation [19], so it is reasonable to assume that the growth of the hydrate studied in this research was fed by gas with a fluctuating composition of H2S and CH4 over temporal and/or spatial scale.
Although further studies are needed to have a full explanation of the mechanism of heterogeneous composition distribution in hydrate, we try to give a temporary discussion. Considering the background of the sample occurrence, the observed heterogeneous distribution of gas composition could be caused by changing availability of CH4 and H2S from pore water in different stages of hydrate growth. H2S is locally produced by the reduction of sulfate via anaerobic methane oxidation (AMO) as a result of a complex interaction between microbes which use the sulfate to oxidize the CH4 anaerobically [2],
[20] and [21]. The thickness of the sulfate-reduction zone generally ranges from several tens of meters to a couple of centimetres below the seafloor, depending on the
hydrocarbon flux as well as on the organic matter content and the sedimentation rate [22]
and [23]. In general, the hydrocarbon flux at a certain site varies over time [24] and [25]. In consequence, the concentration of H2S and CH4 in the pore water changes over time as well. In case of a hydrate crystal formation at a certain depth in the sediment section, its growth will be supported by the dissolved gas in the surrounding pore water. Due to the fact, that the availability of H2S and CH4 are closely related to the hydrocarbon flux, the ratio of incorporated CH4 to H2S during hydrate formation may vary at any time, generating heterogeneous hydrate phases (coexisting micro-crystals with different compositions or portions with different compositions). Similar heterogeneous chemical or isotopic composition distribution in a crystal has been identified with plagioclase [26] and quartz and K-feldspar [27] with implication of environmental changes during crystal growth.
4. Conclusion
Raman spectroscopic investigations on clathrate hydrates are generally well suited for obtaining the structure and composition of clathrate hydrate samples. With the advantage of small sampling volumes, confocal Raman spectroscopy enables the analysis of a selected specific area of the sample. However, in case of heterogeneous samples, it is necessary to “scan” the sample for getting information regarding the spatial composition distribution of a sample. Raman mapping, as presented in this study, permits the determination of the spatial irregularities regarding composition or structure even in small and homogeneous looking areas of a sample. The detected variations in H2
S-concentration might imply that hydrate formation is a dynamic process related to CH4 flux and other geological and geochemical conditions.
Acknowledgements
The German GEOTECHNOLOGIEN program of BMBF and DFG provided funding for this work through Research Grant 03G0605A. This is publication no. GEOTECH-1682. The research in Canada was supported in part by Natural Resources Canada's Climate
Change Technology and Innovation Initiative (CCTII). We acknowledge the great efforts of the on-board staff of the IODP Expedition 311, which made this research possible.
References
[1] A.V. Milkov, G.E. Claypool, Y.-J. Lee and R. Sassen, Geochim. Cosmochim. Acta 69 (2005), pp. 1007–1026. Article | PDF (784 K) | View Record in Scopus | Cited By in Scopus (36)
[2] M. Kastner, K.A. Kvenvolden and T.D. Lorenson, Earth Planet. Sci. Lett. 156 (1998), pp. 173–183. Abstract | PDF (1157 K) | View Record in Scopus | Cited By in Scopus (44)
[3] E. Suess, M.E. Torres, G. Bohrmann, R.W. Collier, J. Greinert, P. Linke, G. Rehder, A. Trehu, K. Wallmann, G. Winkler and E. Zuleger, Earth Planet. Sci. Lett. 170 (1999), pp. 1–15. Article | PDF (1209 K) | View Record in Scopus | Cited By in Scopus (208) [4] K.C. Hester, R.M. Dunk, S.N. White, P.G. Brewer, E.T. Peltzer and E.D. Sloan,
Geochim. Cosmochim. Acta 71 (2007), pp. 2947–2959. Article | PDF (1323 K) |
View Record in Scopus | Cited By in Scopus (27)
[5] H. Lu, Y. Seo, J. Lee, I. Moudrakovski, J.A. Ripmeester, A.R. Chapman, R.B. Coffin, C. Gardner and J. Pohlman, Nature 445 (2007), pp. 303–306. Full Text via CrossRef |
View Record in Scopus | Cited By in Scopus (42)
[6] S.A. Klapp, G. Bohrmann, W.F. Kuhs, M.M. Murshed, T. Pape, H. Klein, K.S. Techmer, K.U. Heeschen and F. Abegg, Mar. Petrol. Geol. 27 (2010), pp. 116–125.
Article | PDF (1576 K) | View Record in Scopus | Cited By in Scopus (9)
[7] K.C. Hester, C.A. Koh, S.F. Dec and E.D. Sloan, Proceedings of the Integrated Ocean
Drilling Program, vol. 311 (2008).
[8] M. Riedel, T.S. Collet and M.J. Malone, Sci. Drill. 3 (2006), pp. 18–24.
[9] M. Riedel, T.S. Collet, M.J. Malone and the Expedition 311 Scientists, Proceedings of
the Integrated Ocean Drilling Program, vol. 311 (2008).
[10] K.A. Udachin, H. Lu, G.D. Enright, C.I. Ratcliffe, J.A. Ripmeester, N.R. Chapman, M. Riedel and G. Spence, Angew. Chem. Int. Ed. 46 (2007), pp. 8220–8222. Full Text via
CrossRef | View Record in Scopus | Cited By in Scopus (12)
[11] P.J. O’Brien and M.A. Ziemann, Eur. J. Mineral. 20 (2008), pp. 827–834.
[12] H. Lu, J.M. Schicks, I. Moudrakovski, R. Naumann, J.A. Ripmeester, M. Zhang, G. Gardner, M. Luzi, J. Erzinger, JGR, submitted for publication.
[13] B. Chazallon, C. Focsa, J. Charlou, C. Bourry and J. Donval, Chem. Geol. 244 (2007), pp. 175–185. Article | PDF (519 K) | View Record in Scopus | Cited By in Scopus (11)
[14] J. Dubessy, M.-C. Boiron, A. Moissette, C. Monnion and N. Sretenskaya, Eur. J.
Mineral. 4 (1992), pp. 885–894. View Record in Scopus | Cited By in Scopus (34) [15] C. Bény, N. Guilhaumou and J.-C. Touray, Chem. Geol. 37 (1982), pp. 113–127.
Abstract | PDF (972 K) | View Record in Scopus | Cited By in Scopus (5)
[16] I.-M. Chou, J.D. Pasteris and J.C. Seitz, Geochim. Cosmochim. Acta 54 (1990), pp. 535–543. Abstract | PDF (1103 K) | View Record in Scopus | Cited By in Scopus (21) [17] L. Nasdala, D.C. Smith, R. Kaindl and M.A. Ziemann, EMU Notes Mineral. 6 (2004), pp. 281–343.
[18] E.A.J. Burke, Lithos 55 (2001), pp. 139–158. Article | PDF (721 K) | View Record in Scopus | Cited By in Scopus (111)
[19] J.M. Schicks, H. Lu, M. Ziemann and J.A. Ripmeester, Proceedings of the 6th
International Conference on Gas Hydrates Vancouver, 06–10 July (2008). [20] R.O. Barnes and E.D. Goldberg, Geology 4 (1976), pp. 297–300. Full Text via
CrossRef
[21] A.J.B. Zehnder and T.D. Brock, J. Bacteriol. 137 (1979), pp. 420–432. View Record in Scopus | Cited By in Scopus (101)
[22] W.S. Borowski, C.K. Paull and W. Ussler, Geology 24 (1996), pp. 655–658. Full Text via CrossRef | View Record in Scopus | Cited By in Scopus (148)
[23] R. Luff and K. Wallmann, Geochim. Cosmochim. Acta 67 (2003), pp. 3403–3421.
Article | PDF (778 K) | View Record in Scopus | Cited By in Scopus (98)
[24] B. Carson and E.J. Screaton, Rev. Geophys. 36 (1998), pp. 329–351. View Record in Scopus | Cited By in Scopus (44)
[25] M.E. Torres, J. McManus, D.E. Hammond, M.A. de Angelis, K.U. Heeschen, S.L. Colbert, M.D. Tryon, K.M. Brown and E. Suess, Earth Planet. Sci. Lett. 201 (2002), pp. 525–540. Article | PDF (755 K) | View Record in Scopus | Cited By in Scopus (105)
Copyright © 2011 Elsevier B.V. All rights reserved. SciVerse® is a registered trademark of Elsevier Properties S.A. trademark of Elsevier B.V.
Home
Browse
Search
My settings
My alerts
About ScienceDirect What is ScienceDirect Content details Set up How to use Subscriptions Developers
Contact and Support Contact and Support
About Elsevie About Elsevier About SciVerse About SciVal Terms and Cond Privacy policy Information for adverti
[26] J.G. Brophy, M.J. Dorais, J. Donnelly-Nolan and B.S. Singer, Cont. Mineral. Petrol. 126 (1996), p. 121136.
[27] D. Elsenheimer and J.W. Valley, Geochim. Cosmochim. Acta 57 (1993), pp. 3669– 3676. Abstract | PDF (1316 K) | View Record in Scopus | Cited By in Scopus (37)
Corresponding author. Tel.: +49 3312881487.
Spectrochimica Acta Part A: Molecular and Biomolecular Spectroscopy Volume 77, Issue 5, December 2010, Pages 973-977