Publisher’s version / Version de l'éditeur:
Vous avez des questions? Nous pouvons vous aider. Pour communiquer directement avec un auteur, consultez la
première page de la revue dans laquelle son article a été publié afin de trouver ses coordonnées. Si vous n’arrivez pas à les repérer, communiquez avec nous à [email protected].
Questions? Contact the NRC Publications Archive team at
[email protected]. If you wish to email the authors directly, please see the first page of the publication for their contact information.
https://publications-cnrc.canada.ca/fra/droits
L’accès à ce site Web et l’utilisation de son contenu sont assujettis aux conditions présentées dans le site LISEZ CES CONDITIONS ATTENTIVEMENT AVANT D’UTILISER CE SITE WEB.
2005 World Sustainable Building Conference [Proceedings], pp. 1-8, 2005-09-01
READ THESE TERMS AND CONDITIONS CAREFULLY BEFORE USING THIS WEBSITE.
https://nrc-publications.canada.ca/eng/copyright
NRC Publications Archive Record / Notice des Archives des publications du CNRC :
https://nrc-publications.canada.ca/eng/view/object/?id=11095d5f-ac30-41f3-9340-2f2382ba40de
https://publications-cnrc.canada.ca/fra/voir/objet/?id=11095d5f-ac30-41f3-9340-2f2382ba40de
NRC Publications Archive
Archives des publications du CNRC
This publication could be one of several versions: author’s original, accepted manuscript or the publisher’s version. / La version de cette publication peut être l’une des suivantes : la version prépublication de l’auteur, la version acceptée du manuscrit ou la version de l’éditeur.
Access and use of this website and the material on it are subject to the Terms and Conditions set forth at
Thermal performance of extensive green roofs in cold climates
Liu, K. K. Y.; Baskaran, B. A.
http://irc.nrc-cnrc.gc.ca
N a t i o n a l R e s e a r c h C o u n c i l C a n a d a
T he r m a l pe rfor m a nc e of
ex t e nsive gre e n roofs in c old
clim at e s
N R C C - 4 8 2 0 2
L i u , K . ; B a s k a r a n , B .
A version of this document is published in / Une version de
ce document se trouve dans :
World Sustainable Building Conference, Sept. 27-29,
2005, Tokyo, Japan, pp. 1-8
THERMAL PERFORMANCE OF EXTENSIVE GREEN ROOFS IN COLD CLIMATES
Karen LIU Ph.D1
Bas BASKARAN Ph.D2
1
Institute for Research in Construction, National Research Council, Building M20, 1200 Montreal Road, Ottawa, Ontario, K1A 0R6, Canada [email protected]
2
Institute for Research in Construction, National Research Council, Building M24, 1200 Montreal Road, Ottawa, Ontario, K1A 0R6, Canada [email protected]
Keywords: green roof, garden roof, rooftop garden, vegetation, plants, thermal, energy, building envelope
Summary
Green roof is a specialized roofing system that supports vegetation growth on rooftops. This technology is rapidly gaining popularity in North America as a sustainable design option. Green roofs offer multiple benefits to urban areas such as reduction of heating/cooling needs for the building, urban heat island and stormwater runoff for the region. In this study, the performance of two extensive green roofs located in the City of Toronto, Ontario, Canada was monitored. The green roofs varied in system components, types and depths of growing medium, vegetation coverage and types of roofing systems. The green roofs were instrumented with sensor networks to provide thermal performance data. Observations from the first year of monitoring showed that the green roofs reduced the heat flow through the roofs, thus lowering the buildings’ heating/cooling energy demand, independent of the roofing systems the green roofs were installed on. Although the plant coverage was relatively low in the first year, the green roofs reduced the annual heat flow through the roofs and they were more effective in the summer than in the winter. Energy efficiency varied slightly with growing medium depth and system design.
1. Introduction
Canada has ratified the Kyoto agreement to reduce green house gases (GHG) emissions to 6% below 1990 levels by the period between 2008 and 2012. The government of Canada has been taking action in various sectors across the country to reduce GHG emissions. Buildings account for approximately 30% of energy use and 27% of green house gases emission in Canada [Natural Resources Canada 2004]. The building envelope controls heat transfer between a building and its environment. Innovative energy efficient building envelope design can therefore reduce both heating/cooling energy use and the associated GHG emissions. Green roof technology, a specialized roofing system that supports vegetation growth on rooftops, can improve the thermal performance of the roofing systems by shading, insulation, evapotranspiration and increased thermal mass. Initially confined to Western Europe, this technology is rapidly gaining popularity in North America as a sustainable building design feature due to the widespread adoption of LEED (Leadership in Energy and Environmental Design) Green Building Rating System in the construction industry.
Green roofs can improve the energy efficiency of the roofing system and reduce the energy demand for space conditioning through direct shading of the roof, evapotranspiration and improved insulation values [Minke 1982, Liesecke 1989, Christian 1996, Eumorfopoulou 1998, Palomo Del Barrio 1998, Environmental building News 2001]. The insulation value of a green roof is in both the plants and the growing medium. German research has shown that a 200-mm layer of growing medium and a 200 - 400-mm layer of thick grass has a combined insulation value equivalent to 150-mm mineral wool insulation (RSI 0.14) [Minke 1982]. A study by Oak Ridge National Laboratory showed that a vegetated roof with 0.46 - 0.76 m of soil reduced the peak sensible cooling needs of a building by about 25% [Christian 1996]. In addition, the green roof did not have a cooling penalty like commercial buildings with high roof insulation levels. Field measurement at the National Research Council of Canada showed that an extensive green roof with grass planted on a 150-mm growing medium reduced the heat flow through the roof by over 75% in the spring and su150-mmer [Liu 2003].
2. Objectives
The City of Toronto, Ontario, is the largest municipality in Canada, with a population of about 2.5 million. In 2002, a study was initiated to examine the potential cost-benefit of green roof technology to the City of Toronto and the findings will be used as inputs for the development of environmental policies and incentives in the future. As part of this bigger study, the National Research Council instrumented two extensive green roofs on the Eastview Neighbourhood Community Centre and the Toronto City Hall in Toronto to quantify the thermal performance. This paper will discuss the initial observations and findings of the field study.
3. Experimental Roofs for the Field Study
3.1 Eastview Neighbourhood Community Centre (Conventional Roofing System)
It is situated in a neighbourhood of low-rise residential and commercial buildings, in the City of Toronto. The
green roof was established on top of the gymnasium, which has a low slope industrial roof. The 460m2 roof
area was divided length-wise into two sections where two extensive green roof systems were installed. The roof of the adjacent mechanical room was used for reference purpose. The green roof installation was done in several stages. A network of thermocouples and heat flux transducers were embedded in the roofing systems in May 2002. The green roof systems were installed in late July 2002 and sowed with seeds. However, the seeds did not develop well so it was replanted with plugs in summer 2003. Therefore, during the observation period reported in this paper (May 2002 – June 2003), the green roof contained very little vegetation (less than 5% coverage). The data will provide a baseline comparison for future analysis when the plants have established higher foliage density.
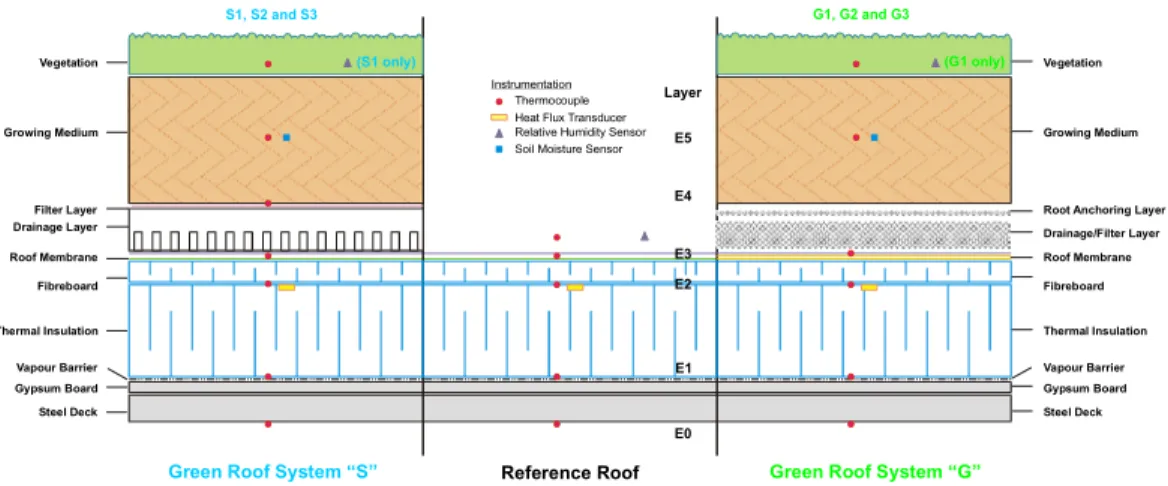
The roofs of the gymnasium and the adjacent mechanical room (Reference Roof) consisted of steel deck, gypsum board, vapor retarder, thermal insulation, fibreboard and modified bituminous membrane. Green Roof System G consists of a composite semi-rigid polymeric drainage and filter mat and a root-anchoring mat. It has 100 mm of lightweight growing medium containing small light-colored granules. Green Roof System S consists of an expanded polystyrene drainage panel and a geotextile filter fabric. It has 75 mm of lightweight, dark-colored growing medium containing porous ceramic granules. A weather station was also installed on the rooftop to monitor atmospheric conditions such as temperature, relative humidity, precipitation and solar radiation intensity. All sensors are connected to a data acquisition system, which can be remotely accessed via a modem, for continuous monitoring. Figure 1 shows the major components of the roofing systems and the instrumentation locations.
Figure 1 Schematics showing the principle components and sensor locations within the roofing systems at
the Eastview Neighbourhood Community Centre.
3.2 Toronto City Hall (Protected Membrane System)
The Toronto City Hall is located in the heart of downtown Toronto. Being minutes from the city’s financial district, the City Hall is surrounded by high-rise buildings (mainly office buildings and hotels). The green roof
was established on the southeast corner of City Hall’s podium roof in November 2000. It is about 230 m2
and consists of eight different garden plots of various horticultural themes. Four of the eight plots were instrumented for thermal performance monitoring. This paper will focus on the observations from one of the four monitored garden plots only, namely Green Roof S1.
Thermocouple Instrumentation
Heat Flux Transducer Relative Humidity Sensor Soil Moisture Sensor
Green Roof System “S”
S1, S2 and S3 G1, G2 and G3
(S1 only) (G1 only)
Green Roof System “G”
Reference Roof Growing Medium Drainage Layer Filter Layer Roof Membrane Steel Deck Vegetation Fibreboard Thermal Insulation Gypsum Board Vapour Barrier Growing Medium Drainage/Filter Layer Root Anchoring Layer
Roof Membrane Steel Deck Vegetation Fibreboard Thermal Insulation Gypsum Board Vapour Barrier E5 Layer E4 E3 E1 E0 E2
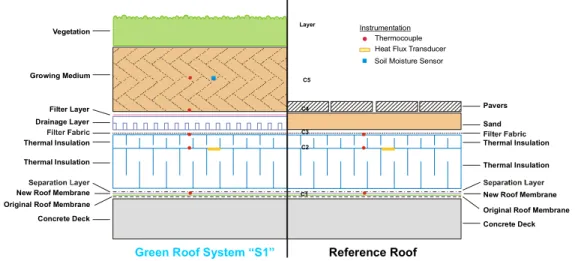
The roof was constructed as a protected membrane system (PMS) where the roofing membrane was placed below the thermal insulation. The original roof consisted of concrete deck, waterproofing membrane, separation layer, thermal insulation, sand and pavers. During green roof installation, the roof components were striped to the membrane. A new roof membrane was installed on top of the original one, and the original thermal insulation was replaced. The extensive green roof replaced the sand and pavers of the original roofing system. The Green Roof S1 at the Toronto City Hall has the same components as Green Roof System S of the Eastview Neighbourhood Community Centre except that it contains 175 mm of growing medium. Because of the deeper growing medium, this plot featured herbs, corn, bean and squash. Figure 2 shows the major components of the roofing systems and the instrumentation locations.
Figure 2 Schematics showing the principle components and sensor locations within the roofing systems at
the Toronto City Hall.
4. Results and Findings
4.1 Temperature and Heat Flow Profile Examples
The network of thermocouples and heat flux transducers (HFT) that were embedded in the roof sections (Figures 1-2) provided temperature and heat flow measurements across the roofing systems. The HFT’s were calibrated such that a positive reading represents heat entering the building while a negative reading shows heat leaving the building. The heat flow across the roofing system depends on the thermal performance of the roofing system, as well as environmental factors such as the temperature difference between the indoor and outdoor temperatures, snow coverage and solar radiation.
4.1.1 Summer Performance
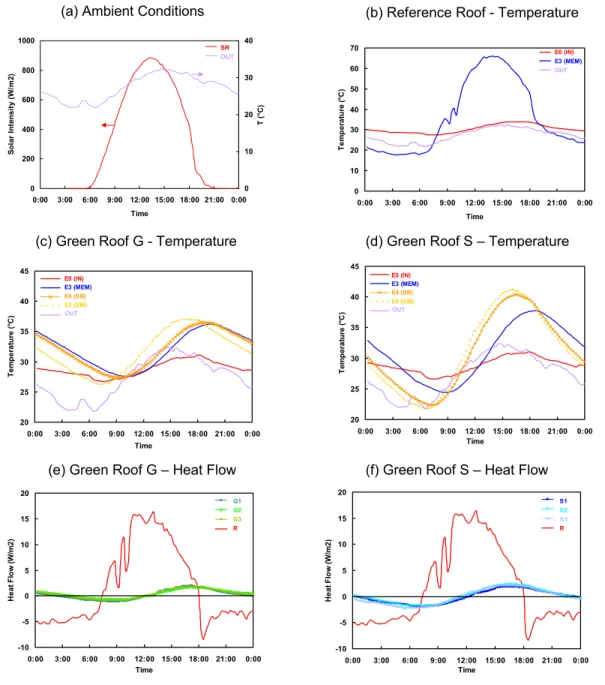
Eastview Neighbourhood Community Centre – Conventional Roofing System: Figure 3 shows the temperature and heat flow profiles within the roofing systems on a typical summer day (June 26, 2003). Being a conventional roofing system, the roof membrane on the Reference Roof absorbed solar energy and its temperature rose to 66°C at around 14:00 (Figure 3b). The green roofs significantly lowered the roof membrane temperature and delayed the peak (Figure 3c-d). The roof membrane temperature peaked at 38°C at 18:30 for Green Roof S and 36°C at 19:30 for Green Roof G. Heat started to enter the building through the Reference Roof not long after sunrise (around 06:00), reaching a maximum intensity of about
15 W/m2 (Figure 3e-f), and continued until the evening shortly before sunset (around 18:00), at which time
heat gain changed to heat loss. The Green Roofs significantly reduced the heat flow (both gain and loss)
through the roofing systems to a peak intensity of less than 2.5 W/m2. Note that both Green Roofs lost heat
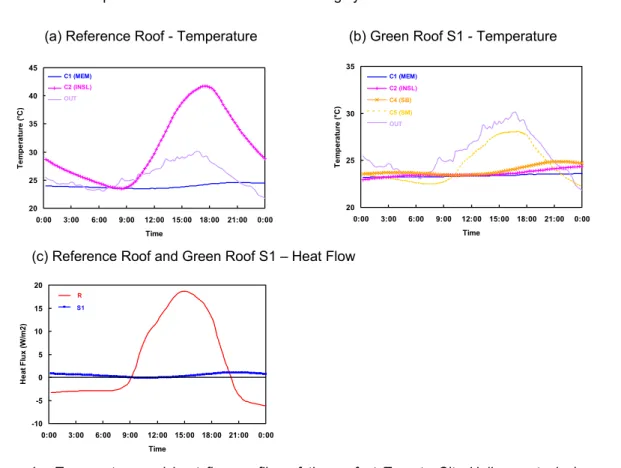
in the morning and did not start to gain heat until the afternoon, after the peak solar intensity has been reached. The temperature and heat flow profiles showed that green roofs had effectively delayed/reduced heat transfer into the building through the roofing systems, thus reducing the building’s cooling demand. Toronto City Hall – Protected Membrane System: Figure 4 shows the temperature and heat flow profiles within the roofing system on a typical summer day (August 18, 2002). Being under the thermal insulation of a protected membrane system, the roof membrane on both the Reference and the Green Roof S1 remained steady at about 24°C. The surface temperature of the lower insulation (layer C2) reached over 40°C at around 18:00 – delayed from the peak solar radiation due to the insulation effect of the upper insulation layer (Figure 4a). In comparison, the temperature of the lower insulation layer under Green Roof S1 remained below 25°C throughout the day (Figure 4b). The temperature of the middle of the growing medium followed
Growing Medium
Filter Layer Drainage Layer Thermal Insulation Thermal Insulation
New Roof Membrane Original Roof Membrane Concrete Deck C1 C4 C5 C3 C2 Pavers Sand Thermal Insulation Thermal Insulation
New Roof Membrane Original Roof Membrane Concrete Deck Thermocouple
Instrumentation Heat Flux Transducer Soil Moisture Sensor Vegetation
Green Roof System “S1” Reference Roof
closely to the outdoor temperature but that of the bottom of growing medium was relatively stable at below 25°C. Green Roof S1 significantly reduced the heat flow through the roofing systems to a peak intensity of
1 W/m2 (Figure 4c). The building lost heat in the early morning and late evening through the Reference Roof
and the Green Roof reduced and delayed the heat flow between the building and its environment.
Figure 3 Temperature and heat flow profiles of the roof at the Eastview Neighbourhood Community Centre
on a typical summer day (June 26, 2003). Note that the temperature scale of the green roofs have been expanded for clarity in (c) and (d). Refer to Figure 1 for locations of sensors.
4.1.2 Winter Performance
Eastview Neighbourhood Community Centre – Conventional Roofing System: Figure 5 shows the temperature and heat flow profiles within the roofing systems on a typical winter day with light snow coverage of less than 25 mm (January 5, 2003). The roof membrane on the Reference Roof was stable at around 0°C throughout the day (Figure 5b). The growing media in the two green roofs were frozen, as indicated by the temperature of the growing medium (E4 and E5) (Figure 5c-d). All three roof sections lost
heat throughout the day (Figure 5e-f). The Reference Roof lost at about 8 – 9 W/m2, relatively steady due to
the light snow coverage. The Green Roofs reduced the heat loss from the building slightly to about 6 –
8 W/m2. Note that the increase in indoor temperature under the Green Roofs and the increase in heat loss
030626, WS-T, SR 0 200 400 600 800 1000 0:00 3:00 6:00 9:00 12:00 15:00 18:00 21:00 0:00 Time S o la r In te n s ity (W /m 2 ) 0 10 20 30 40 T ( °C) OUT SR 030626, TC-R 0 10 20 30 40 50 60 70 0:00 3:00 6:00 9:00 12:00 15:00 18:00 21:00 0:00 Time Tem p er at ur e ( °C ) OUT E3 (MEM) E0 (IN) 030626, TC-G2 20 25 30 35 40 45 0:00 3:00 6:00 9:00 12:00 15:00 18:00 21:00 0:00 Time Tem p er at ur e ( °C ) Series1 Series4 Series5 Series6 Series7 E3 (MEM) E0 (IN) E5 (SM) E4 (SB) OUT 030626, TC-S2 20 25 30 35 40 45 0:00 3:00 6:00 9:00 12:00 15:00 18:00 21:00 0:00 Time T e m p e rat ur e ( °C ) Series1 Series4 Series5 Series6 Series7 E3 (MEM) E0 (IN) E5 (SM) E4 (SB) OUT 030626, HFT-G -10 -5 0 5 10 15 20 0:00 3:00 6:00 9:00 12:00 15:00 18:00 21:00 0:00 Time H eat Fl ow ( W /m 2) Series1 Series2 Series3 Series4 G2 G3 R G1 030626, HFT-S -10 -5 0 5 10 15 20 0:00 3:00 6:00 9:00 12:00 15:00 18:00 21:00 0:00 Time H eat Fl ow ( W /m 2) Series1 Series2 Series3 Series4 S2 S3 R S1
(a) Ambient Conditions (b) Reference Roof - Temperature
(c) Green Roof G - Temperature (d) Green Roof S – Temperature
during the day were due to the operational needs of the gymnasium under the green roof compared to the more stable indoor temperature in the mechanical room under the Reference Roof.
Toronto City Hall – Protected Membrane System: The temperature and heat flow profiles were relatively stable throughout the day due to the insulating effects of the snow coverage – similar to the conventional roofing system at the Eastview Neighbourhood Community Centre. However, since the growing medium at Green Roof S1 at the Toronto City Hall was deeper (175 mm) than Green Roof S at the Eastview Neighbourhood Community Centre (75 mm), the lower portion of the growing medium did not freeze for part of the winter and it provided extra insulation to the roofing system.
Figure 4 Temperature and heat flow profiles of the roof at Toronto City Hall on a typical summer day (August 18, 2002). Note that the temperature scale of the green roof has been expanded for clarity. Refer to Figure 2 for locations of sensors.
4.2 Heat Flow and Energy Demand Statistics
4.2.1 Eastview Neighbourhood Community Centre – Conventional Roofing System
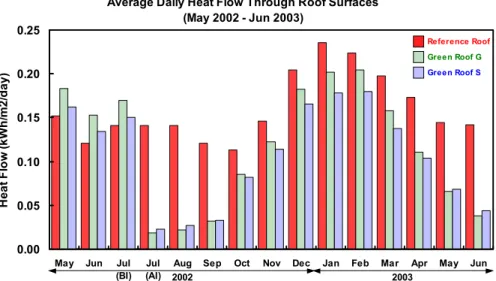
Assuming the temperature inside the building was to be kept constant, then any heat flow between a building and its environment creates energy demand for space conditioning. Therefore, the energy demand for space conditioning due to the roof can be estimated by the sum of the heat entering and leaving through the roof. The heat flow through the roof was obtained by integrating the heat flux over time or computing the area under the heat flux curve (Figures 3e-f and 5e-f). The positive areas (above the x-axis) representing heat gain and the negative areas (below the x-axis) representing heat loss per unit roof area. Their sum represents the total daily heat flow through the roof. The daily heat flow through the roof section was further averaged over each month to smooth out day-to-day variations. The heat flow data through the three instrumentation locations on each Green Roof were averaged to minimize spatial differences across the roof. The normalized average daily heat flows through the roof over the observation period are summarized in Figure 6. Note that the roof membranes on the three roof sections were bare during May – July 2002 before the green roofs were installed. The Green Roofs consistently reduced the average daily heat flow through the roof throughout the year – more in the summer (70-90%) and less in the winter (10-30%). In the first year of monitoring, the green roofs reduced the total annual heat gain through the roof by 95% but the heat loss by only 23%. Green roofs can effectively reduce heat gain in the summer through shading, insulation, evapotranspiration and thermal mass. However, the effectiveness of these thermal mechanisms greatly diminishes when the plants die back and growing medium becomes frozen in the winter.
020818, TC-R 20 25 30 35 40 45 0:00 3:00 6:00 9:00 12:00 15:00 18:00 21:00 0:00 Time Tem p er at ur e ( °C ) Series1 Series2 Series4 C1 (MEM) C2 (INSL) OUT 020818, TC-S1 20 25 30 35 0:00 3:00 6:00 9:00 12:00 15:00 18:00 21:00 0:00 Time Tem p e rat ur e ( °C ) Series1 Series2 Series4 Series5 Series6 C1 (MEM) C2 (INSL) C4 (SB) OUT C5 (SM)
(a) Reference Roof - Temperature (b) Green Roof S1 - Temperature
020818, HFT -10 -5 0 5 10 15 20 0:00 3:00 6:00 9:00 12:00 15:00 18:00 21:00 0:00 Time H e a t Fl ux ( W /m 2) Series3 Series1 R S1
4.2.2 Toronto City Hall – Protected Membrane System
Similar energy statistics were observed for the protected membrane system at the Toronto City Hall. The Green Roof consistently reduced the average daily heat flow through the roof throughout the year. The average heat flow reduction was higher in the summer (50-90%) than in the winter (10-40%), not too different from the conventional roofing system at the Eastview Neighbourhood Community Centre.
Note that the analysis was based solely on heat flow through the roofs; it did not take into account of heat flow through the other parts of the building envelope (e.g. walls and windows), which could contribute a much higher fraction of the energy demand of the whole building, depending on the building geometry. Also, the actual cost saving depends on the type and efficiency of the heating and cooling equipment and the heating/cooling distribution systems, which are building specific.
Figure 5 Temperature and heat flow profiles of the roof at the Eastview Neighbourhood Community Centre
on a typical winter day with light snow coverage of less than 25 mm (January 5, 2003). Refer to Figure 1 for locations of sensors.
030105, WS-T, SR -20 0 20 40 60 80 100 120 140 160 0:00 3:00 6:00 9:00 12:00 15:00 18:00 21:00 0:00 Time S o la r I n te n s ity ( W /m 2 ) -5 0 5 10 15 20 25 30 35 40 Te m p e rat ur e ( °C ) OUT SR 030105, TC-R -10 0 10 20 30 0:00 3:00 6:00 9:00 12:00 15:00 18:00 21:00 0:00 Time Te m p e rat ur e ( °C ) OUT E3 (MEM) E0 (IN) 030105, TC-G2 -10 0 10 20 30 0:00 3:00 6:00 9:00 12:00 15:00 18:00 21:00 0:00 Time Tem p er at ur e ( °C ) Series1 Series4 Series5 Series6 Series7 E3 (MEM) E0 (IN) E5 (SM) E4 (SB) OUT 030105, TC-S2 -10 0 10 20 30 0:00 3:00 6:00 9:00 12:00 15:00 18:00 21:00 0:00 Time Tem p er a tur e ( °C ) Series1 Series4 Series5 Series6 Series7 E3 (MEM) E0 (IN) E5 (SM) E4 (SB) OUT 030105, HFT-G -10 -8 -6 -4 -2 0 0:00 3:00 6:00 9:00 12:00 15:00 18:00 21:00 0:00 Time H e at Fl ow ( W /m 2 ) Series1 Series2 Series3 Series4 G2 G3 R G1 030105, HFT-S -10 -8 -6 -4 -2 0 0:00 3:00 6:00 9:00 12:00 15:00 18:00 21:00 0:00 Time H e at Fl ow ( W /m 2) Series1 Series2 Series3 Series4 S2 S3 R S1
(a) Ambient Conditions (b) Reference Roof - Temperature
(c) Green Roof G - Temperature (d) Green Roof S – Temperature
Figure 6 Comparison of the average daily heat flow through the green roofs and reference roof at the Eastview Neighbourhood Community Centre. Note that the green roofs were installed late July 2002 (BI = before installation of green roof, AI = after installation of green roof).
4.3 Green Roof System Design Parameters
4.3.1 Growing Medium Depth
Although both green roofs at the Eastview Neighbourhood Community Centre are extensive systems, Green Roof G has deeper and lighter coloured growing medium (100 mm) than Green Roof S (75 mm). In the summer, the extra growing medium in Green Roof G reduced and delayed the peak temperature of the growing medium and the roofing membrane (Figure 3c-d), and lowered the heat flow (Figure 3e-f) through the roof compared to Green Roof S. During the summer of the first year observation period, Green Roof G reduced the average daily heat flow through the roof by about 3% more than Green Roof S (Figure 6). However, the extra growing medium was not as effective in reducing heat loss in the winter. During the cold months, October 2002 – April 2003, the heat loss through Green Roof G was higher than Green Roof S. Since there was little contribution from the vegetation due to poor plant establishment in the first year, the difference in performance was mainly attributed to the depth of the growing medium. These observations suggest that the deeper growing medium provided higher insulation, thermal mass and retention of moisture for evaporative cooling to reduce heat gain in the summer. However, the insulation value of the growing medium greatly diminished as it became frozen so the extra growing medium did not improve the thermal efficiency of the system in the winter. Therefore, it is not recommended to replace thermal insulation in the roofing system with extra growing medium in the green roof system for cold climate applications.
4.3.2 Materials and Components
Although both green roof systems at the Eastview Neighbourhood Community Centre contained the same component, the drainage layer of Green Roof S was made of expanded polystyrene panels while that of Green Roof G was a semi-rigid polymeric mat. In the summer, the temperature of the roof membrane (E3) in Green Roof G followed closely to that of the bottom of the growing medium (E4) throughout the day – the difference was less than 1°C across the semi-rigid polymeric drainage mat (Figure 3c). On the other hand, the temperature difference across the drainage layer in Green Roof S was about 4°C with a delay of close to 2 hours (Figure 3d). Temperature profile in winter showed similar pattern – the membrane under Green Roof S was consistently warmer than that under Green Roof G by about 1.5-2.0°C (Figure 5c-d). These observations suggested that the expanded polystyrene profiled drainage panel of Green Roof S provided extra insulation to the green roof system.
It is interesting to note that although the polystyrene drainage panels provided extra insulation for Green Roof S, Green Roof G outperformed Green Roof S in reducing heat gain in the summer (Section 4.3.1). This suggested that the extra growing medium in Green Roof G was more thermally effective than the extra insulation in the drainage panels in the summer, likely due to the evaporative cooling effect from the moisture in the growing medium. When the growing medium becomes frozen in the winter and lost their insulation value, heat flow data confirmed that Green Roof S was more thermally efficient than Green Roof G (Figure 5e-f). This again confirmed that the expanded polystyrene drainage panel provided extra insulation.
Average Daily Heat Flow Through Roof Surfaces (May 2002 - Jun 2003) 0.00 0.05 0.10 0.15 0.20 0.25
May Jun Jul (BI)
Jul (AI)
Aug Sep Oct Nov Dec Jan Feb Mar Apr May Jun
H eat F lo w ( kW h /m 2/ d ay) Green Roof G Green Roof S 2002 2003 Reference Roof
4.3.3 Conventional versus Protected Membrane Systems
This study showed that extensive green roofs were effective in reducing heat flow through the roofing system for both conventional and protected membrane systems. In a conventional roofing system, the membrane is exposed to the elements. It absorbed the solar radiation during the day and its surface temperature increases; it re-radiates the heat at night and its temperature drops. Therefore, the roof membrane experienced high temperatures and diurnal temperature fluctuations. High temperatures accelerate the aging process roof membranes while diurnal temperature fluctuations create thermal stresses in the membrane – they affect the long-term performance of the roof membrane. This study showed that the green roofs reduced the temperature and fluctuations experienced by the roof membrane in the summer (Figure 3c-d), thus contributing positively to its durability. Since the roof membrane is protected from the elements by the thermal insulation in a protected membrane system, it experiences relatively stable temperature year round (Figures 4a-b). Therefore, the benefits of the green roof in reducing membrane temperature and fluctuations are minimal in protected membrane systems.
5. Conclusions
1. First year observations of two in-service extensive green roofs in the City of Toronto showed that green roofs are effective in reducing heat flow through the roof, thus lowering the energy demand for space conditioning in the building, for both conventional and protected membrane roofing systems.
2. The green roofs were more thermally effective in the summer than in the winter. The two lightweight extensive green roofs (75-100 mm growing medium) installed on a conventional roofing system reduced the heat flow through the roofing system by 70-90% in the summer but only 10-30% in the winter. 3. The components and materials used in a green roof system could affect its performance. Green Roof G
was slightly more effective (about 3%) in reducing heat flow in the summer due to its deeper and lighter colored growing medium. However, Green Roof S was more effective (about 10%) in reducing heat flow in the winter due to the extra insulation value in its drainage layer.
4. Growing medium was shown to be effective in reducing heat gain through the roof in the summer via increased insulation, evaporative cooling and thermal mass. However, when the growing medium became frozen in the winter, its insulation value greatly diminished. Therefore, it is not recommended to replace the thermal insulation with extra growing medium in green roofs for cold climate applications. 5. The green roofs were effective in reducing high temperature and diurnal temperature fluctuations
experienced by the roof membrane in conventional roofing system in the summer. Since the roof membrane in protected membrane system is protected from the elements by the thermal insulation, the effects of the green roof in reducing membrane temperature and fluctuations become minimal.
References
Bass, B. 2001, Addressing urban environmental problems with green roofs, Encyclopedia of Global Environmental Change, vol. 3, John Wiley & sons, Chichester, U.K.
Natural Resources Canada 2004, Energy Use Data Handbook Tables (Canada), Table 2 and Table 3, 2002 data. URL: http://oee.nrcan.gc.ca/neud/dpa/handbook_totalsectors_ca.cfm?text=N&printview=N
Christian, J.E. and Petrie, T.W. 1996, Sustainable Roofs with Real Energy Savings, Proceedings of the Sustainable Low-Slope Roofing Workshop, ed. Desjarlais, A., Oak Ridge National Laboratory, Oak Ridge, Tennessee, p.99.
Environmental Building News, November 2001, p11.
Eumorfopoulou, E. and Aravantinos, D. 1998, The Contribution of a Planted Roof to the Thermal Protection of Buildings in Greece, Energy and Buildings, 27:29-36.
Liesecke, H-J., Krupka, B., Brueggemann, H. 1989, Grundlagen der Dachbegruenung Zur Planung, Ausfuhrung und Unterhaltung von Extensivbegruenungen und Einfachen Intensivbegruenungen, Patzer Berlag, Berlin – Hanover, p.28.
Liu, K. and Baskaran, B. 2003, Thermal Performance of Green Roofs through Field Evaluation, Proceedings of Greening Rooftops for Sustainable Communities, Chicago.
Minke, G. und Witter, G. 1982, Haeuser mit Gruenem Pelz, Ein Handbuch zur Hausbegruenung, Verlag Dieter Fricke GmbH, Frankfurt.
Palomo Del Barrio, E. 1998, Analysis of the Green Roofs Cooling Potential in Buildings, Energy and Buildings, 27:179-193.