A clinical study of motor evoked potentials using a
triple stimulation technique
M. R. Magistris,
1K. M. Ro¨sler,
2A. Truffert,
1T. Landis
1and C. W. Hess
2Departments of Clinical Neurology,1Geneva and2Berne Correspondence to: Dr Michel R. Magistris, Unite´ University Hospitals, Switzerland d’Electroneuromyographie, Clinique de Neurologie,
Hoˆpitaux Universitaires de Gene`ve, CH-1211 Geneva 14, Switzerland
E-mail: [email protected]
Summary
Amplitudes of motor evoked potentials (MEPs) are usually much smaller than those of motor responses to maximal peripheral nerve stimulation, and show marked variation between normal subjects and from one stimulus to another. Consequently, amplitude measurements have low sensitivity to detect central motor conduction failures due to the broad range of normal values. Since these characteristics are mostly due to varying desynchroniza-tion of the descending acdesynchroniza-tion potentials, causing different degrees of phase cancellation, we applied the recently developed triple stimulation technique (TST) to study corticospinal conduction to 489 abductor digiti minimi muscles of 271 unselected patients referred for possible corticospinal dysfunction. The TST allows resynchroniza-tion of the MEP, and thereby a quantificaresynchroniza-tion of the proportion of motor units activated by the transcranial stimulus. TST results were compared with those of
Keywords: collision technique; corticospinal tract; magnetic transcranial stimulation; transcranial cortical stimulation; quantification of central motor conduction defects
Abbreviations: ADM5 abductor digiti minimi; ALS 5 amyotrophic lateral sclerosis; CMAP 5 compound muscle action potential (evoked by peripheral stimulation); CMAPErb 5 CMAP evoked by Erb’s point stimulation; CMAPwrist 5 CMAP evoked by wrist stimulation; CMCT5 central motor conduction time; MEP 5 motor evoked potential (evoked by transcranial stimulation); MRV 5 mean rectified voltage (of maximal voluntary isometric EMG activity); TST 5 triple stimulation technique
Introduction
Recording of motor evoked potentials (MEPs) by transcranial magnetic brain stimulation has become an established method for the evaluation of corticospinal tract function. Clinical studies address mainly the slowing of the central motor conduction time (CMCT), a parameter which is easily obtained. The method is less successful in the evaluation of central motor conduction failures, which should be reflected by a reduced size of the MEP. Even in healthy subjects, MEPs are usually much smaller than compound muscle action potentials (CMAPs) evoked by peripheral nerve stimulation. © Oxford University Press 1999
conventional MEPs. In 212 of 489 sides, abnormal TST responses suggested conduction failure of various degrees. By contrast, conventional MEPs detected conduction failures in only 77 of 489 sides. The TST was therefore 2.75 times more sensitive than conventional MEPs in disclosing corticospinal conduction failures. When the results of the TST and conventional MEPs were combined, 225 sides were abnormal: 145 sides showed central conduction failure, 13 sides central conduction slowing and 67 sides both conduction failure and slowing. It is concluded that the TST is a valuable addition to the study of MEPs, since it improves detection and gives quantitative information on central conduction failure, an abnormality which appears to be much more frequent than conduction slowing. This new technique will be useful in following the natural course and the benefit of treatments in disorders affecting central motor conduction.
Furthermore, unlike peripheral CMAPs, the size and shape of MEPs vary from one stimulus to another and among subjects (Hess et al., 1987a; Amassian et al., 1989; Britton et al., 1991; Eisen et al., 1991; Ho¨mberg et al., 1991; Kiers et al., 1993; Nielsen, 1996; van der Kamp et al., 1996; Ellaway et al., 1998; Magistris et al., 1998). These characteristics of MEPs lead to a wide range of normal values which, as a major drawback, give size parameters that are insufficiently sensitive for the detection of small to moderate conduction failures (Hess et al., 1987a; Britton
266 M. R. Magistris et al.
Table 1 Diagnoses and anthropometric data
Diagnosis No. of Mean age Age range No. of No weakness, Weakness, no No weakness, Weakness and
patients (years) (years) sides no pyramidal pyramidal pyramidal pyramidal
syndrome syndrome syndrome syndrome
Cerebrovascular disorders 27 61 32–83 49 29 5 7 8 Degenerative CNS disorders 18 56 35–72 33 13 0 13 7 Multiple sclerosis 116 39 17–76 221 118 14 65 24 ALS 15 56 21–78 28 8 6 4 10 Cervical spondylosis 14 68 47–90 26 7 2 7 10 Other myelopathies 23 47 22–77 40 26 3 10 1
Peripheral nerve disorders 20 50 28–76 31 25 5 1 0
Diverse neurological disorders 23 45 17–71 38 25 2 11 0
Psychogenic paresis 8 31 17–43 12 9 3 0 0
Non-neurological disorders 7 48 29–63 11 8 1 2 0
All 271 47 17–90 489 268 41 120 60
et al., 1991; Mayr et al., 1991; Zentner and Meyer, 1998). Conduction abnormalities may therefore escape detection in patients with a CNS disorder who have a normal CMCT.
To solve this problem, an original method, the triple stimulation technique (TST), combining transcranial with peripheral stimulation, was developed (Magistris et al., 1998). Using this method in healthy subjects, we have demonstrated that (i) virtually all motor units supplying the target muscle can be brought to discharge by a single transcranial stimulus, (ii) the reduction in MEP size (compared with the peripheral CMAP) is due to the phase cancellation caused by desynchronization of the descending action potentials, and (iii) variable desynchronization (from one stimulus to another in the same subject) causes variation in the size and configuration of the MEP. The TST resynchronizes the MEP and thereby allows quantitative estimation of the percentage of motor units activated by the transcranial stimulus.
The aim of the present study was to evaluate the TST in patients with possible corticospinal conduction disorders.
Patients
Between 1995 and 1998, 271 patients (489 sides) were examined using the TST in our laboratories. Patients were usually referred from the clinical wards of our institutions for an electrophysiological investigation of their putative corticospinal disorder. The study was approved by the local Ethics Committees of the Geneva and Berne University Hospitals, and all patients gave informed consent. Diagnoses were taken from the patients’ medical records at the time of discharge. Anthropometric data and diagnoses are summarized in Table 1.
The patients were divided into the following groups. (i) The cerebrovascular disorders group: patients with lacunar syndrome (n5 18), hemispheric cerebral infarction
(n5 6), cerebral vasculitis (n 5 2) and brainstem infarction
(n5 1).
(ii) The degenerative CNS disorders group: patients with neurodegenerative disorders other than amyotrophic lateral sclerosis (ALS), i.e. multiple system atrophy (n 5 11),
Parkinson’s disease (n 5 2), Friedreich’s ataxia (n 5 1), Huntington’s chorea (n 5 1), primary lateral sclerosis
(n5 1), spinal muscular atrophy (n 5 1) and undetermined
disorder (n5 1).
(iii) The multiple sclerosis group: patients with definite
(n5 94), probable (n 5 14) and suspected (n 5 8) multiple
sclerosis according to Poser’s criteria (Poser et al., 1983). (iv) The ALS group: patients with predominantly upper motor neuron syndrome (n 5 9) or predominantly lower motor neuron syndrome (n5 6).
(v) The cervical spondylosis group (n5 14).
(vi) The other myelopathies group: patients with post-traumatic myelopathy (n5 4), abnormal intramedullary MRI signal of undetermined origin (n5 4), AIDS-related vacuolar myelopathy (n5 3), radiation myelopathy (n 5 3), tumoural myelopathy (n 5 3), metabolic myelopathy (n 5 2), syringomyelia (n 5 2), HTLV1-related spastic paraparesis
(n5 1) and vascular myelopathy (n 5 1).
(vii) The peripheral nerve disorders group: patients with radiculopathy (n 5 5), polyradiculoneuropathy and poly-neuropathy (n5 5), multifocal motor neuropathy (n 5 4), acute brachial plexus neuropathy (n 5 1), brachial plexus injury (n 5 1), carpal tunnel syndrome (n 5 1), chronic inflammatory demyelinating polyneuropathy (n5 1), ulnar neuropathy (n5 1) and undetermined proximal upper limb neuropathy (n5 1).
(viii) The diverse neurological disorders group: patients with head injury sequel (n 5 4), hydrocephalus (n 5 3), metabolic encephalopathy (n 5 3), migraine (n 5 2), idiopathic facial paresis (n 5 1), idiopathic myoclonus
(n 5 1), Lance–Adams syndrome (n 5 1), Little’s disease
(n 5 1), neuroborreliosis (n 5 3), listeriosis (n 5 1),
neurosarcoidosis (n 5 1), systemic lupus (n 5 1) and systemic mastocytosis (n5 1).
(ix) The psychogenic paresis group: patients in whom an organic cause of the neurological deficit could be ruled out; four of these patients recovered abruptly during the days that followed the electrophysiological examination.
(x) The non-neurological disorders group: patients with symptoms of rheumatological or dermatological origin
(n 5 5) and visual disturbances of ophthalmological origin
(n5 2).
In all patients, the degree of muscle weakness was graded clinically, using a scale of four steps: no weakness (corresponding to M5 on the British Medical Council scale), moderate paresis (M4 and M3), severe paresis (M2 and M1) and plegia (M0). The presence of increased muscle tone, of abnormally brisk tendon reflex and of Babinski or Hoffmann signs on the side of the examined upper limb is referred to in this paper as ‘pyramidal syndrome’.
Method
Peripheral conduction and ‘conventional’ motor
evoked potentials
The experiments were carried out using a Viking III or IV EMG apparatus (Nicolet, Madison, Wisconsin, USA). Bandpass filtering was between 2 Hz and 10 kHz. Recordings were taken from the abductor digiti minimi (ADM) using the muscle belly–tendon technique with surface electrodes (diameter 0.8 cm). A ground electrode was taped to the dorsum of the hand. The patient lay supine with the hand held in place by a 2.5 kg sandbag; fingers II–V were taped together. Each examination started with measurement of the CMAPs evoked by maximal stimulation of the ulnar nerve at the wrist (CMAPwrist) and at Erb’s point (CMAPErb), both at rest and during a slight voluntary contraction of the ADM. Stimulating electrodes were taped at both stimulation sites. At the wrist, stimuli were applied via two silver electrodes (diameter 0.8 cm), the cathode being taped over the ulnar nerve proximal to the pisiform bone and the anode posteriorly on the wrist at the same level, in order to avoid anodal stimulation. At Erb’s point, monopolar stimulation was used, as described previously (Roth and Magistris, 1987), with a small cathode electrode taped over Erb’s point (diameter 1 cm) and a large remote anode electrode (surface area, 30 cm2) taped over the internal region of the suprascapular fossa. To detect variations in the innervation of hand muscles and to measure the influence of volume conduction from the muscles innervated by the median nerve, bipolar stimulation of the median nerve was also performed at the wrist or elbow, or both. The latency to the negative take-off from baseline and the amplitude and area of the negative peak of the CMAP were measured. The minimal ulnar F-wave latency was measured following wrist stimulations, using ù16 recordings. MEPs were obtained by magnetic transcranial stimuli using a Magstim 200 stimulator (Magstim Company, Spring Gardens, Whitland, Dyfed, UK ) with a circular 90 mm hand-held coil. The centre of the coil was at the vertex or slightly lateral towards the stimulated hemisphere. Face ‘A’ (visible face) was used for stimulation of the left hemisphere and face ‘B’ for right hemisphere stimulation. Slight displacements were made in all directions until the position yielding the lowest threshold was found. The coil was then kept in the same position throughout the
examination. Magnetic stimuli were usually applied while the subject was slightly contracting the target ADM. The MEP latency was defined as the shortest latency from eight responses. The central motor conduction time (CMCT) was calculated using the formula: CMCT 5 MEP latency – (F latency1 CMAPwristlatency – 1)/2 (Rossini et al., 1985). For comparison of the MEPs and peripheral CMAPs evoked at Erb’s point, the amplitude ratio (MEP : CMAPErb) was used.
Triple stimulation technique (Fig. 1)
The technique has been described in detail previously (Magistris et al., 1998). An external electrical stimulator (Digitimer DS7 or DISA 15E O5–6) and an external timer (DISA delay unit 15 E 26 or Digitimer D4030) were used as additional equipment. Three stimuli were given, leading to two collisions (Fig. 1A). A first stimulus was applied to the scalp overlying the motor cortex. After an appropriate delay, a second maximal stimulus was applied over the ulnar nerve at the wrist. The delay was chosen so that the action potentials descending from the cortex collided with the antidromic action potentials evoked at the wrist, with the collision site at the wrist and above. After another delay, a third stimulus was applied to Erb’s point. This delay was chosen so that ascending antidromic action potentials evoked by wrist stimulation collided at or slightly distal to Erb’s point. It was the response to this third stimulation that was studied. To account for factors influencing the response to the third stimulation (it is often smaller than that evoked by a single stimulus performed at Erb’s point), such as a possible ‘back-response’ caused by myoaxonal ephaptic excitation of axons by the wrist stimulus (Roth and Egloff-Baer, 1979), the TST test curve was compared with a TST control curve in which the first stimulus was applied to Erb’s point. Stimuli were thus applied successively to Erb’s point, the wrist, then Erb’s point again (Fig. 1B). Quantification of the excited motor axons was then done by calculation of the amplitude ratio of the second main deflections of the TST test and control curves (TSTtest: TSTcontrol). The area of the responses was also measured; however, the use of amplitude proved to be more precise and was therefore preferred (Magistris et al., 1998). Assuming as an approximation that all motor unit potentials that compose the CMAP have a similar size, this ratio corresponds to the proportion of motor units excited in the target muscle. If a cortical stimulus succeeds in exciting all spinal motor axons innervating the target muscle, a maximal motor response follows the third stimulus applied to Erb’s point and the ratio is 100%; if all axons fail to conduct following brain stimulation, no motor response follows the third stimulus applied to Erb’s point and the ratio is 0%; if a number of axons conduct while others do not, the motor response to Erb’s stimulus is reduced in amplitude and area (Fig. 1).
In all patients, several TST curves were recorded using increasing intensities of transcranial stimulation until the best possible superimposition of the TST test and control curves
268 M. R. Magistris et al.
Fig. 1 (A) Principle of the TST. The motor tract is simplified to three corticospinal axons (a, b and c) with monosynaptic connections to
three peripheral axons (this simplification does not account for the complexity of corticospinal connections). Horizontal lines represent the muscle fibres of the three motor units. One corticospinal axon (c) does not conduct due to a CNS lesion. (A1) After maximal transcranial stimulation, action potentials (shown as arrows) descend only in axons (a) and (b). Desynchronization of the two action potentials is assumed to occur within the corticospinal tract (or possibly at spinal cell level). On axon (b), multiple volleys descend (*). (A2) After a delay, a second maximal stimulus is given at the wrist, leading to descending (orthodromic) action potentials causing a first negative deflection of the TST test curve, and to ascending (antidromic) action potentials in all three peripheral axons. Two of the ascending action potentials collide and cancel with the action potentials descending in axons (a) and (b). The sites of collision are different due to the desynchronization of the descending action potentials. The multiple volleys descending from the central motor neuron (b) cause a double discharge of the spinal motor neuron (b); the second discharge (*) on axon (b) is not cancelled and continues to descend. The action potential on axon (c) continues to ascend because no collision occurred. (A3) After a delay, a third maximal stimulus is given at Erb’s point, evoking action potentials which descend on axons (a) and (b), while a collision occurs in axon (c). The second discharge (*) in axon (b) arrives at the muscle and causes a negative deflection. (A4) As a result, a synchronized response from the two axons (a) and (b) that were initially excited by the transcranial stimulus is recorded as a second main deflection of the TST test curve. The TST control curve is recorded by replacing the first stimulus at the cortex by a stimulus at Erb’s point (succession of stimuli: Erb–wrist–Erb) with appropriate adjustments of the delays. (B) Possible TST results. In B1, B2 and B3, three curves are superimposed (the TST test curve, the TST control curve and a response to wrist stimulation yielding a baseline). The three situations that may be encountered are illustrated in B1, B2 and B3. (B1) Partial conduction failure, corresponding to the situation depicted in A. The size of the TST test curve is smaller than that of the TST control curve since (in this example) one of the three spinal motor axons innervating the ADM target muscle does not respond to the transcranial stimulus. The shaded area indicates the difference between TST control and test curves. (B2) Normal conduction is assumed if TST test and control curves are superimposed (all spinal motor axons innervating the ADM are brought to discharge by the transcranial stimulus). (B3) Complete conduction failure. The TST test trace is superimposed on the baseline (no spinal motor axons innervating the ADM respond to the transcranial stimulus).
was obtained. Various facilitation manoeuvres were used, namely: (i) maximal contraction of the contralateral ADM; (ii) thinking about a contraction of the target ADM; and (iii) slight contraction of the target ADM. These manoeuvres were also performed in combinations. The TSTtesttrials were preceded and followed by the recording of a TSTcontrolcurve. Exact superimposition of the first main negative deflection (CMAPwrist) of the TSTtestand TSTcontrolcurves demonstrated that the target muscle remained in the same position throughout the examination (Roth and Magistris, 1989;
Magistris et al., 1998). The EMG activity from the loudspeaker was used to monitor the contraction or rest.
Normal values
Normal limits for CMCT, MEP amplitude ratio and TST amplitude and area ratios were derived from the values obtained in 22 normal subjects (39 sides) studied previously (Magistris et al., 1998) using 2.5 SD limits. These normal limits were as follows: CMCT, ø8.0 ms; MEP amplitude
ratio (MEP : CMAPErb), ù33%; TST amplitude ratio (TSTtest: TSTcontrol),ù93%; area ratio, ù92%. The TST was considered abnormal only if both amplitude and area ratios were below normal values. Conduction failure was then expressed as a percentage, using the amplitude ratio. In sides without conspicuous clinical weakness, we reviewed all abnormal MEPs and TST amplitude ratios for possible false-positive results.
Additional studies
Each time when it was appropriate with respect to the clinical question, conventional MEPs were also recorded from the lower limbs (tibialis anterior and/or abductor hallucis). Results of these examinations were considered in some cases to help in reaching a diagnosis but will not be reported in this article, which focuses on the MEP and TST performed on the upper limbs.
In 173 out of 271 patients (311 of 489 sides) the presence of an H reflex of the ADM was sought, at rest, using eight or more electrical stimuli of 1 ms duration (including near-threshold stimuli) applied to the ulnar nerve at the wrist (Ioku et al., 1984).
In 141 patients (259 sides) the surface EMG of the ADM during maximal isometric voluntary activity was recorded and the largest mean rectified voltage (MRV) of three trials was measured (trials were separated by ù1.25 min rest periods). MRV using surface recordings has been demonstrated to be a reliable electromyographic descriptor of muscle force (Philipson and Larsson, 1988). To adjust for variation among normal subjects and for muscle weakness due to peripheral axonal loss, the MRV (expressed inµV) was divided by the amplitude of the CMAP obtained by electrical stimulation at the wrist (expressed in mV). This corrected MRV (MRV : CMAPwrist) was considered as roughly reflecting the upper motor neuron activity during maximal voluntary activity.
Both H reflex and MRV recordings attempted to determine a relationship between clinical signs (pyramidal syndrome and weakness, respectively) and electrophysiological parameters.
Statistics
To test differences between group means, non-parametric tests were applied throughout (Mann–Whitney test for unpaired two-group comparisons, Kruskal–Wallis test for the comparison of multiple groups). Variables were correlated using standard linear regression analysis. The null hypothesis was rejected at the 0.05 level of significance.
Results
TST results in patients (Figs 2–5, Table 2)
The TST was abnormal in 212 of 489 sides (43%). Twenty-eight additional sides had a slightly abnormal amplitude ratio
(mean 90.1%; range 83–93%) but a normal area ratio and were therefore considered as normal.
In the different groups of disorders, the percentage of sides with a conduction failure was between 9 and 58% (Table 2). Severe conduction failure (TST amplitude ratio ,40%) occurred most often in disorders associated with central axonal lesions, i.e. degenerative disorders of the CNS, ALS and cerebrovascular disorders (Fig. 2B). Severe conduction failures were also found, however, in multiple sclerosis, indicating presence of central conduction block and/or of axonal lesions. Conduction failures were found in seven patients (seven sides) with peripheral nerve disorders. Three of these patients had proximal brachial plexopathies (one idiopathic, two as a manifestation of multifocal motor neuropathy), two had cervical radiculopathies and two had polyradiculoneuropathies. In these patients the TST amplitude abnormality was caused by proximal peripheral nerve conduction blocks located in the small portion of the peripheral nervous system tested by the TST (i.e. between the anterior horn and Erb’s point). An abnormal TST amplitude ratio was also found in two patients (two sides) with a psychogenic paresis and in one patient (one side) with a non-neurological disorder; however, the ratio was only slightly abnormal (82, 88 and 89%, respectively) and was attributed to lack of co-operation leading to insufficient facilitation, since some facilitation is often required to obtain a normal amplitude ratio even in normal subjects (Magistris et al., 1998).
The conduction failure measured by the TST mirrored the degree of clinical weakness irrespective of the type of CNS disorder, since there was a linear relationship between the mean TST amplitude ratio and the mean degree of weakness (Fig. 3). This relationship was not found in disorders where muscle weakness was not, or not mainly, caused by a central conduction failure, i.e. in peripheral nerve disorders, in ALS with predominant lower motor neuron deficits, in psychogenic paresis and in non-neurological disorders (Fig. 3).
The range of TST amplitude values at a given grade of weakness was rather large (Fig. 4). A possible reason is that the clinical assessment of ADM weakness was imprecise, especially when paresis was slight, and in disorders affecting both sides. On the other hand, the range of variation in TST amplitude ratio differed at different degrees of muscle weakness. It was relatively small in sides with clinically normal muscle force or slight weakness, but larger at higher degrees of muscle weakness (Fig. 4A). A markedly decreased TST amplitude ratio was usually associated with a severe degree of muscle weakness, whereas marked muscle weakness was not consistently associated with a decreased TST amplitude ratio (Fig. 4A). A similar observation was made when using the corrected MRV of the maximal isometric surface EMG (Fig. 4B). This was observed in peripheral disorders, in ALS and in non-neurological disorders, but also in purely central disorders. In 13 patients (13 of 259 sides tested with maximal isometric surface EMG) with a CNS disorder who had both a weakness and a marked reduction
270 M. R. Magistris et al.
Fig. 2 (A) Conventional MEP abnormalities (as percentages of sides) in the different groups of
disorders. Upper bars: quantified prolongation of the CMCT; lower bars: conduction failures as detected by the MEP amplitude ratio (MEP : CMAPErb). The numbers of patients in each group are given in
Table 1. (B) TST abnormalities (as percentages of sides). Bars indicate the quantified conduction failures derived from the TST amplitude ratio (TSTtest: TSTcontrol).
of maximal surface EMG (corrected MRV ,40), the TST amplitude ratio was.70% (Fig. 4B).
Among the 268 sides without clinical conspicuous weakness and without pyramidal syndrome (Table 1), 56 sides had an abnormal TST. In 15 of these sides, interference of multiple descending discharges with the TST recording was identified as a possible cause of amplitude (and area) measurement error, as also observed in some normal subjects. It is possible that in some of these 15 sides conduction failure
was overestimated. The average TST amplitude ratio in these 15 sides was 80% (range 49–90%). In the remaining 41 of 56 sides no technical cause of error could be found, pointing to the possibility of subclinical conduction failures. The average TST amplitude ratio in these 41 sides was 79% (range 47–93%).
The average decrease in the TST amplitude ratio was more marked in sides with a pyramidal syndrome than in sides without a pyramidal syndrome (Fig. 5). This was also true
T able 2 Corticospinal abnormalities: number and per centage of sides with abnormal findings using conventional MEPs and TST No. of MEP 1 TST MEP TST Gain by TST sides Conduction slowing Conduction failure Slowing and All conduction All conduction Conduction Conduction Overall Conduction only only failure abnormalities abnormalities failure failure failure n % n % n % n % n % n % n % Cerebrovascular disorders 49 1 (4 nr) 2 2 0 4 1 2 4 2 3 4 7 1 1 2 2 9 18 22 45 2.09 3 2.44 3 Degenerative CNS disorders 33 0 (1 nr) 0 1 4 4 2 5 16 19 58 9 2 7 7 21 19 58 2.1 1 3 2.71 3 Multiple sclerosis 221 7 (2 nr) 3 6 5 2 9 4 1 1 9 1 13 51 60 27 37 17 106 48 1.88 3 2.86 3 ALS 28 0 (2 nr) 0 7 25 6 2 3 1 3 4 6 9 3 2 6 21 13 46 1.44 3 2.17 3 Cervical spondylosis 26 5 1 9 4 15 10 38 19 73 17 65 1 1 42 14 54 1.12 3 1.27 3 Other myelopathies 40 0 0 1 5 3 8 1 3 1 6 4 0 3 8 2 5 1 6 4 0 5.33 3 8.00 3 Peripheral nerve disorders 31 0 0 6 1 9 1 3 7 2 3 4 1 3 3 10 7 2 3 1.75 3 2.33 3 Diverse neurological disorders 38 0 0 1 1 2 9 1 3 1 2 3 2 3 8 2 5 1 2 3 2 4.00 3 6.00 3 Psychogenic paresis 12 0 0 2 1 7 0 0 2 1 7 0 0 0 0 2 1 7 Non-neurological disorders 1 1 0 0 1 9 0 0 1 9 0 0 0 0 1 9 All sides 489 13 (9 nr) 3 145 29 67 14 225 46 1 1 6 2 4 7 7 1 6 212 43 1.94 3 2.75 3 nr 5 no response (number of sides). All conduction abnormalities 5 conduction slowing only 1 conduction failure only 1 slowing and failure.
272 M. R. Magistris et al.
Fig. 3 Relationship between mean TST amplitude ratio and mean degree of paresis. The latter was
calculated using values of 5, 3.5, 1.5 and 0 for pareses graded M5, M4/3, M2/1 and M0, respectively. Standard errors of the mean are given for both parameters. There is a linear correlation between the TST amplitude ratio and the degree of paresis in purely central disorders (filled circles). This correlation does not exist in predominantly peripheral disorders or in psychogenic paresis (open squares). The horizontal broken line indicates the lower normal limit of the TST amplitude ratio (93%). LMN5 lower motor neuron; UMN5 upper motor neuron.
when only the purely central disorders were taken into account in the latter group (not shown).
An H reflex of the ADM was recorded in 25 of the 311 sides tested (8%). A pyramidal syndrome was present in 18 of these 25 sides (72%), whereas an H reflex was recorded in only 18 of 130 sides (14%) with a pyramidal syndrome. The average TST amplitude ratio in the 18 sides presenting with a pyramidal syndrome and an H reflex was 77.6% (range, 28–100%); in the 112 sides with a pyramidal syndrome but without an H reflex it was 77.3% (range 0–102%).
Comparison and combination of conventional
MEP and TST results
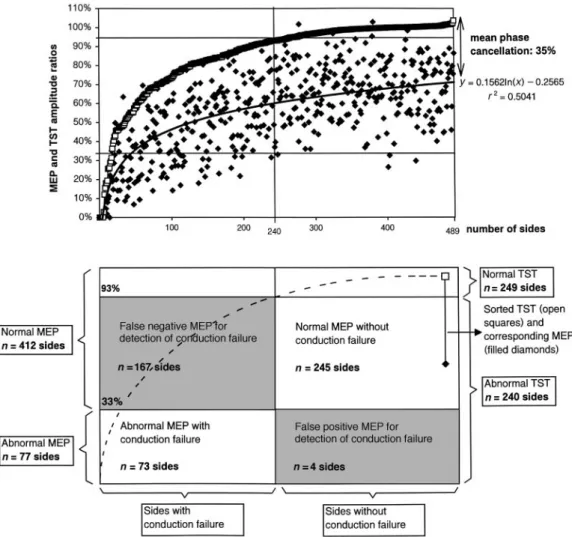
The TST was 2.75 times more sensitive than conventional MEPs in detecting a conduction failure since the amplitude ratio of conventional MEPs was abnormal in 77 sides, whereas the amplitude ratio of the TST was abnormal in 212 sides (Table 2). The average MEP amplitude ratio was 0.65 times (SD5 0.21; range 0.00–1.31 times) that of the TST. The difference between the average MEP and TST amplitude ratios represents the mean phase cancellation. Interindividual variation in this difference was large and unpredictable from inspection of the MEP (Fig. 6). Although phase cancellation usually reduced the MEP size, on average by approximately
one-third, there were 10 sides in which the conventional MEP amplitude ratio was larger than the TST amplitude ratio. This may be due to motor neuron multiple discharges increasing the MEP size, or possibly to synchronization of potentials, leading to phase addition. In four sides, an important desynchronization led to an abnormal MEP amplitude ratio while the TST amplitude ratio was normal, disproving a central conduction failure.
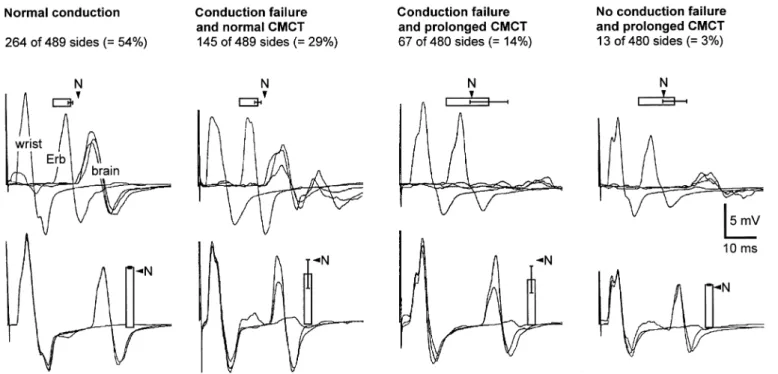
The CMCT was abnormal in 80 sides (16%; Fig. 2, Table 2). Thirteen of these sides (3%) had a prolonged CMCT as the only abnormal finding (Table 2). By combining the CMCT and the results of the TST, four distinct situations were identified according to the characteristics of the corticospinal conduction (Fig. 7, Table 2): (i) sides with normal CMCT and absence of conduction failure (54% of all sides); (ii) sides with normal CMCT and presence of conduction failure (29%); (iii) sides with both increased CMCT and conduction failure (14%); and (iv) sides with increased CMCT and absence of conduction failure (3%). Increased CMCTs, with or without conduction failure, were most often observed in cervical spondylosis (Table 2). Increased CMCTs were also found in disorders associated with loss of axons, such as ALS and cerebrovascular disorders (Fig. 2, Table 2). In these disorders, CMCT was prolonged only in sides with markedly reduced TST amplitude ratios. There was some relationship
Fig. 4 Relationships between muscle force and amplitude ratios obtained by TST and conventional MEPs. Force was assessed clinically
(A) and by the MRV of the surface EMG during maximal voluntary isometric activity, corrected for CMAP amplitudes after wrist stimulation (B). Horizontal broken lines indicate lower normal limits of the TST amplitude ratio (93%) and of the MEP amplitude ratio (33%). Shaded areas indicate abnormal values. In A, boxes indicate the following percentiles: 5th and 95th (handles); 25th and 75th (edges of box); 50th (broad line within box). P values denote differences tested by Kruskal–Wallis ANOVA (analysis of variance). In B, filled circles depict sides of patients with a CNS disorder, open squares depict sides of patients with disorders not, or not predominantly, affecting the CNS (peripheral nerve disorders, non-neurological disorders, ALS with predominant lower motor neuron, psychogenic paresis). There is a relationship between force measurements and TST amplitude ratios: a low TST amplitude ratio is associated with severe muscle weakness and a small MRV, but a severe muscle weakness or low MRV is not consistently associated with a low TST amplitude ratio. The two patients indicated by asterisks had long-standing chronic disease (chronic progressive multiple sclerosis and primary lateral sclerosis).
between weakness and CMCT, in that CMCTs on the severely paretic sides were somewhat longer than on sides without muscle weakness (not shown).
If all abnormal MEP findings are considered (i.e. CMCT and MEP amplitude ratio), the TST increased the overall diagnostic yield in terms of the number of abnormal results, on average by a factor of 1.94 (Table 2). This increase was due to the large number of sides with conduction failures not detected by the conventional MEP examination.
Discussion
The problems of varying MEP configuration between successive stimuli and among different subjects, and of their small size compared with CMAPs after peripheral nerve stimulation, are well recognized (Rothwell, 1998). These characteristics of conventional MEPs render size parameters insensitive in the detection of central conduction deficits (Hess et al., 1987a; Britton et al., 1991). Previous attempts to address these problems have included the following: measuring the muscle twitch force along with the MEP (Marsden et al., 1981, 1983); considering the largest MEP out of several responses (Hess et al., 1987a; Eisen et al., 1991); comparing the amplitude of the MEP with that obtained on the contralateral healthy side (Hess et al., 1987b;
Zentner and Meyer, 1998); optimizing the site of stimulation over the scalp (Brasil-Neto et al., 1992) or the transcranial stimulus intensity (van der Kamp et al., 1996); standardizing facilitation by quantifying the amount of voluntary activity (Ravnborg et al., 1991; Lim and Yiannikas, 1992; Nielsen, 1996) or by increasing the muscle contraction of the target muscle to near-maximal levels (Uozumi et al., 1991); and application of vibrations to the target muscle (Rossini et al., 1987; Claus et al., 1988) or of a conditioning stimulus applied on the peripheral nerve (Date et al., 1991; Mariorenzi et al., 1991) or over the scalp (Rossini et al., 1987; Nielsen, 1996). Although these studies have brought a wealth of knowledge, they do not provide an unequivocal measure of the proportion of spinal motor neurons activated by the transcranial stimulus.
The TST estimates the percentage of motor units of the target muscle brought to discharge by transcranial stimulation. This is achieved by linking central to peripheral conductions through two collisions, and by comparing a TST test curve (stimuli: brain–wrist–Erb) with a TST control curve (stimuli: Erb–wrist–Erb; Fig. 1). The technique yields an amplitude and area ratio of the TST test curve versus the TST control curve, which is 100% if all motor neurons innervating the ADM are excited by the transcranial stimulus and 0% if none are brought to discharge. In our group of 271 patients
274 M. R. Magistris et al.
Fig. 5 Influence of presence (cross-hatched blocks; n5 180
sides) or absence (open blocks; n5 309 sides) of pyramidal syndrome (i.e. increased muscle tone, abnormally brisk reflexes and Babinski or Hoffmann signs) on the TST amplitude ratio. Sides of patients with and without pyramidal syndrome are compared. Shaded areas indicate abnormal values. P values are from the Mann–Whitney test.
(489 sides), the TST amplitude ratio was often markedly reduced. This is in contrast to normal subjects, in whom this ratio was always near 100% (Magistris et al., 1998).
The patients included in this study presented with a variety of disorders with putative central motor conduction failures (Table 1), caused either by central demyelination (e.g. central conduction block in multiple sclerosis) or by loss of axons (e.g. in ALS, cerebrovascular disorders and multiple sclerosis). A large number of patients without conspicuous motor deficit, plus the unaffected sides of patients with clinically unilateral disorders, were included to assess the ability of the TST to confirm the absence of central conduction failure or, tentatively, to disclose subclinical deficits. Furthermore, the examination was often performed before a definite diagnosis had been reached, so that a number of patients with disorders not damaging the central motor pathways were studied (e.g. peripheral neuropathies, psychogenic paresis or plegia, and other non-neurological disorders; Table 1). We were aware that, due to this unselective patient inclusion, and also to the fact that our results relate to the study of the ADM muscle only and the number of abnormal sides rather than the number of patients, the proportion of normal results would be high. As expected, and in spite of rather severe criteria for abnormalities, the proportion of abnormal conventional MEPs in this series was lower than in previous studies (Hess et al., 1987b; Hugon et al., 1987; Schriefer et al., 1989; Berardelli et al., 1991; Maertens de Noordhout et al., 1991, 1998; Mayr et al., 1991; Beer et al., 1995).
With conventional MEPs, a reduced amplitude suggesting
a central conduction failure was detected in 16% of the sides, while TST detected and quantified a conduction failure in 43% of the sides (Table 2). Compared with conventional MEPs, the TST increased the sensitivity of detection of central motor conduction failures in all groups of patients, on average by a factor of 2.75. This increased sensitivity is due to the narrow normal limits of the TST compared with the broad range of normal values of conventional MEPs. Only in cervical spondylotic myelopathies was the yield of conventional MEP comparable to that of the TST, mainly owing to the particularly frequent slowing of conduction observed in this disorder (Fig. 2), as also reported by others (Masur et al., 1989; Tavy et al., 1994; Kameyama et al., 1995; Maertens de Noordhout et al., 1998). This is probably due to the fact that cervical spondylosis combines demyelination with loss of axons (Mair and Druckman, 1953). In our group of cervical spondylosis patients, the resulting conduction slowing and conduction failure occurred in similar proportions.
It is noteworthy that the MEP amplitude ratio allowed no prediction concerning the TST amplitude ratio in a given patient (Fig. 6), because the desynchronization of the descending action potentials differed markedly among patients, an observation also made in normal subjects. The average loss of amplitude due to phase cancellation was approximately one-third (Fig. 6), a value similar to that observed in healthy subjects (Magistris et al., 1998). In four of our patients, the phase cancellation was important enough to lead to an abnormal MEP amplitude ratio, suggesting a conduction failure which was not confirmed by the TST. Thus, MEP amplitudes were not only insufficiently sensitive in the detection of conduction failure (i.e. amplitudes had to be severely reduced to detect a failure), but on some occasions a severely reduced amplitude ratio was not representative of a conduction failure. This latter situation is encountered in particular when the CMCT is prolonged and the MEP markedly desynchronized.
The TST appeared to be highly sensitive since it sometimes disclosed conduction failures of moderate degree in patients with no conspicuous muscle weakness. As a counterpart to this high sensitivity, some results were possibly falsely abnormal, as in three sides (out of 23) of three patients with non-neurological and psychogenic disorders (Fig. 2B, Table 2). Two reasons may account for these false-positive results. First, even in normal subjects, facilitation is often needed to obtain a normal TST amplitude ratio. If co-operation of the patient is not optimal, facilitation may be insufficient and the TST amplitude ratio may be abnormal (see below). Secondly, with increasing facilitation, multiple discharges of spinal motor neurons occurred, often before the TST amplitude ratio had reached normal values. These multiple discharges escape the first collision in the TST and are recorded between the two main negative deflections of the TST test curve (Fig. 1), where they may interfere with the baseline of the curve. In particular, the positive repolarization phase of the multiple discharges’ wave may
Fig. 6 Values of TST and conventional MEP amplitude ratios (n5 489 sides). Top: TST amplitude
ratios (open squares) are sorted by increasing value; corresponding MEP amplitude ratios (filled diamonds) are indicated. The best fit tendency curve of the MEP values is a logarithmic curve that closely parallels the sorted TST values, with an interval reflecting the mean phase cancellation phenomenon that explains the lower amplitudes of the MEPs. Bottom: sectors of the figure indicate the number of sides in which MEPs correctly or falsely detected (or did not detect) conduction failures, as measured by the TST. Note that the numbers of abnormal sides differ from those indicated in the text since only TST amplitude ratios are considered in this figure. In the text, TST area ratios were used to discard 28 sides from abnormal TST amplitude ratios (when areas were within normal range).
reduce the size of the second main deflection, as observed previously in healthy subjects (fig. 4 in Magistris et al., 1998). To account for this problem, the effect of multiple motor neuron discharges may be estimated by omitting the third stimulus (thus performing a single collision) and measuring the changes induced on the baseline, now undisturbed by the second main deflection of the TST. However, accurate correction is not possible in this manner, since the number of multiple discharges varies from trial to trial. An alternative would be to replace the magnetic transcranial stimulus by an electrical transcranial stimulus, since in our experience less facilitation is required and multiple discharges are of less concern (Magistris et al., 1998). However, this was not done in this series of patients. The muscle force of our patients was assessed clinically using a simple four-step scale. At given weakness grades,
there was considerable variation in the TST amplitude ratios (Fig. 4A). It is unlikely that this variation was caused entirely by imprecision of the manual force assessment since the variation differed among force grades, being smallest at near-normal muscle force, where manual testing is least precise (Andres et al., 1989). Moreover, a similar observation was made with maximal isometric surface EMG recordings, which were additionally used to assess muscle force (Fig. 4B). There was a relationship between the TST amplitude ratio and the force, since a reduction in the TST amplitude ratio was always associated with a reduction in muscle force and in the maximal isometric surface EMG (Fig. 4). Hence, the muscle force was limited in relation to the proportion of central motor neurons that could not be activated by the transcranial stimulus and which was measured by the TST. Our finding of a limitation of muscle force by the number
276 M. R. Magistris et al.
Fig. 7 Recordings from four patients, exemplifying the four types of conduction findings detected by the use of conventional MEP
(providing the CMCT) and the TST (providing a measure of conduction failure). In the upper row, recordings after stimulation at the wrist, at Erb’s point and of the brain (three responses) are superimposed. In the lower row, TST recordings are shown. Three curves are superimposed (the TST test curve, the TST control curve and a response to wrist stimulation). The sweep of the traces is delayed and starts at the time of the second stimulus (wrist). The first negative deflection stems from the second stimulus (wrist) and the second stems from the third stimulus (Erb’s point). A perfect superimposition (as in the far left and right panels) is normal (TST amplitude ratio near 100%). Bars give the average CMCT (horizontal bars) and average TST amplitude ratio (vertical bars) of the patients with each of the four types of conduction findings (handles indicate61 SD). Normal limits are indicated by N (note that the normal limits of the TST amplitude ratio differ according to the size of the TST control curve).
of activated central ‘pyramidal’ motor neurons has not been shown by conventional MEPs (Fig. 4B), but is in accordance with previous lesion studies in monkeys (Bucy et al., 1966) and man (Jane et al., 1968). Destruction of the fast-conducting ‘pyramidal’ corticospinal tract (by pedunculotomy or by cortical ablation) has been observed to lead immediately to flaccid paresis. After a period ranging from days to months, muscle force may recover (leaving the subject with some loss of dexterity) (Bucy et al., 1966; Lawrence and Hopkins, 1976), suggesting that alternative descending pathways convey force signals after such recovery. Two of our patients had low TST amplitude ratios and relatively high maximal isometric surface EMG activity (Fig. 4B). Both patients suffered from long-standing chronic affections (chronic progressive multiple sclerosis and primary lateral sclerosis) that could have allowed regenerating processes to take place. The possible role of descending supraspinal pathways other than the corticospinal tract has been discussed previously (Thompson et al., 1987). In contrast to the correlation discussed above, the weakness and reduced maximal isometric surface EMG was not accompanied by a proportionate decrease in the TST amplitude ratio in a number of sides. This lack of correlation was readily explained when weakness had a peripheral origin, such as in ALS patients with a predominantly lower motor neuron disorder, or in patients with peripheral neuropathies (Fig. 3). However, such
disproportionate weakness was also found in some 5% of patients with central disorders (Fig. 4B). In these patients, the reduction in the proportion of activated central motor neurons could not explain the importance of the weakness. This could have been caused by insufficient collaboration during force measurements in a number of patients. Alternatively, a lesion of the corticospinal motor pathway located upstream of the site of magnetic stimulation may be considered, which might occur in purely cortical lesions (Zentner and Meyer, 1998). Previous observations made with conventional MEPs showed that some patients with a definite clinical impairment had normal responses to transcranial stimulation (Ho¨mberg et al., 1991). One of our patients with a near plegia of a hand due to a small infarction involving the primary motor cortex had a normal TST amplitude ratio. However, this patient was studied 16 h after a stroke, possibly before Wallerian degeneration of corticospinal axons had taken place (Ro¨sler et al., 1998). Altogether, the TST detected the CNS disorder correctly inù95% of our patients. It thus appears that the TST was able to detect most corticospinal conduction dysfunctions, whether caused by axonal or neuronal lesions, by increased excitation thresholds to transcranial stimulation, or by conduction blocks. Concerning the latter mechanism, detection may have involved not only ‘established’ conduction blocks, but probably also frequency-dependent conduction blocks (McDonald and Sears, 1970;
Boniface et al., 1991). The TST studies the final result of the multiple supraspinal descending waves on spinal motor neuron firing, a repetitive activity which can reach 700 Hz. The occurrence of frequency-dependent conduction block on this descending activity probably reduces the TST amplitude ratio in proportion to the number of spinal neurons not driven to fire by the decreased number of corticospinal impulses. Therefore, in contrast to the situation in peripheral nerves, where high-frequency stimulation is required in order to demonstrate a frequency-dependent conduction block, supraspinal frequency-dependent conduction block may supervene, and be detected by, a single transcranial stimulus, particularly so with the use of the TST.
The presence of a pyramidal syndrome was correlated with both a more severely decreased TST amplitude ratio and a more severe paresis (Fig. 5). As an additional electro-physiological measure of pyramidal syndrome, we searched for an ADM H reflex at rest in a large number of patients. Under the condition of our investigation, the H reflex had little sensitivity and specificity as a marker of the pyramidal syndrome and its presence did not predict the result of the TST. Thus, neither the absence of a pyramidal syndrome and/or of a muscle weakness nor the absence or presence of an H reflex predicted the result of the TST. This is important from a clinical standpoint, since it suggests that the presence or absence of a central motor conduction disorder cannot always be deduced from the clinical examination of a particular patient.
The TST procedure is not unduly time-consuming for the experienced investigator. The study of both sides adds,30 min to the conventional MEP study. The procedure caused no side-effect in any patient. The examination was well tolerated by the patients, who never declined repeated testing even though the successive stimuli (Erb–wrist–Erb) needed for the TST control curve were considered unpleasant. Due to this discomfort, however, the TST may not be suitable for the examination of children or patients not able to give informed consent.
With regard to the clinical use of the TST, a few particularities of the technique have to be discussed. First, co-operation of the patient is necessary during the majority of examinations (see above). Even in healthy subjects, some contraction of the target muscle is often required to obtain a normal TST amplitude ratio near 100% (Magistris et al., 1998). In all patients, several TST trials were performed using both increasing stimulator output and more efficient facilitation manoeuvres (e.g. thinking of a contraction of the target muscle, contraction of the opposite muscle, contraction of the target muscle). In this series, a slight contraction of the target ADM was used in 88% of the sides tested in order to facilitate MEP and TST responses. The TST was considered abnormal only if, after this procedure, the amplitude and area ratios did not increase. In three sides of two patients with psychogenic paresis and one patient with a non-neurological disorder, optimal facilitation was not obtained and the patients had slightly abnormal TST amplitude ratios (86% on average;
Fig. 2B). Co-operation may not always be optimal in patients with ‘organic’ muscle weakness either. Moreover, although Hess et al. (1986, 1987a) found in normal subjects that maximal facilitation of ADM occurred at a voluntary contraction of ø10% of maximal force, the amount of contraction required may possibly be greater in patients with CNS disorders (Ravnborg et al., 1991). Consequently, in some cases the TST amplitude ratio may overestimate the degree of abnormality. Standardizing the facilitation by measurement of the force or replacing the voluntary contraction by afferent signals such as vibration could be considered to optimize recordings in these situations, and could also be of use in patients unable to perform any type of facilitation, such as in unconscious patients. A second particularity of the TST is that an abnormal TST amplitude ratio does not distinguish between three possible mechanisms, namely a central conduction block, an increased excitation threshold to transcranial stimulation, and a central loss of neurons or axons (Figs 2 and 3). The reason is that the TST assesses the deficit with reference to a response evoked from the peripheral nerve, which, in the absence of a peripheral nerve lesion, remains normal after central axonal damage. Central conduction block could be inferred only by an increase in the TST amplitude ratio in subsequent examinations accompanying a rapid clinical improvement, while persistence of the reduced amplitude ratio may relate either to neuron or axon loss or, in theory, to persistent central conduction block or increased excitation thresholds. Thirdly, the TST examination does not replace conventional MEP since the latter provides the CMCT, which is not supplied by the TST (but which is required to determine the interstimulus delays in the TST). Hence, conventional MEP and TST measurements are complementary. Considering both conduction failure and conduction slowing gives deeper insight into the conduction disorder of a particular patient. While in 67 of 489 sides both conduction slowing and failure were found, 13 further sides had conduction slowing alone and 145 conduction failure alone (Figs 2 and 7 and Table 2). These results underline the importance of a technique that allows measurement of reliable MEP size parameters, since conduction failures (due either to loss of central motor neurons or to central conduction block) appear to be more common than slowing in most central motor disorders (in our patients conduction failure was 2.65 times more frequent than slowing).
In this study, conventional MEP and TST recordings were performed from the ADM muscle only. This muscle was chosen in order to minimize the potential difficulties with volume-conducted responses which may occur in recordings from other small hand muscles, in particular the thenar. It has been shown that the yield of conventional MEPs increases if a greater number of target muscles are examined (Mayr et al., 1991; Mathis et al., 1996; Maertens de Noordhout et al., 1998). Although the same may be expected for the TST (if volume conduction could be prevented), we were surprised to observe that recording of the ADM alone yielded
278 M. R. Magistris et al.
such a large number of abnormal results. As discussed previously, the TST cannot be used to study proximal muscles, since sufficient delays between stimulation sites are required to obtain a clear separation between the first and second main deflections of the TST curve. Dorsolumbar spinal disorders escaped TST assessment, so we are presently adapting the technique to the study of distal lower limb muscles.
Further studies, in particular repeated studies, are required to demonstrate the accuracy of the technique and to establish its use in follow-up trials. Our preliminary results are promising since they match the clinical course in patients in whom TST was repeated.
The precise assessment of the central conduction failure allowed by the TST should be useful in quantifying the benefits of treatments in disorders such as multiple sclerosis, ALS and spondylotic myelopathies, or cerebral plasticity in the course of rehabilitation programmes in disorders such as stroke.
Acknowledgements
We wish to thank Mrs Ursula Gruaz for technical collaboration and Dr Michael A. Morris for help in the preparation of the manuscript. This work was supported by the Swiss National Science Foundation fund (grant 31–43454.95).
References
Amassian VE, Cracco RQ, Maccabee PJ. Focal stimulation of human cerebral cortex with the magnetic coil: a comparison with electrical stimulation. Electroencephalogr Clin Neurophysiol 1989; 74: 401–16.
Andres PL, Skerry LM, Munsat TL. Measurement of strength in neuromuscular diseases. In: Munsat TL, editor. Quantification of neurologic deficit. Boston: Butterworths; 1989. p. 87–100. Beer S, Ro¨sler KM, Hess CW. Diagnostic value of paraclinical tests in multiple sclerosis: relative sensitivities and specificities for reclassification according to the Poser committee criteria. J Neurol Neurosurg Psychiatry 1995; 59: 152–9.
Berardelli A, Inghilleri M, Cruccu G, Mercuri B, Manfredi M. Electrical and magnetic transcranial stimulation in patients with corticospinal damage due to stroke or motor neurone disease. Electroencephalogr Clin Neurophysiol 1991; 81: 389–96.
Boniface SJ, Mills KR, Schubert M. Responses of single spinal motoneurons to magnetic brain stimulation in healthy subjects and patients with multiple sclerosis. Brain 1991; 114: 643–62. Brasil-Neto JP, McShane LM, Fuhr P, Hallett M, Cohen LG. Topographic mapping of the human motor cortex with magnetic stimulation: factors affecting accuracy and reproducibility. Electroencephalogr Clin Neurophysiol 1992; 85: 9–16.
Britton TC, Meyer BU, Benecke R. Variability of cortically evoked motor responses in multiple sclerosis. Electroencephalogr Clin Neurophysiol 1991; 81: 186–94.
Bucy PC, Ladpli R, Ehrlich A. Destruction of the pyramidal tract in the monkey. The effects of bilateral section of the cerebral peduncles. J Neurosurg 1966; 25: 1–23.
Claus D, Mills KR, Murray NM. The influence of vibration on the excitability of alpha motoneurones. Electroencephalogr Clin Neurophysiol 1988; 69: 431–6.
Date M, Schmid UD, Hess CW, Schmid J. Influence of peripheral nerve stimulation on the responses in small hand muscles to transcranial magnetic cortex stimulation. Electroencephalogr Clin Neurophysiol 1991; Suppl 43: 212–23.
Eisen A, Siejka S, Schulzer M, Calne D. Age-dependent decline in motor evoked potential (MEP) amplitude: with a comment on
changes in Parkinson’s disease. Electroencephalogr Clin
Neurophysiol 1991; 81: 209–15.
Ellaway PH, Davey NJ, Maskill DW, Rawlinson SR, Lewis HS, Anissimova NP. Variability in the amplitude of skeletal muscle responses to magnetic stimulation of the motor cortex in man. Electroencephalogr Clin Neurophysiol 1998; 109: 104–13. Hess CW, Mills KR, Murray NM. Magnetic stimulation of the human brain: the effects of voluntary muscle activity [abstract]. J Physiol (Lond) 1986; 378: 37P.
Hess CW, Mills KR, Murray NM. Responses in small hand muscles from magnetic stimulation of the human brain [published erratum appears in J Physiol (Lond) 1990; 430: 617]. J Physiol (Lond) 1987a; 388: 397–419.
Hess CW, Mills KR, Murray NM, Schriefer TN. Magnetic brain stimulation: central motor conduction studies in multiple sclerosis. Ann Neurol 1987b; 22: 744–52.
Ho¨mberg V, Stephan KM, Netz J. Transcranial stimulation of motor cortex in upper motor neurone syndrome: its relation to the motor deficit. Electroencephalogr Clin Neurophysiol 1991; 81: 377–88. Hugon J, Lubeau M, Tabaraud F, Chazot F, Vallat JM, Dumas M. Central motor conduction in motor neuron disease. Ann Neurol 1987; 22: 544–6.
Ioku M. Hand H-reflex demonstrated in patient with central nervous system disorders. Electromyogr Clin Neurophysiol 1984; 24: 331–9. Jane JA, Yashon D, Becker DP, Beatty R, Sugar O. The effect of destruction of the corticospinal tract in the human cerebral peduncle upon motor function and involuntary movements. Report of 11 cases. J Neurosurg 1968; 29: 581–5.
Kameyama O, Shibano K, Kawakita H, Ogawa R. Transcranial magnetic stimulation of the motor cortex in cervical spondylosis and spinal canal stenosis. Spine 1995; 20: 1004–10.
Kiers L, Cros D, Chiappa KH, Fang J. Variability of motor potentials evoked by transcranial magnetic stimulation. Electroencephalogr Clin Neurophysiol 1993; 89: 415–23.
Lawrence DG, Hopkins DA. The development of motor control in the rhesus monkey: evidence concerning the role of corticomotoneuronal connections. Brain 1976; 99: 235–54.
Lim CL, Yiannikas C. Motor evoked potentials: a new method of
controlled facilitation using quantitative surface EMG.
Maertens de Noordhout A, Remacle JM, Pepin JL, Born JD, Delwaide PJ. Magnetic stimulation of the motor cortex in cervical spondylosis. Neurology 1991; 41: 75–80.
Maertens de Noordhout A, Myressiotis S, Delvaux V, Born JD, Delwaide PJ. Motor and somatosensory evoked potentials in cervical spondylotic myelopathy. Electroencephalogr Clin Neurophysiol 1998; 108: 24–31.
Magistris MR, Ro¨sler KM, Truffert A, Myers JP. Transcranial stimulation excites virtually all motor neurons supplying the target muscle: a demonstration and a method improving the study of motor evoked potentials. Brain 1998; 121: 437–50.
Mair WG, Druckman R. The pathology of spinal cord lesions and their relation to the clinical features in protrusion of cervical intervertebral discs (a report of four cases). Brain 1953; 76: 70–91. Mariorenzi R, Zarola F, Caramia MD, Paradiso C, Rossini PM. Non-invasive evaluation of central motor tract excitability changes following peripheral nerve stimulation in healthy humans. Electroencephalogr Clin Neurophysiol 1991; 81: 90–101.
Marsden CD, Merton PA, Morton HB. Maximal twitches from stimulation of the motor cortex in man [abstract]. J Physiol (Lond) 1981; 312: 5P.
Marsden CD, Merton PA, Morton HB. Direct electrical stimulation of corticospinal pathways through the intact scalp in human subjects. Adv Neurol 1983; 39: 387–91.
Masur H, Elger CE, Render K, Fahrendorf G, Ludolph AC. Functional deficits of central sensory and motor pathways in patients with cervical spinal stenosis: a study of SEPs and EMG responses to non-invasive brain stimulation. Electroencephalogr Clin Neurophysiol 1989; 74: 450–7.
Mathis J, Hess CW. Motor-evoked potentials from multiple target muscles in multiple sclerosis and cervical myelopathy. Eur J Neurol 1996; 3: 567–73.
Mayr N, Baumgartner C, Zeitlhofer J, Deecke L. The sensitivity of transcranial cortical magnetic stimulation in detecting pyramidal tract lesions in clinically definite multiple sclerosis. Neurology 1991; 41: 566–9.
McDonald WI, Sears TA. The effects of experimental demyelination on conduction in the central nervous system. Brain 1970; 93: 583–98. Nielsen JF. Improvement of amplitude variability of motor evoked potentials in multiple sclerosis patients and in healthy subjects. Electroencephalogr Clin Neurophysiol 1996; 101: 404–11. Philipson L, Larsson PG. The electromyographic signal as a measure of muscular force: a comparison of detection and quantification techniques. Electromyogr Clin Neurophysiol 1988; 28: 141–50. Poser CM, Paty DW, Scheinberg L, McDonald I, Davis FA, Ebers GC et al. New diagnostic criteria for multiple sclerosis: guidelines for research protocols. Ann Neurol 1983; 13: 227–31.
Ravnborg M, Blinkenberg M, Dahl K. Standardization of facilitation of compound muscle action potentials evoked by magnetic
stimulation of the cortex. Results in healthy volunteers and in patients with multiple sclerosis. Electroencephalogr Clin Neurophysiol 1991; 81: 195–201.
Ro¨sler KM, Magistris MR, Weber J, Hess CW. Normal motor evoked potentials (MEPs) in a highly paretic muscle after cerebral stroke: a case observation [abstract]. Electroencephalogr Clin Neurophysiol 1998; 106: 15P.
Rossini PM, Marciani MG, Caramia M, Roma V, Zarola F. Nervous propagation along ‘central’ motor pathways in intact man: characteristics of motor responses to ‘bifocal’ and ‘unifocal’ spine and scalp non-invasive stimulation. Electroencephalogr Clin Neurophysiol 1985; 61: 272–86.
Rossini PM, Caramia M, Zarola F. Central motor tract propagation in man: studies with non-invasive, unifocal, scalp stimulation. Brain Res 1987; 415: 211–25.
Roth G, Egloff-Baer S. Ephaptic response in man. Eur Neurol 1979; 18: 261–6.
Roth G, Magistris MR. Detection of conduction block by monopolar percutaneous stimulation of the brachial plexus. Electromyogr Clin Neurophysiol 1987; 27: 45–53.
Roth G, Magistris MR. Identification of motor conduction block
despite desynchronisation. A method. Electromyogr Clin
Neurophysiol 1989; 29: 305–13.
Rothwell JC. Transcranial magnetic stimulation [editorial]. Brain 1998; 121: 397–8.
Schriefer TN, Hess CW, Mills KR, Murray NM. Central motor conduction studies in motor neurone disease using magnetic brain stimulation. Electroencephalogr Clin Neurophysiol 1989; 74: 431–7. Tavy DL, Wagner GL, Keunen RW, Wattendorff AR, Hekster RE, Franssen H. Transcranial magnetic stimulation in patients with cervical spondylotic myelopathy: clinical and radiological correlations. Muscle Nerve 1994; 17: 235–41.
Thompson PD, Day BL, Rothwell JC, Dick JP, Cowan JM, Asselman P, et al. The interpretation of electromyographic responses to electrical stimulation of the motor cortex in diseases of the upper motor neurone. J Neurol Sci 1987; 80: 91–110.
Uozumi T, Tsuji S, Murai Y. Motor potentials evoked by magnetic stimulation of the motor cortex in normal subjects and patients with motor disorders. Electroencephalogr Clin Neurophysiol 1991; 81: 251–6.
van der Kamp W, Zwinderman AH, Ferrarzi MD, van Dijk JG. Cortical excitability and response variability of transcranial magnetic stimulation. J Clin Neurophysiol 1996; 13: 164–71.
Zentner J, Meyer B. Diagnostic significance of MEP elicited by electrical and magnetoelectric stimulation in acute/subacute supratentorial lesions. Electromyogr Clin Neurophysiol 1998; 38: 33–40.
Received June 19, 1998. Revised August 11, 1998. Accepted September 10, 1998