Transcranial stimulation excites virtually all motor
neurons supplying the target muscle
A demonstration and a method improving the study of motor
evoked potentials
M. R. Magistris,
1K. M. Ro¨sler,
2A. Truffert
1and J. P. Myers
11Department of Clinical Neurology, Geneva University Correspondence to: Dr Michel R. Magistris, Unite´ Hospital and2Department of Clinical Neurology, Berne d’Electroneuromyographie, Clinique de Neurologie, University Hospital, Switzerland Hoˆpitaux Universitaires de Gene`ve, CH-1211 Geneva 14,
Switzerland
Summary
Transcranial stimulation has become an established method in the evaluation of corticospinal tract function. Clinical studies mainly address slowing of conduction through measurement of increased central conduction time (CCT) and ‘failures’ of conduction through observation of marked reductions in the size of the motor evoked potential (MEP). While CCT is of great interest in detecting subclinical slowing of conduction, the method discloses only gross failures of conduction, since the size of the MEP varies markedly between normal subjects and from one stimulus to another, leading to a broad range of normal values. Furthermore, transcranial stimulation does not appear to achieve depolarization of all spinal motor neurons leading to the target muscles, since in most normal subjects MEPs are smaller in amplitude than the responses evoked by peripheral nerve stimulation. We have developed a triple
Keywords: transcranial cortical stimulation; corticospinal tract; collision technique; magnetic and electrical stimulation; quantification of central motor-conduction defects
Abbreviations: ADM5 abductor digiti minimi; CCT 5 central conduction time; CMAP 5 compound muscle action potential (evoked by peripheral stimulation); CMAPErb5 CMAP evoked by Erb’s point stimulation; CMAPwrist 5 CMAP evoked by wrist stimulation; MEP 5 motor evoked potential (evoked by cortical stimulation); MUP 5 motor unit potential; TST 5 triple stimulation technique
Introduction
During the past 17 years electrophysiological testing of the corticospinal tract has used electrical (Merton and Morton, 1980) and, more recently, magnetic (Barker et al., 1985) transcranial percutaneous stimulation, yielding ‘motor evoked potentials’ (MEPs). The method is utilized for both basic research and clinical purposes. The most important parameters of the MEPs measured in clinical practice are: response © Oxford University Press 1998
stimulation technique (TST) which, through two collisions, links central to peripheral conduction and suppresses desynchronization of MEPs. This technique shows that transcranial stimulation does achieve depolarization of all, or nearly all, spinal motor neurons supplying the target muscle in healthy subjects. Our data thus demonstrate that the amplitudes of MEPs are (i) smaller than those of peripheral responses, mostly due to phase cancellation of the action potentials caused by the desynchronization occurring within the corticospinal tract or at spinal cell level and (ii) variable between normal subjects and from one stimulus to another, mostly due to variability of this desynchronization. This technique provides new insights into normal corticospinal tract conduction. It will improve detection and quantification of central motor conduction failures.
threshold, minimal latency, central conduction time (CCT) and response size (amplitude, duration and area). While CCT is of great interest in disclosing subclinical slowing of conduction, it is not directly related to the motor deficit experienced by the patient. The method has limited value in the detection and quantification of ‘failures’ of motor conduction within the corticospinal tract, whether due to
conduction block, axonal lesion or motor neuron death. This is due to the characteristics of MEPs, which differ in several ways from responses evoked by peripheral nerve stimulation. Peripheral nerve stimuli, when maximal, excite all motor axons and evoke compound muscle action potentials (CMAPs) with latencies and sizes that do not vary if stimulation is repeated. On the other hand, transcranial stimuli evoke responses which vary in latency and size from one stimulus to another (Hess et al., 1987a). If the target muscle is voluntarily contracted, a facilitation ensues; the latency of the response decreases and its size increases (Hess et al., 1986). Even with such facilitation, electrical or magnetic MEPs are markedly smaller in amplitude than those evoked by peripheral stimuli, whatever the intensity of the transcranial stimulus. For instance, the amplitude ratio for the abductor digiti minimi (ADM) when comparing MEPs with CMAPs evoked by wrist stimulation (MEP : CMAPwrist) may be as small as 18% in normal subjects (Hess et al., 1987b) so that, at present, the ADM MEP is considered abnormal only when this amplitude ratio is ,15%, or if there is a marked asymmetry between sides in case of unilateral disorders (Hess et al., 1987b). The broad range of amplitudes of MEPs in normal subjects does not allow an accurate evaluation of corticospinal conduction failures in patients.
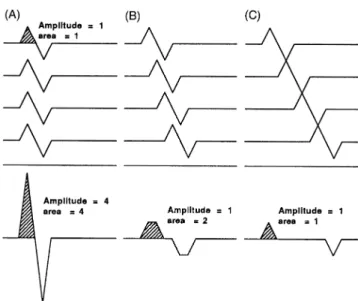
The smaller amplitude of the MEP compared with the potential evoked by peripheral stimulation may have two explanations: (i) transcranial stimulation may not excite all spinal neurons innervating the recorded muscle or (ii) desynchronization of the descending volley may occur and lead to a decrease in amplitude and area due to ‘phase cancellation’ phenomena in which the negative phases of individual motor unit potentials (MUPs) are cancelled by the positive phases of others (see Fig. 1). This second hypothesis is indirectly supported by the observation that the muscle twitch force resulting from transcranial stimulation may equal or exceed that resulting from peripheral nerve stimulation (Marsden et al., 1981; Day et al., 1987; Hess et al., 1987a). However, this question remains unsettled since single transcranial stimuli may give rise to multiple action potential volleys in a number of axons (Patton and Amassian, 1954; Boyd et al., 1986; Berardelli et al., 1991). Therefore, twitch force equalling or exceeding that following peripheral stimulation, could be caused by repeated contractions of some motor units (Marsden et al., 1981; Day et al., 1987). Indeed, the area of the MEP is more variable than its amplitude; it is usually smaller, but may be larger than that of the peripheral CMAP. The duration of the MEP, usually longer than that of the CMAP, may be related both to desynchronization of the individual MUPs and to the multiple volleys.
The aim of this work is to investigate the role of desynchronization of the descending action potentials evoked by transcranial stimulation, and to develop a technique enabling precise detection and quantification of failure of corticospinal tract conduction in patients. For this purpose, we have adapted the triple stimulation technique (TST),
Fig. 1 Principle of phase cancellation. In this schematic diagram,
four identical biphasic MUPs (above) add to give rise to a CMAP (below). (A) The four MUPs are synchronized and the negative and positive phases add; (B) slight desynchronization (identical for each of the MUPs) and two negative phases cancel with positive phases; (C) more desynchronization (identical for each of the MUPs) and three negative phases cancel with positive phases.
which we had developed previously to measure conduction block in peripheral nerves despite desynchronization (Roth and Magistris, 1989). This article describes this new approach, and gives the results obtained in normal subjects, using both electrical and magnetic transcranial stimuli. Preliminary results obtained with electrical brain stimulation have been presented previously (Magistris and Myers, 1990; Myers, 1994).
Subjects
Twenty-two normal subjects and 12 patients, who gave their written informed consent, participated in the study which was approved by the local Ethics Committees of the Geneva and Berne University Hospitals.
Triple stimulation technique study
The normal subjects in this study were 15 males and seven females aged 24–53 years (average age 38 years), and included the authors. All 22 subjects were tested by magnetic TST. Six of them had been tested previously with electrical TST (Magistris and Myers, 1990; Myers, 1994).
Single motor unit potential substudy
Twelve patients, presenting with a variety of peripheral nerve disorders, but without evidence of any central dysfunction, were enrolled in a substudy to complete the demonstration of the TST. The patients were 11 males and one female aged 19–72 years (average 55 years). They were affected by: traumatic brachial plexus (three patients), diabetes mellitus
plexopathy (one patient), diabetes mellitus polyneuropathy (one patient), benign monomelic amyotrophy affecting an arm (three patients), cervical multiple radiculopathy (two patients), multifocal motor neuropathy (one patient) and a motor axonal form of Guillain–Barre´ syndrome (one patient). These patients were chosen for the severity of their peripheral nerve lesion; they had only one or two remaining MUPs per concentric needle recording site, a situation which allowed recordings of single MUPs in response to transcranial stimuli.
Methods
Peripheral conduction and ‘conventional’ MEPs
The experiments were carried out using either a DISA 1500 EMG System (Disa Elektronik, Skowlunde, Denmark), or a Viking II or IV (Nicolet, Madison, Wis., USA). Bandpass filtering was between 2 Hz and 10 KHz. Recordings were taken from the ADM using the muscle-belly tendon technique with surface electrodes (diameter 0.8 cm). The ADM was preferred since volume conduction from the other muscles that are also depolarized by stimuli over the scalp and at Erb’s point is limited. A ground electrode was taped to the dorsum of the hand. The subject lay supine with the hand held in place by a 2.5-kg sand bag; fingers II to V were taped together. Each experiment started with measurement of the CMAPs evoked by maximal stimulation of the ulnar nerve at the wrist (CMAPwrist) and at Erb’s point (CMAPErb), both at rest and during a slight voluntary contraction of the ADM. Stimulating electrodes were securely taped at both stimulation sites. At the wrist, stimuli were applied via two silver electrodes (diameter 0.8 cm), the cathode being taped over the ulnar nerve proximal to the pisiform bone and the anode posteriorly on the wrist at the same level, in order to avoid anodal stimulation. At Erb’s point, monopolar stimulation was used, as described previously (Roth and Magistris, 1987), with a small cathode electrode taped over Erb’s point (diameter 1 cm) and a large remote anode electrode (surface 30 cm2) taped over the internal region of the suprascapular fossa. Bipolar stimulation of the median nerve was also performed, at the wrist or elbow, or both, to measure the influence of volume conduction from the muscles innervated by the median nerve, and to detect unusual innervation of hand muscles. The CMAP parameters measured were: latency (to negative take-off from baseline), amplitude, area and duration of the negative wave. The minimal ulnar F-wave latency was measured following wrist stimuli, using ù16 recordings. MEPs were obtained using either electrical or magnetic transcranial stimuli.Electrical transcranial stimuli were applied with a Digitimer D180 (Digitimer, Welwyn Garden City, UK) using a monopolar montage. A surface anodal electrode (diameter 1 cm) was placed over the motor area, 6–9 cm lateral from the vertex (depending on the size of the head) in the direction of the meatus acousticus. A remote cathode (surface 20 cm2) was placed over the vertex. The electrodes were held in place
with a hat of the type used to perform electroencephalography. The intensity of electrical stimulation was expressed as a percentage of maximal output (750 V) with a stimulus duration of 100 µs. Electrical brain stimuli were applied while the subject was contracting the ADM on the opposite side of the target ADM maximally. The electrical MEP latency was defined as the shortest latency from three or more responses.
Magnetic transcranial stimuli were applied with a Magstim 200 (Magstim Company, Spring Gardens, Whitland, Dyfed, UK) with a circular 90-mm hand-held coil. The centre of the coil was at the vertex or slightly lateral toward the stimulated hemisphere. Face ‘A’ (face visible) was used for left hemisphere stimulation and face ‘B’ for right hemisphere stimulation. Slight displacements were made in all directions until the position yielding the lowest threshold was found. The coil was then kept in the same position throughout the examination. The intensity of the magnetic pulse was expressed as a percentage of the maximal output of 2.0 Tesla. Magnetic stimuli were usually applied while the subject was slightly contracting the ipsilateral target ADM. The magnetic MEP latency was defined as the shortest latency from eight responses.
For both electrical and magnetic transcranial stimulation, CCTs were calculated using the formula from Rossini et al. (1985): CCT 5 latency of MEP – (F-wave latency 1 CMAPwristlatency – 1)/2. The MEPs (evoked by cortical stimulation) were compared with the peripherally evoked CMAPErb and CMAPwrist, in terms of amplitude and area ratios.
Triple stimulation technique (TST)
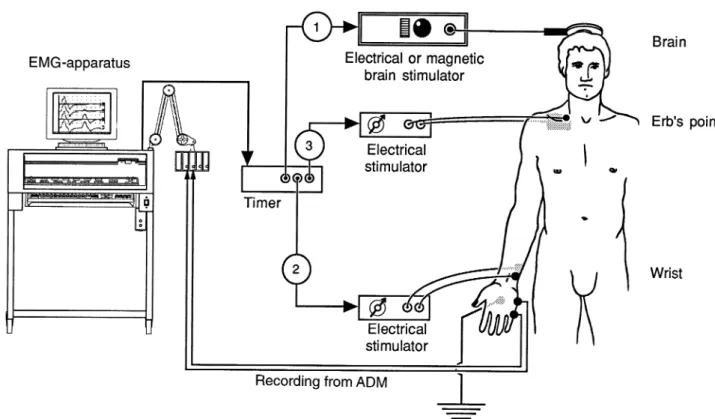
The technique was described previously for peripheral nerves (Roth and Magistris, 1989). As additional equipment, an external electrical stimulator (Digitimer DS7 or DISA 15E O5–6) and an external timer (DISA delay unit 15 E 26 or Digitimer D4030) were used (Fig. 2). Three stimuli were given leading to two collisions: the first stimulus was applied to the scalp overlying the motor cortex. After a delay (delay I, equal to the minimal latency of the MEP, rounded down to the nearest millisecond, minus the latency of the potential evoked at the wrist, rounded up to the nearest millisecond), a second stimulus (maximal) was applied over the ulnar nerve at the wrist. The action potentials descending from the cortex collide with the antidromic action potentials evoked at the wrist. The collisions occur at the wrist and up the arm (depending on the conduction velocities of the individual action potentials within the CNS and PNS, and the height of the subject). After another delay, a third stimulus was applied at Erb’s point (delay II, equal to the latency of the CMAPErb rounded down to the nearest millisecond, minus the latency of the CMAPwristrounded up to the nearest millisecond). It was the response to this third stimulus which was studied. Understanding this response is made easier if the following two extreme situations are considered.
Fig. 2 Experimental set-up for the TST. Transcranial electrical or magnetic stimulator and two electrical stimulators are triggered at
appropriate intervals by a timer. The sequence for the TST test curve is: transcranial stimulation–electrical ulnar nerve stimulation at wrist–electrical stimulation at Erb’s point. The sequence for the TST control curve used for comparison is: electrical stimulation at Erb’s point–electrical ulnar nerve stimulation at wrist–electrical stimulation at Erb’s point. Electrical peripheral stimuli are maximal. Monopolar stimulation of the brachial plexus uses a small cathode at Erb’s point and a large anode over the upper aspect of the scapula. Recordings from the ADM are via surface electrodes.
The first situation assumes cortical stimulation which does not excite any motor axon (e.g. a transcranial stimulation intensity of zero). No collision occurs with the maximal stimulation applied to the wrist. The antidromic volley evoked at the wrist, that involves all ulnar nerve axons, ascends towards Erb’s point. The third stimulus (maximal stimulation applied to Erb’s point) provokes a collision at Erb’s point and within the arm so that no motor response is evoked by the third stimulus. In short, if there is no excitation of the corticospinal neurons, no motor response follows the third stimulus applied to Erb’s point.
The second extreme situation assumes a cortical stimulus that excites all the spinal motor axons innervating the target muscle (maximal stimulation). All descending action potentials collide with those evoked at the wrist. No antidromic volley from wrist stimulation ascends towards Erb’s point, so that the third stimulus applied to Erb’s point evokes a maximal CMAP. In short, if a cortical stimulus succeeds in exciting all spinal motor axons innervating the target muscle, the response to the third stimulus applied to Erb’s point is maximal, i.e. it also succeeds in exciting all motor axons innervating the target muscle.
If, as in Fig. 3A, a transcranial stimulus excites three spinal axons out of four, a collision occurs in the three axons. The surviving component of the antidromic volley evoked at the wrist concerns only one axon out of four: the one which was
not excited by transcranial stimulation. The third stimulus applied to Erb’s point evokes a response which is reduced in area by the collision that occurs with the surviving ascending activity (here in one axon). Thus, the final motor response is that driven by the three axons which were initially excited by transcranial stimulation. If the individual action potentials evoked by transcranial stimulation are desynchronized, as in Fig. 3, the sites of collision on the axons are dispersed within the forearm and possibly the arm, but the response to the third stimulus (applied to Erb’s point) is now synchronized. As a result, the response of the peripheral axons which were initially depolarized by transcranial stimulation is now synchronized. Thus the phase-cancellation which can arise with desynchronization of the MEP is avoided.
Eventually the TST links transcranial to peripheral stimuli and, while doing so, suppresses the desynchronization. As a consequence, any reduction of the area of the negative peak evoked by the third stimulus would demonstrate that transcranial stimulation had not excited all the spinal neurons innervating the recorded muscle. On the other hand, an absence of such a reduction would demonstrate that transcranial stimulation had achieved excitation of all spinal neurons innervating the target muscle.
Pilot experiments showed that the response to the third stimulus applied to Erb’s point (TST test curve in Fig. 3A)
Fig. 3 The TST principle. On the left, a schematic diagram of the motor tract is simplified to four corticospinal axons with monosynaptic
connections to four peripheral axons (a simplification which does not account for the complexity of corticospinal connections); horizontal lines represent the muscle fibres of the four motor units. Recordings are shown on the right: (A) TST test, (B) TST control, (C) response to a single stimulus at wrist and (D) superimposition of recordings A, B and C. In this example a submaximal transcranial stimulus excites 75% of the axons (three axons out of four). Desynchronization of the three action potentials is assumed to occur within the corticospinal tract (or possibly at the spinal cell level). (A, 1) Transcranial stimulation excites three out of four axons. (A, 2) After a delay, a maximal stimulus applied to the wrist evokes the first negative (upward) deflection in the TST test trace; this response is followed by that of the multiple-discharge volleys (not figured on the left scheme). (A, 3) After a delay, a maximal stimulus is applied to Erb’s point; (A, 4) a synchronized response from the three axons excited initially by the transcranial stimulus is recorded as the second large deflection of TST test trace. (B, 1) A maximal stimulus is applied to Erb’s point; (B, 2) after a delay, a maximal stimulus applied to the wrist evokes the first deflection of TST control trace; (B, 3) after a delay, a maximal stimulus is applied to Erb’s point; (B, 4) a synchronized response from the four axons is recorded as the second deflection of TST control trace. (C) The response evoked by stimulating the wrist serves as a baseline for measurement of the amplitude and area of the second deflection of the TST curves. (D) On the superimposed traces, the smaller size of the second deflection of the TST test trace, compared with that of the TST control trace, demonstrates that not all spinal axons of the target muscle were excited by transcranial stimulation (in this example both amplitude and area ratios should be 75% if the four individual MUPs have identical sizes). Calibrations: 2 mV and 5 ms.
had to be compared with a control curve (TST control curve in Fig. 3B) evoked by three maximal stimuli applied successively to Erb’s point, the wrist, and Erb’s point, with
appropriate delays (delay I and II equal to the latency of the CMAPErb, minus the latency of the CMAPwrist. Indeed, the amplitude and negative peak area of the response to the third
stimulus is often reduced compared with the CMAP evoked by a single stimulus applied to Erb’s point. This reduction is highly variable among subjects. It could result from the lack of response of muscle fibres with a refractory period longer than the delay between the second and third stimuli when the interval between these stimuli is short. This phenomenon is probably not relevant in this study since the interval between the second (wrist) and third stimuli (Erb’s point) is long (usuallyù9 ms). A more important phenomenon is that of a ‘back-response’ that can occur in axons ephaptically excited by the CMAP evoked by the second (wrist) stimulus (Roth and Magistris, 1989). Such muscle-to-nerve ephaptic transmission accompanying highly synchronized CMAPs is often observed in normal subjects (Roth and Egloff-Baer, 1979). When present, the back-response follows the antidromic volley evoked by wrist stimulation and cancels part of the third response. As this phenomenon occurs in the same manner in the TST test curve and in the TST control curve, comparison of these two curves suppresses its effect. An important prerequisite for the comparison of the test and control curves is that the target muscle must be kept in the same position throughout the examination. This is assumed to be so when the two CMAPs evoked by wrist stimulation (i.e. the first negative deflection of the TST test and TST control curves) have identical shapes (see fig. 2 in Roth and Magistris, 1989).
In all subjects, several TST curves were recorded using increasing intensity of transcranial stimulation until the best possible superimposition of the TST test and control curves was obtained. Various facilitation manoeuvres were tested, namely: (i) contraction of the contralateral ADM; (ii) thinking about a contraction of the target ADM; and (iii) slight contraction of the target ADM (see example in Fig. 4). These manoeuvres were also performed in combination. The EMG activity from the loudspeaker was used to monitor the background contraction or relaxation. Comparison of the test and control curves was done by calculating the amplitude and area ratios as percentages. A perfect superimposition of the curves would be 100% for both amplitude and area ratios. In order to limit the number of unpleasant stimuli when electrical transcranial stimulation was used, no further trial was performed when superimposition of the TST test and control curves reached ù95% for either the amplitude or area ratios.
Measurement precision
Measurement of amplitudes and areas were carried out on the screen of the Viking apparatus, by placing the appropriate cursors for amplitude and potential duration. Precise positioning of the cursors was sometimes difficult because it was based on visual assessment. The influence on the measure of the smallest possible movement of the cursors was calculated for all the TST recordings (n5 39). In addition, we determined the inter-examiner measurement accuracy. Three examiners (A.T., K.M.R. and M.R.M.) measured the
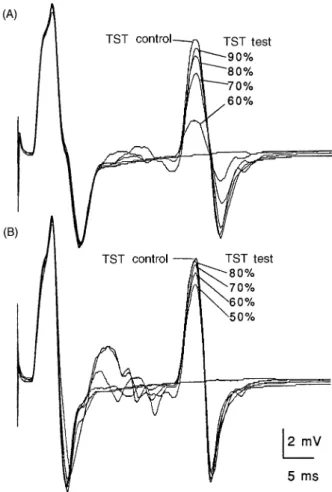
Fig. 4 Recordings using the TST. Responses from the ADM
using different stimulus intensities and facilitation manoeuvres (Subject 15). The sweep is delayed so that each trace begins with the wrist stimulus artefact. Facilitation manoeuvres are
(A) maximal contraction of the contralateral ADM, (B) slight contraction of the ipsilateral ADM. TST test curves are
superimposed upon the TST control curves. Responses evoked by different intensities of transcranial stimuli are indicated as percentages of maximal output of the Magstim 200 stimulator. Note that, in B, responses are slightly sharper and multiple volleys more abundant because of the muscle contraction. With higher stimulus intensities the multiple volleys tend to interfere with the second deflection of the TST curves in both A and B.
amplitudes and areas of the 39 TST potentials independently. To assess the inter-examiner differences, the 95% limits of agreement were calculated (Altman, 1991).
Variability
In four subjects (six sides), the variability of amplitude and area ratios, using repeated single ‘conventional’ MEPs (MEP : CMAPErb) and repeated TST curves (test : control), were measured as percentages and compared using the standard deviation. A number of single MEPs (on average, 8.7) and of TST curves (on average, 7.7) were recorded using the transcranial stimulation intensity which yielded the best superimposition of the test and control TST curves in the subject studied (Table 1). Variability in responses to electrical transcranial stimulation was studied on one side of
Table 1 Conventional motor evoked potentials and TST results using electrical and magnetic transcranial stimulation in 22 normal
subjects
No. Sex Age in Stim. Left: conventional MEPs Left: TST Right: conventional MEPs Right: TST years
CMAPErb MEP : CMAPErb Stim. Facil. Test : Control CMAPErb MEP : CMAPErb Stim. Facil. Test : Control
Ampl. Area Ampl. Area (%) Ampl. Area Ampl. Area Ampl. Area (%) Ampl. Area
mV mV.ms (%) (%) (%) (%) mV mV.ms (%) (%) (%) (%)
1 F 29 Mag. 5.7 14.8 50 93 90 iVA 100 95 10.6 40.0 75 115 85 i1cVA 100 98
2 F 30 Mag. 11.0 36.1 81 130 80 cVA1th 99 101 10.3 35.6 65 98 80 cVA1th 96 96 3 F 32 Mag. 6.0 23.7 78 84 100 iVA 97 100 n.d. n.d. n.d. n.d. n.d. n.d. n.d. n.d.
4 F 34 Mag. 13.1 43.3 66 90 70 iVA 96 100 10.8 40.4 79 107 90 iVA 94 99
5 F 35 Mag. 10.8 28.6 60 119 n.p. n.p. n.p. n.p. 11.2 27.5 47 101 60 iVA 101 99 6 F 43 Mag. n.d. n.d. n.d. n.d. n.d. n.d. n.d. n.d. 7.4 23.6 70 116 70 iVA 100 99 7 F 49 Mag. 7.7 32.8 32 38 100 i1cVA 100 95 n.d. n.d. n.d. n.d. n.d. n.d. n.d. n.d.
8 M 24 Mag. 9.9 34.1 52 88 80 i1cVA 97 102 9.3 26.0 72 114 90 i1cVA 102 95
9 M 25 Mag. 9.6 32.1 44 66 85 iVA 97 100 9.7 29.8 49 71 100 i1cVA 98 99
10 M 32 Mag. 5.3 15.2 57 91 90 i1cVA 100 102 8.8 25.8 67 105 80 iVA 98 100
11 M 35 Mag. 6.2 20.4 66 73 90 iVA 101 99 n.d. n.d. n.d. n.d. n.d. n.d. n.d. n.d. 12 M 36 Mag. 9.6 40.6 86 103 75 cVA1th 99 102 10.6 43.6 74 97 75 cVA1th 97 96 13 M 37 Mag. 7.9 26.9 74 91 75 cVA1th 99 102 5.5 19.7 59 111 70 i1cVA 102 98
14 M 38 Mag. 7.5 34.6 87 95 60 cVA1th 102 100 9.8 35.7 78 92 85 cVA 101 94
15 M 42 Mag. 7.6 26.2 63 79 85 cVA 95 97 7.4 24.6 69 96 90 cVA1th 100 98
16 M 43 Mag. 9.9 43.5 88 114 70 iVA 100 101 9.3 34.1 67 79 80 iVA 103 95
17 M 40 Mag. 7.6 28.1 77 101 80 cVA 100 100 8.7 27.5 67 92 60 i1cVA 102 100
Elec. n.d. n.d. n.d. n.d. n.d. n.d. n.d. n.d. 61 60 70 cVA 86 97
18 M 42 Mag. 7.6 26.2 66 112 70 cVA 98 98 9.7 38.2 67 119 70 cVA 100 97
Elec. n.d. n.d. n.d. n.d. n.d. n.d. n.d. n.d. 40 84 90 cVA 100 95
19 M 49 Mag. 6.1 11.3 38 84 90 iVA 100 94 8.3 22.4 66 91 60 i1cVA 99 100
Elec. n.d. n.d. n.d. n.d. n.d. n.d. n.d. n.d. 64 94 100 cVA 96 96
20 M 51 Mag. 8.9 22.3 76 105 70 cVA1th 100 96 8.1 26.3 81 120 80 cVA1th 100 98
Elec. n.d. n.d. n.d. n.d. n.d. n.d. n.d. n.d. 64 73 60 cVA 98 96
21 M 51 Mag. 11.8 35.7 59 76 100 i1cVA 100 99 7.0 19.2 73 115 100 i1cVA 96 103
Elec. n.d. n.d. n.d. n.d. n.d. n.d. n.d. n.d. 41 79 80 cVA 104 98
22 M 53 Mag. 6.9 19.6 61 111 80 cVA1th 100 95 11.0 32.1 60 90 70 cVA1th 96 101
Elec. n.d. n.d. n.d. n.d. n.d. n.d. n.d. n.d. 38 69 90 cVA 95 93
Summary of data for subjects in TST study
Magnetic TST, left: n5 20 Magnetic TST, right: n5 19
Mean 8.4 28.4 64.8 92.5 82.0 99.0 98.9 9.1 30.1 67.6 101.5 78.7 99.2 98.2
SD 2.15 9.16 15.85 20.40 11.29 1.78 2.67 1.55 7.29 9.05 13.81 12.34 2.51 2.27
Magnetic TST, left1 right: n 5 39 Electrical TST, done on right side only: n5 6
Mean 8.8 29.2 66.1 96.8 80.4 99.1 98.5 51.3 76.5 81.7 96.5 95.8
SD 1.90 8.27 12.99 17.95 11.78 2.14 2.48 12.86 11.91 14.72 6.06 1.72
Ampl.5 amplitude; Facil. 5 optimal facilitation (VA 5 voluntary activity, c 5 contralateral, i 5 ipsilateral, th 5 think about ipsilateral contraction); n.p.5 measure not possible; n.d. 5 not done; No. 5 subject number; Stim. 5 stimulation; Mag. 5 magnetic; Elec. 5 electrical.
one subject (Subject 18); variability in responses to magnetic transcranial stimulation was studied in five sides of four subjects (Subjects 2, 16, 17 and 18 on both sides).
Single motor unit potential substudy
Single MUPs evoked by transcranial stimuli were studied using standard disposable concentric needle recordings. Recordings were made from different muscles: ADM (n5 6), first dorsal interosseous (n5 1), abductor pollicis brevis, biceps brachialis (n5 2), brachioradialis (n 5 1), deltoideus (n 5 1) and triceps brachialis (n 5 3). In each of the 12 patients, voluntary activity, electrical peripheral nerve stimulation, and electrical or magnetic transcranial stimuli allowed recording of the same MUPs. During voluntary activity, firing frequency of the motor unit was ù25 Hz. Facilitation manoeuvres were the same as those used for the TST study. Interest was focused on the variation of latency
of the MUP and on the frequency of single or multiple responses of the recorded MUP to transcranial stimuli. In one patient, the variation of the latency in relation to the intensity of magnetic stimulation was studied thoroughly. In an other patient variation of latency of the same MUP to both electrical and magnetic transcranial stimuli was studied. Latency variation (the corticospinal tract ‘jitter’) was expressed in terms of standard deviations.
Results
Peripheral conduction and conventional MEPs
Electrical transcranial stimulation
For the six (right) sides tested, the average latency of MEPs was 19.6 ms (range 18.3–21.6 ms, SD 1.20 ms); the average CCT was 5.6 ms (range 4.7–7.5 ms, SD 1.03 ms). The amplitude and area ratios for the ‘conventional’ MEPs evoked
by electrical transcranial stimulation (MEP : CMAPErb) are listed in Table 1.
Magnetic transcranial stimulation
For the 40 (right and left) sides tested, the average latency of MEPs was 20.8 ms (range 16.0–22.8 ms, SD 1.49 ms); the average CCT was 5.8 ms (range 4.1–7.7 ms, SD 0.88 ms). The amplitude and area ratios for the ‘conventional’ MEPs evoked by magnetic transcranial stimulation (MEP : CMAPErb) are also listed in Table 1.
Triple stimulation technique
The TST evoked a response which consisted of two negative deflections (Fig. 3). The first stimulus (transcranial stimulation in the TST test curve, and Erb’s point stimulation in the TST control curve) evoked no motor response due to collision with the volley evoked by the maximal stimulus applied distally (at the wrist). The first deflection of the TST test or control curve was therefore that evoked by the second (wrist) stimulus. The second deflection was that evoked by the third stimulus (Erb’s point stimulus). The target muscle was thus subjected to two bursts of synchronized action potentials with an interval of ù9 ms (depending on the subject’s height and peripheral nerve conduction velocity). TST curves (test or control) were not influenced by the evoked muscle contraction, since the overall duration of the TST wasø30 ms, while the contraction of the target muscle started only after ~50 ms, due to the electromechanical coupling delay.
A smaller negative deflection was often visible between the two major negative deflections in the TST test curve (Figs 3 and 4). This response corresponds to the multiple volleys that follow transcranial stimulation, i.e. subsequent action potentials following the first depolarization on the same nerve fibres, which escape collision (Day et al., 1987; Hess et al., 1987a; Mills et al., 1987; Berardelli et al., 1991). Such multiple descending volleys are known to occur after both electrical and magnetic transcranial brain stimuli. This response occurred soon after the first deflection of the TST. Its positive repolarization phase interfered with the second deflection in some recordings and thus was a factor of imprecision in the measurement of the TST curve amplitude and area.
Electrical transcranial stimulation (Table 1)
The TST using electrical transcranial stimulation allowed a superimposition of the TST test and control curves which approached 96% in all six subjects tested (six sides). The highest degree of superimposition was chosen from an average of 3.5 TST trials per subject. The average ratios (test : control) of the highest degree of superimposition observed in the six pairs of TST curves were 96.5% (SD 6.06%) for the amplitudes and 95.8% (SD 1.72%) for the areas
(see Table 1). Thus, almost all spinal neurons innervating the target muscle could be depolarized by transcranial electrical stimulation (Magistris and Myers, 1990; Myers, 1994). The difference of ~4% from a perfect (100%) superimposition was probably related either to the method (no further electrical transcranial stimulation trials were performed when superimposition was 95% or over) or to the lack of response of a few motor units. One amplitude ratio over 100% (Subject 21) was probably related to a small change in shape of the potential obtained with the test curve compared with that of the control curve, since the amplitude ratio was 98% for the same trial. Intensity of stimulation required to obtain the maximal superimposition ranged from 60 to 100% of the Digitimer stimulator output (average 81.7%). Maximal contraction of the contralateral ADM was a sufficient facilitation manoeuvre in all cases.
Magnetic transcranial stimulation (Table 1)
The TST study using magnetic transcranial stimulation yielded results similar to those obtained with electrical stimulation. The highest degree of superimposition was chosen from an average of 5.2 TST trials per subject. Measurement of the ratios of amplitude and area was not possible in one side (Subject 5) out of the 40 sides studied in the 22 subjects, due to interference of the multiple volleys response with the second deflection of the TST. Thus, the following results are from 39 sides. The average of the highest degree of superimposition of the TST test and control curves approached 99% on both sides. The average ratios of the TST curves (test : control) were 99.0% (SD 1.78%) on the left and 99.2% (SD 2.51%) on the right sides for the amplitudes, and 98.9% (SD 2.67%) on the left and 98.2% (SD 2.27%) on the right sides for the areas (see Table 1). Intensity of stimulation required to obtain the maximal superimposition ranged from 60% to 100% output of the Magstim stimulator on both sides (average 82.0% on left sides, and 78.7% on right sides).
Facilitation, in the form of a slight background contraction of the target muscle, was required in 23 of 39 sides to achieve maximal superimposition (Table 1). In a technique involving collisions, a contraction of the target muscle may be a factor of error. In practice, it appeared to have little influence. A 10% contraction of the target muscle implies that, at the most, 20% of the total number of motor units were firing with a frequency of, at the most, 10 Hz. If the voluntary activity concerns 20 motor units, on average one action potential fires every 5 ms. Only the action potentials interposed between the potentials evoked by transcranial and distal stimulation may modify the response to the third stimulus. This interval was ~5 ms (half the MEP duration) so, on average only one action potential may have interfered. In this case, the response to the third stimulus would have been falsely increased by the response of one MUP, only if the axon driving this particular motor unit had not been depolarized by transcranial stimulation. This effect was
Table 2 Assessment of measurement* precision: comparing three examiners
Examiner 1 Examiner 2 Examiner 3 Examiner 1 Examiner 1 Examiner 2 Smallest
versus versus versus cursor
Examiner 2 Examiner 3 Examiner 3 displacement‡ Amplitude ratio6 SD (%) 99.06 2.0 99.26 3.7 99.46 2.0 Mean differences6 SD (%) 0.26 3.0 0.56 1.7 0.36 3.1 1.26 1.1 95% limits of agreement (%)† 66.00 63.31 66.15 62.16 Area ratio6 SD (%) 98.76 2.6 99.36 5.6 98.96 4.0 Mean differences6 SD (%) 0.66 4.8 0.26 2.8 0.46 4.7 1.76 1.5 95% limits of agreement (%) 69.54 65.50 69.32 62.99
*Measurements of TST curve ratios (test : control).†95% limits of agreement were calculated according to Altman, 1991.‡Measurement
inaccuracies due to the smallest possible cursor displacement on the Viking apparatus are given for comparison.
probably not significant. Comparison of the test and control TST curves from the 23 sides which required an ipsilateral voluntary contraction (mean amplitude ratio 99.2%, mean area ratio 99.0%) with those from the 16 sides which did not require an ipsilateral voluntary contraction (mean amplitude ratio 98.9%, mean area ratio 98.1%) showed that differences were ,1% for both amplitude and area ratios, confirming that this factor played no significant role.
Measurement precision (Table 2)
On average, displacement of the cursor by the smallest possible amount caused a change in the amplitude and area ratios of 1.2% and 1.7%, respectively (absolute values 0.10 mV and 0.46 mV.ms, respectively). The mean amplitude and area measures were virtually identical between the three examiners (the mean differences being close to zero; P. 0.5 in repeated measures ANOVA), thus demonstrating the absence of a measuring bias (e.g. by biased cursor setting). The inter-examiner 95% limits of agreement were between 3 and 6% for amplitude measurements and between 5 and 10% for area determinations (Table 2). It is expected that in 95% of the measurements, the values obtained by two examiners differ by less than the 95% limits of agreement (Altman, 1991). The main reason for discrepancies between the examiners were equivocal baselines due to multiple volleys. On the whole, precision was slightly better for amplitude than for area measurements.
Variability (Table 3)
Variability of the amplitude and area ratios (test : control) of repeated TST curves showed that a number of motor units did not respond to every transcranial stimulus. This variability was small, demonstrating that the number of non-responding motor units was small (Table 3); on average, the SDs for the five sides studied by magnetic transcranial stimulation, were 2.58% for the amplitude and 4.34% for the area and those for the one side studied by electrical transcranial stimulation were 4.80% for the amplitude and 4.50% for the area.
In contrast, variability of the amplitude and area ratios
of repeated single ‘conventional’ MEPs (MEP : Erb’s point) was more important; on average, the SDs for the five sides studied by magnetic transcranial stimulation were 8.1% for the amplitude and 14.1% for the area, and those for the one side studied by electrical transcranial stimulation were 10.7% for the amplitude and 16.0% for the area. The variability of the amplitude ratio was probably also related to non-responding motor units, but the fact that this variability was larger than that of the TST demonstrated that desynchronization and its related phase cancellation varied from one stimulus to another. Variability of the area ratios was probably related to non-responding motor units, to variation of the desynchronization and to a variable number of motor units responding more than once, so that it will not be considered further here.
Single MUP substudy
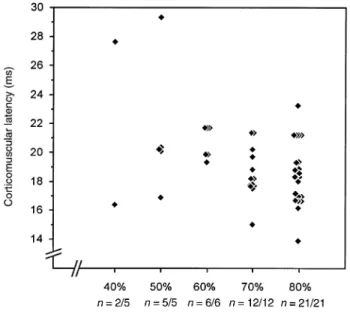
Twenty single MUPs were recorded from 14 muscles studied in 12 patients (the recordings concerned one MUP from each of 12 recording sites, and two distinct MUPs from each of four recording sites). Altogether, 507 transcranial stimuli allowed recording of 12 different single MUPs 423 times (frequency 83%), of two distinct MUPs recorded simultaneously 61 times with 64 stimuli (frequency 95%). The frequency of single MUP responses evoked by above-threshold stimuli, with a facilitation manoeuvre similar to that used with the TST (slight contraction or thought of a contraction of the target muscle), was 96.6% (226 responses to 234 stimuli). The latency of these single MUPs evoked by transcranial stimuli varied markedly from one stimulus to the next, ranging from 0.5 to 15.4 ms (mean 7.3 ms, SD 1.9 ms), depending on the motor unit studied. With increasing intensities of stimulation, the mean latency of the recorded MUP tended to shorten, but the variation of latency did not differ markedly (Fig. 5). It is unlikely that these latency variations were caused by changes of the coil position over the scalp; we were careful to avoid movements of the coil. Moreover, as mentioned before, the magnitude of the latency variation did not change substantially with increasing stimulus intensities (Fig. 5). In the patient in whom the same MUP was studied by electrical and magnetic stimuli, mean latency
Table 3 Variability study comparing SDs of conventional MEPs and triple stimulation techniques (TST) in four normal subjects
Subject Side Stimulus Optimal Conventional ratios (MEP : CMAPErb) TST curve ratios (test : control)
intensity (%) facilitation
Trials Amplitudes Areas Trials Amplitudes Areas
(n) Mean SD (%) Mean SD (%) (n) Mean SD (%) Mean SD (%) Magnetic stimulation 2 L 80 cVA1th 10 70 12.20 103 22.06 5 95 2.44 98 3.80 16 R 80 iVA 6 61 4.78 74 5.34 5 102 1.14 88 5.58 17 L 80 cVA 9 53 10.20 83 11.62 9 97 3.08 97 3.50 18 L 70 cVA 9 56 7.63 83 15.78 9 93 5.49 93 4.05 18 R 70 cVA 10 62 5.90 86 15.59 9 99 0.73 91 4.78 Mean 8.80 60.40 8.14 85.80 14.08 7.40 97.20 2.58 93.40 4.34 Electrical stimulation 18 R 90 cVA 8 42 10.70 79 16.00 9 88 4.80 93 4.50
cVA/iVA5 contralateral/ipsilateral voluntary activity; th 5 think about ipsilateral contraction.
Fig. 5 Variation of latency of a single MUP in response to
magnetic transcranial stimulation when using different stimulus intensities. Recordings were taken via a concentric needle electrode from the triceps in a 52-year-old man suffering from a benign monomelic amyotrophy of the left arm with no sign of central involvement. The responses were facilitated by a slight background contraction of the target muscle. n5 number of responses/number of stimuli.
was shorter by 1.7 ms with electrical stimulation. The variation of the latency from one stimulus to the next was similar with both techniques; the range was 19.4–34.3 ms (SD 4.05 ms) for 15 responses to electrical stimulation, and 21.4–36.2 ms (SD 3.50 ms) for the 26 responses to magnetic stimulation (Fig. 6). Furthermore, in the four muscles from which two distinct MUPs were evoked simultaneously, a desynchronization was observed, i.e. variations of the latency from one stimulus to the next which were independent for
Fig. 6 Variation of the latency of a MUP evoked by transcranial
electrical (A) and magnetic (B) stimuli. Recordings were made via a concentric needle electrode from the ADM in a 49-year-old man suffering from a benign monomelic amyotrophy of the right arm with no sign of central involvement. Peripheral and central conduction velocities are normal. A main biphasic MUP is recorded during voluntary activity (VA; top traces) and in response to transcranial stimulation (below); eight responses to electrical and magnetic stimuli are depicted. The MUP was evoked 15 times by 15 electrical stimuli (using 75% of output of the Digitimer 180 with a slight voluntary contraction of the target muscle that did not involve the MUP evoked by transcranial stimulation) and 26 times by 28 magnetic stimuli (using 90% of the output of the Magstim 200 with a similar facilitation). With electrical stimuli (15 responses) the latency range was 19.4–34.3 ms (mean 24.2 ms, SD 4.05 ms); with magnetic stimuli (26 responses) the latency range was 21.4–36.2 ms (mean 25.9 ms, SD 3.50 ms).
Fig. 7 Variation of latency of two MUPs evoked by transcranial
magnetic stimulation. Recordings were made via a concentric needle electrode from the ADM in a 66-year-old man suffering from a severe diabetic polyneuropathy with no sign of central involvement. Peripheral conduction velocities are slowed. Two main MUPs—a large biphasic potential (MUP1) and a small positive potential (MUP2)—are recorded during voluntary activity (VA; top trace) and in response to magnetic transcranial stimuli (below); six responses are depicted. Using 75% of maximal output of the Magstim 200 at rest, MUP1 was evoked 25 times by 27 stimuli, and the latency range was 39–48 ms (mean 42.1 ms, SD 1.9 ms); MUP2 was evoked 26 times by the same 27 stimuli, and the latency range was 56–64 ms (mean 59.6 ms, SD 1.8 ms). Desynchronization of the two MUPs is demonstrated by the variable latency difference (MUP2 minus MUP1): range 14– 21 ms; mean 17.7 ms (SD 1.9 ms).
the two MUPs (range 1.6–8.9 ms, mean 5.8 ms) (see example in Fig. 7). Six motor units (out of 20) sometimes responded with double responses (altogether 42 responses out of 423 responses were double) with the time interval ranging from 5.4 to 14.9 ms (mean 10.6 ms). These double responses occurred either when the target muscle was slightly contracted, or with high stimulation intensities.
Side effects
The procedures used in this study produced no side effects in any of the individuals.
Discussion
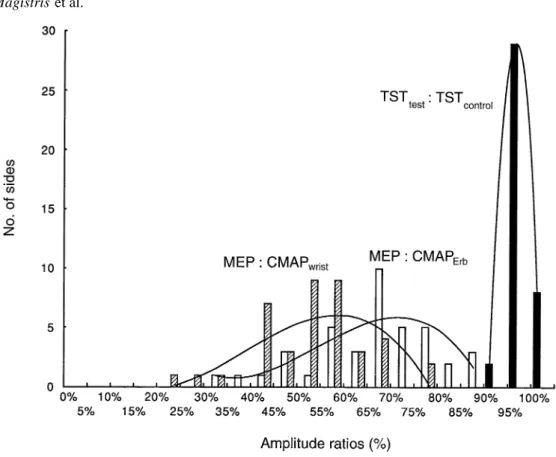
This study demonstrates that electrical and magnetic transcranial stimulation can achieve depolarization of all, or almost all, spinal neurons innervating a target muscle. This fact cannot be deduced directly from ‘conventional’ MEPs, because of the marked desynchronization of the action potentials which occurs within the corticospinal tract or at the spinal cell level. Desynchronization, by varying degrees of phase cancellation, causes the known variability of the shape of MEPs between normal subjects and from one stimulus to the next. It is the main factor in the reduction of MEPs compared with CMAPs evoked by peripheral nerve stimulation. The TST described improves the study of the MEPs by narrowing the normal values that may be derived from normal subjects (Fig. 8). It can provide a useful quantitative electrophysiological measurement of central motor-conduction failure.
Resynchronization of MEPs: the TST
The TST links central to peripheral conduction through two collisions and suppresses the desynchronization. Average amplitude and area ratios (comparing the test TST response with a maximal control TST curve) were 96% for the six sides studied with electrical transcranial stimulation and 99% for the 39 sides studied with magnetic transcranial stimulation. The slightly better superimposition of the test and control curves obtained with magnetic stimulation, compared with electrical stimulation, can probably be accounted for by the greater number of magnetic stimulation trials from which the best superimposition could be chosen. When several magnetic TST recordings were averaged in the same subject (in the study of variability), the mean superimposition from five sides was 97.2% for the amplitude ratios and 93.4% for the area ratios. The difference from 100% superimposition (2.8% for the amplitude ratios and 6.6% for the area ratios) is probably explained by lack of response to transcranial stimulation of a few motor units, since measurement imprecision cannot account for this difference. This explanation is also in close agreement with the result of the single MUP substudy (see below). Nevertheless, lack of response of a small number of motor units is clearly not as important as the phase cancellation phenomenon in explaining the small size of conventional MEPs. The role of phase cancellation may be approximated by subtracting the conventional amplitude ratio (MEP : CMAPErb) from that of the TST curves (test : control). Phase cancellation calculated in this manner was on average 45.2% (SD 16.6%) for the six sides studied with electrical stimulation and 32.8% (SD 13.3%) for the 39 sides studied with magnetic stimulation. Interestingly, there were great inter-individual differences. Phase cancellation ranged from 25 to 63% for electrical stimulation, and from 12 to 68% for magnetic stimulation.
Electrical and magnetic TSTs provided similar results, since both allowed stimulation of nearly all motor units of
Fig. 8 Frequency distribution of the ratios of the potential amplitudes. Values are derived from the 22 normal subjects studied (see
Table 1). The amplitude ratios comparing the MEP with the CMAP evoked by stimulation of the wrist (MEP : CMAPwrist) and Erb’s
point (MEP : CMAPErb) (using the value of the largest MEP recorded) are from 40 sides, the corresponding TST amplitude ratios
(TSTtest: TSTcontrol) are from 39 sides. Fitted curves (third order polynomial equations, calculated using MS Excel) show the dispersion
of the values from normal subjects. In this figure, which summarizes the yield of the TST compared with that of the conventional MEPs, amplitude data were used in preference to areas, since measurement precision was slightly better for amplitudes in this study.
the target muscle. However, there were differences, namely: (i) electrical brain stimulation yielded shorter corticomuscular latencies, a phenomenon previously known (Hess et al., 1987a), but not relevant to the TST measurements; (ii) concerning the facilitation manoeuvre performed in order to achieve maximal responses, electrical stimulation required only contraction of the contralateral homologous muscle (Myers, 1994), whereas a contraction of the target muscle itself was often necessary with magnetic stimulation (in 23 sides out of 39, i.e. 59%). The optimal form of facilitation required for each subject is indicated in Table 1. Despite inter-individual differences in the need for a facilitation, contraction of the target muscle appeared to be the most efficient manoeuvre.
Motor evoked potentials in single motor units
Our substudy investigating single MUPs completes the demonstration made by the TST. Single MUPs evoked by brain stimulation were investigated in patients presenting with strictly peripheral nerve disorders. Because of the peripheral nerve lesions, only one or two clearly distinguishable MUPs were left at the needle recording site. If stimuli were suprathreshold, and if there was an appropriate facilitation manoeuvre, these MUPs were evoked, on average,by 96.6% of the stimuli. This percentage is in accordance with the results of the main TST study and with the observations of others. Zidar et al. (1987) observed that ‘when stimulus strength was slightly above the threshold for the studied motor unit, each stimulus produced a response’. An important variation of the latency of single MUPs following transcranial stimuli was observed (Fig. 6). Variations of latency in two MUPs recorded simultaneously (in three patients) were similar, but they were independent, reflecting variable synchronization (Fig. 7). Extrapolated to the sum of the MUPs in a healthy muscle, the variations in inter- and intra-individual MEP size are readily explained by the phase cancellation phenomenon between individual MUPs composing the MEP, as depicted in Fig. 1.
The fact that our single MUP study was performed in patients with peripheral nerve lesions may possibly have influenced our results, since changes within the CNS may follow PNS disorders (Merzenich et al., 1983; Brasil-Neto et al., 1993). Such influences may explain the large dispersion of the single motor unit response latencies observed in our study (up to 15 ms). Alternatively, we cannot exclude the possibility that an MUP occurring by chance (in response to voluntary activity or during a spontaneous muscle twitch, i.e. a fasciculation) may have falsely increased this dispersion in some instances. Considering these possibilities, the variation
of latencies and desynchronization observed in our substudy are in agreement with the results of the TST, and with the results obtained in healthy subjects studied with near-threshold stimulation (Hess et al., 1987a), with peristimulus time histograms (Day et al., 1987; Boniface et al., 1991), or with single-fibre EMG recordings techniques (Zidar et al., 1987). However, in the latter studies, as an inherent methodological limitation, transcranial stimuli had to remain close to threshold, giving rise to a bias towards low threshold motor units. Our results confirm these previous findings, but they are from single motor units that were not likely to be affected by such a bias.
The mechanisms causing the variable desynchronization of the potentials are not entirely understood. In the present study, this desynchronization was similar for electrical and magnetic stimuli, pointing to a subcortical mechanism. This is in agreement with previous observations on the influence of spinal motor neuron excitability on corticomuscular latencies following transcranial stimulation (Mills, 1991). However, our observations do not rule out additional changes of excitability of cortical motor neurons, variations of the site of excitation within the brain, or the possibility of different conducting pathways, so further discussion of this topic is beyond the scope of this paper.
Technical considerations and limitations of the
TST
Measurements in this study concerned only the ADM muscle and they need confirmation from other muscles. Preliminary experiments indicate that similar results may be expected from other muscles (for instance the first dorsal interosseus and the tibialis anterior). For investigation of lower limb muscles, the optimal stimulation and recording modalities remain to be defined. The TST cannot be used to study proximal muscles, since clear time intervals are required between peripheral stimuli sites in order to obtain a clear separation between first and second main deflections of the TST curve.
Two further limitations of the TST need discussion. First, since the third stimulus was at Erb’s point, the peripheral segment between the spinal motor neuron and Erb’s point was included in the corticospinal tract assessment. Erb’s point stimulation was preferred over root stimulation in order to ascertain excitation of all fibres leading to the target muscle (maximal stimulation). The inclusion of this small peripheral segment was considered negligible in the present study, since conduction abnormalities within this segment were unlikely in our healthy subjects. In examinations of patients with motor deficits, however, it might be a drawback since a proximal nerve conduction disorder could be misinterpreted as a central defect. On the other hand, we have used the technique to quantify proximal peripheral nerve conduction blocks in patients with demyelinating polyneuropathies (M.R.M., K.M.R. and A.T., unpublished).
Brainstem stimulation applied to the foramen magnum level (Ugawa et al., 1994) would be an interesting alternative to Erb’s point stimulation, but the two stimuli with a short inter-stimulus interval required for the TST control curve were judged too unpleasant for the subjects. Secondly, when multiple potential volleys are abundant, they sometimes interfere with the second deflection of the TST and cause difficulties in the measurement of the true size of the response. In our series of 22 subjects, measurement was impossible in one subject (one side out of 40); in many subjects measurement required vertical adjustments of the baseline in order to superimpose the second deflections of the TST test and control curves. These baseline adjustments may be influenced by subjective judgement of the examiner. Our investigation of the inter-examiner differences showed that differences in measurement were ø6% for the amplitudes andø10% for the areas (95% limits of agreement).
Conclusion
Today, neurophysiological assessment of disturbances of central motor pathways rely mostly on the measurement of the CCT. While this parameter is of interest for disclosure of subclinical disorders, it is not directly related to the motor deficit experienced by the patient. The technique described here provides a quantitative electrophysiological measure-ment of the central motor-conduction failure that causes the patient’s handicap. Detection and quantification of the proportion of non-conducting axons within the corticospinal tract should be possible both in functional defects of conduction (in case of central conduction block) and in lesional defects of conduction (caused by cell death or axonal lesion). It should thus become a useful diagnostic tool, and provide an accurate objective quantification in follow-up studies, including assessment of the efficiency of treatments. Furthermore, TST examination in patients should contribute to the understanding of the physiology and pathophysiology of conduction within the central motor pathways. We have begun to use the method in patients with a variety of central motor-conduction abnormalities, and preliminary data meet these expectations (M.R.M., K.M.R. and A.T., unpublished).
Acknowledgements
We wish to thank Professor Christian W. Hess and Dr Ge´rard Roth for their helpful comments and suggestions, Mrs Ursula Gruaz for her technical help and Dr Michael A. Morris for his help in the preparation of the manuscript. This work was supported by the Swiss National Science Foundation (Grant 31–43454.95).
References
Altman DG. Practical statistics for medical research. London: Chapman and Hall; 1991.
Barker AT, Jalinous R, Freeston IL. Non-invasive magnetic stimulation of the human motor cortex [letter]. Lancet 1985; 1: 1106–7.
Berardelli A, Inghilleri M, Rothwell JC, Cruccu G, Manfredi M. Multiple firing of motoneurones is produced by cortical stimulation but not by direct activation of descending motor tracts. Electroencephalogr Clin Neurophysiol 1991; 81: 240–2.
Boniface SJ, Mills KR, Schubert M. Responses of single spinal motoneurons to magnetic brain stimulation in healthy subjects and patients with multiple sclerosis. Brain 1991; 114: 643–62. Boyd SG, Rothwell JC, Cowan JM, Webb PJ, Morley T, Asselman P, et al. A method of monitoring function in corticospinal pathways during scoliosis surgery with a note on motor conduction velocities. J Neurol Neurosurg Psychiatry 1986; 49: 251–7.
Brasil-Neto JP, Valls-Sole´ J, Pascual-Leone A, Cammarota A, Amassian VE, Cracco R, et al. Rapid modulation of human cortical motor outputs following ischaemic nerve block. Brain 1993; 116: 511–25.
Day BL, Rothwell JC, Thompson PD, Dick JP, Cowan JM, Berardelli A, et al. Motor cortex stimulation in intact man. 2. Multiple descending volleys. Brain 1987; 110: 1191–209.
Hess CW, Mills KR, Murray NM. Magnetic stimulation of the human brain: facilitation of motor responses by voluntary contraction of ipsilateral and contralateral muscles with additional observations on an amputee. Neurosci Lett 1986; 71: 235–40.
Hess CW, Mills KR, Murray NM. Responses in small hand muscles from magnetic stimulation of the human brain [published erratum appears in J Physiol (Lond) 1990; 430: 617. J Physiol (Lond) 1987a; 388: 397–412.
Hess CW, Mills KR, Murray NM, Schriefer TN. Magnetic brain stimulation: central motor conduction studies in multiple sclerosis. Ann Neurol 1987b; 22: 744–52.
Magistris MR, Myers P. Potentiels e´voque´s moteurs corticaux. Roˆle de l’annulation de phases provoque´e par la de´synchronisation de la conduction cortico-spinale [abstract]. In: Cadilhac J, Dapre`s G, editors. EMG VIIie`mes Journe´es d’EMG de Langue Franc¸aise. Montpellier: Sauramps Me´dical; 1990. pp. 59–61.
Marsden CD, Merton PA, Morton HB. Maximal twitches from stimulation of the motor cortex in man [abstract]. J Physiol (Lond) 1981; 312: 5P.
Merton PA, Morton HB. Stimulation of the cerebral cortex in the intact human subject. Nature 1980; 285: 227.
Merzenich MM, Kaas JH, Wall JT, Sur M, Nelson RJ, Felleman DJ. Progression of change following median nerve section in the cortical representation of the hand in areas 3b and 1 in adult owl and squirrel monkeys. Neuroscience 1983; 10: 639–65.
Mills KR. Magnetic brain stimulation: a tool to explore the action of the motor cortex on single human spinal motoneurones. [Review]. Trends Neurosci 1991; 14: 401–5.
Mills KR, Hess CW, Murray NM. Magnetic scalp stimulation cannot be supramaximal [abstract]. Electroencephalogr Clin Neurophysiol 1987; 66: S68.
Myers JP. Potentiels e´voque´s moteurs corticaux. Roˆle de l’annulation de phases provoque´e par la de´synchronisation survenant au niveau des voies motrices centrales [thesis]. Geneva: Geneva University (thesis no. 9593) 1994.
Patton HD, Amassian VE. Single and multiple unit analysis of cortical stage of pyramidal tract activation. J Neurophysiol 1954; 17: 345–63.
Rossini PM, Marciani MG, Caramia M, Roma V, Zarola F. Nervous propagation along ‘central’ motor pathways in intact man: characteristics of motor responses to ‘bifocal’ and ‘unifocal’ spine and scalp non-invasive stimulation. Electroencephalogr Clin Neurophysiol 1985; 61: 272–86.
Roth G, Egloff-Baer S. Ephaptic response in man. Eur Neurol 1979; 18: 261–6.
Roth G, Magistris MR. Detection of conduction block by monopolar percutaneous stimulation of the brachial plexus. Electromyogr Clin Neurophysiol 1987; 27: 45–53.
Roth G, Magistris MR. Identification of motor conduction block despite desynchronisation. A method. Electromyogr Clin Neurophysiol 1989; 29: 305–13.
Ugawa Y, Uesaka Y, Terao Y, Hanajima R, Kanazawa I. Magnetic stimulation of corticospinal pathways at the foramen magnum level in humans. Ann Neurol 1994; 36: 618–24.
Zidar J, Trontelj JV, Mihelin M. Percutaneous stimulation of human corticospinal tract: a single-fibre EMG study of individual motor unit responses. Brain Res 1987; 422: 196–9.
Received July 4, 1997. Revised October 3, 1997. Accepted October 20, 1997