Comp Clin Pathol (2006) 15: 117–129 DOI 10.1007/s00580-006-0602-x
T E C H N I C A L N O T E
Bettina Wenger-Riggenbach . Mike Hässig . Regina Hofmann-Lehmann . Hans Lutz
Evaluation of the LaserCyte: an in-house hematology analyzer
for dogs and cats
Received: 3 January 2006 / Accepted: 6 February 2006 / Published online: 13 June 2006
# Springer-Verlag London Limited 2006
Abstract In the present study, the LaserCyte instrument, a fully automated flow cytometer for use in veterinary practice, was evaluated for dogs and cats. Precision (coefficient of variation, CV) for red blood cell (RBC) parameters was≤3.9%, for reticulocytes between 14.9 and 102%, for white blood cells (WBC) between 3 and 9.5%, for neutrophils between 3.9 and 6.5%, for lymphocytes between 7 and 17.9%, for monocytes between 4.9 and 13.1%, for eosinophils between 10.4 and 32.1%, for basophils between 7.8 and 32%, for platelets between 3.1 and 13.2%, and for platelet indices between 0 and 28.2%. The range of linearity extended the reference ranges. The agreement with reference methods (coefficient of correla-tion, r) were ≥0.96 (RBC), ≥0.94 (hematocrit), ≥0.96 (hemoglobin), ≥0.95 (mean corpuscular volume), ≥0.94 (WBC), ≥0.93 (neutrophils), ≥0.77 (lymphocytes), ≥0.77 (monocytes),≥0.29 (eosinophils), ≥0.03 (basophils), ≥0.13 (reticulocytes), and ≥0.86 (platelets). The LaserCyte allowed the correct assessment of RBC and WBC parameters with respect to clinical relevance in the majority of samples. Lymphocytopenia was detected in only 51 out of 89 cases and monocytopenia in one out of 11 cases. The reticulocyte counts were correctly estimated in 85 out of 149 cases. It was concluded that the LaserCyte allowed reliable determination of the RBC parameters, WBCs, neutrophils in both species and platelets in dogs. Based on its capability to reliably determine feline platelets and of
the parameters mentioned above, this instrument is considered a useful in-house analyzer for the veterinary practice. Qualitative microscopic assessment of blood smears is still necessary for detecting abnormal cell morphologies, certain cell precursors and blood parasites. Keywords Hematology . Flow cytometry . Blood cell counting . Leukocyte differentiation . Evaluation . Dogs . Cats
Introduction
Hematology results provide important information on the patient’s state of health, disease history and response to treatment. Blood cell counts and characteristics of cells can change quickly in drawn samples; rapid analysis of these parameters is, therefore, vital for clinicians. The invention of the Coulter cell counter and cell volume analyser in 1956 highly reduced time-consuming manual work by automat-ing the countautomat-ing and sizautomat-ing of cells (Fulwyler 1980). Today, instruments based on Coulter’s impedance principle are widely distributed in veterinary practices. Another method to determine differential blood cell numbers is used by the centrifugal hematology analyzer (QBC VetAutoread Hematology system1), which applies the principle of quantitative buffy coat analysis (Hofmann-Lehmann et al. 1998; Bienzle et al.2000). Hematology instruments based on laser flow cytometry can provide additional diagnostic information, such as WBC differentiation or reticulocyte counts, but have typically been found only in reference laboratories and high-volume clinics due to their size and costs. While hemoglobin concentrations are usually mea-sured by means of spectrometry, the QBC VetAutoread Hematology system reliably deduces the hemoglobin concentration from the depth of submergence of the float in the RBCs (Hofmann-Lehmann et al.1998).
The LaserCyte is the first in-house hematology analyser based on the principle of flow cytometry adapted for the needs of veterinary medicine in the smaller practice setting. Only little hands-on time is necessary for sample analysis IDEXX Laboratories, Westbrook, Maine 04092, USA
B. Wenger-Riggenbach . R. Hofmann-Lehmann . H. Lutz (*) Clinical Laboratory, Vetsuisse Faculty, University of Zurich, Winterthurerstr. 260, CH-8057 Zurich, Switzerland Tel.: +41-44-6358312 Fax: +41-44-6358906 e-mail: [email protected] URL: http://www.vetlabor.unizh.ch M. Hässig
Department of Farm Animals, Vetsuisse Faculty, University of Zurich,
Winterthurerstr. 260, CH-8057 Zurich, Switzerland
and for maintenance; the analysis time is 13 min per sample, which seems acceptable for veterinary practi-tioners. The aim of this study was to evaluate the LaserCyte on feline and canine blood samples and to test the instrument with respect to the clinical relevance of its results.
Materials and methods
Blood samples
Blood samples were collected by venipuncture from 137 and 176 healthy and ill dogs and cats, respectively, regardless of sex, age, or breed, during the routine clinical work at the Small Animal Clinic, Vetsuisse Faculty, University of Zurich. Samples were used to assess the precision, linearity, and accuracy of the instrument. The samples were collected in tubes containing K3-EDTA.1 After arrival at the laboratory, 500μl of the blood sample were transferred to special plain tubes2that fit the sample holder of the LaserCyte. The remaining sample volume was subjected to the analysis by reference methods simultaneously to the analysis by LaserCyte. All samples were analysed within 4 h of collection with the exception of the determination of the precision which lasted up to 6 h.
Instruments and methods used LaserCyte
The LaserCyte provides results for 18 hematological parameters: counts of white blood cells (WBC), lympho-cytes (LYM), monolympho-cytes (MONO), neutrophils (NEU), eosinophils (EOS), basophils (BASO), red blood cells (RBC), reticulocytes (RETI), and platelets (PLT) are determined directly in the flow cytometer; hemoglobin (HGB) is evaluated spectrophotometrically by a propri-etary technique (see below), while hematocrit (HCT), mean corpuscular volume (MCV), mean corpuscular hemoglobin concentration (MCHC), mean corpuscular hemoglobin (MCH), red cell distribution width (RDW), mean platelet volume (MPV), plateletcrit (PCT), and platelet distribution width (PDW) are calculated.
For the analysis of each sample, a separate test tube is used. The test tube (CBC5R tube) contains New Methylene Blue, Purfac-A-39-Pric, buffers, preservatives, and latex beads. The latter are particles with a diameter of 4μm and present in the tube in a known quantity; they are used for quality assurance within each sample. In the flow cytom-eter, a stream containing the cells is transported through a flow chamber, where each cell passes through a beam of laser light. The incident light is absorbed and scattered by the blood cells. The size and granularity of the cells are
measured and the resulting extinction (EXT), the direction of scattered light (low-angle forward light scatter (FSL), right-angle scatter (RAS), high-angle forward light scatter (FSH), the amount of scattered light and the time, during which a cell is exposed to laser light [time of flight (TOF)], are used to characterize each cell passing the device.
The LaserCyte performs two successive measurement steps. In the first step, the sample is analyzed to determine RBCs, RETI, PLT, MCV, and MPV. In addition, the amounts of scattered and absorbed light generated by the latex beads present in the test tube are determined. They are used as an internal control of the gate settings, which in turn are relevant to assign the individual signals to populations of identical or similar cells. The Purafac-A-39-Pric in the test tube causes the RBCs to become spherical. The quantity of light scatter generated by the spherical RBCs depends on the cell size, but not on the orientation of the cells. The RETIs are stained with the New Methylene Blue present in the test tube. They are differentiated by the instrument from mature RBCs by the different extinction and light scatter caused by the stained RNA fragments in the RETI.
In the second measurement step, the RBCs are osmot-ically lysed by the addition of a hypotonic sheath solution and the WBC counts determined and the WBC differen-tiation is made. The hemoglobin concentration is deter-mined during both measurement steps by spectrometry. In the first measurement step, the hemoglobin concentration is measured on the basis of the absorbance of intact, Methylene-Blue-stained RBCs. The specific absorbance spectrum associated with this staining solution is measured at four wavelengths. During the second measurement step, the RBCs are lysed. This facilitates the measurement of the free hemoglobin concentration in solution. As intact red cell membranes scatter light, the hemoglobin concentra-tions from the first measurement step is not as accurate as those of the second measurement step. However, compar-ison of the results of the two measurements serves as an internal control. If the two independent hemoglobin measurements and the dye ratio between the two solutions match, the correctness of the dilutions is confirmed. The sample preparation takes just a few seconds; the analysis itself takes 13 min using the software version 1.15, which was used in this study.
To expedite the study, two instruments were made available. One instrument (DXBP 001484) was used only for the accuracy of the canine blood sample, while the other instrument (DXBP001412) was used for the remaining analysis (accuracy of feline blood, precision, linearity). This enabled us to run two samples in parallel. Quality control of the instrument is provided with each measure-ment by assessing the number and position of the latex beads on the dot plot and by the evaluation of the ratio of the two hemoglobin measurements mentioned above. No additional control measurements are necessary.
1Micro tube K3-EDTA, Sarstedt, D-51588 Nümbrecht.
2BD Vacutainer, No Additive, Franklin Lakes, NJ 07417-1885,
Reference methods
The CellDyn 35003 was used as the reference instrument (Kieffer et al.1999). This hematology analyzer is based on the combination of the impedance method and flow cytometry. The white blood cells are counted by two separate channels, the electrical impedance channel (white blood cell impedance count=WIC) and the optical flow channel (white blood cell optical count=WOC). Differen-tiation of the WBC is done in the WOC channel. The hemoglobin concentration is measured spectrophotometri-cally on the basis of a hemiglobinhydroxylamine method. The indices of the red blood cells and platelets were calculated. The following parameters generated by the CellDyn 3500 were used as reference values: the counts of WBCs, RBCs of both species, and canine PLTs, the HGB, HCT, MCV, RDW, MCHC, MCH, MPV, PCT, and PDW. Microscopic methods were used to determine differen-tial WBC and RETI counts in blood samples from dogs and cats and to investigate platelet counts in blood samples from cats. For the WBC differentials, blood smears were stained automatically using an automated staining instru-ment.4 Two technicians with >10 years of experience in veterinary hematology differentiated 100 cells per smear each. The mean of the 200 cells was used to calculate the percentage distribution of the WBC differentials. Absolute values of leukocyte differentials were obtained by multi-plying the absolute WBC counts of the CellDyn 3500 by the microscopically determined percentage of each WBC subpopulation, i.e., neutrophils, lymphocytes, monocytes, eosinophils, and basophils. Manual RETI counts were performed by enumerating the RETI as a percentage of 1,000 mature RBC using a standard method based on Brillant Cresyl Blue stained blood smears.
In blood samples from cats, only the aggregated reticulocytes were counted, which represent the more immature cells and are characterized by large clumps or strands of precipitated nucleoprotein (Perkins et al.1995). Absolute values of reticulocytes were calculated by multiplication of the microscopically determined fraction of RETI with the RBC counts of the CellDyn 3500. The feline PLT counts were determined using a Neubauer hemocytometer.5This was necessary because feline plate-lets cannot be determined by the Coulter principle as large platelets overlap in volume with small erythrocytes. The blood was diluted at a ratio of 1:100 in phosphate-buffered 1% ammoniumoxalat with Unopettes,6which led to a lysis of the RBCs but not the PLT, WBC, and RETI. PLTs were enumerated microscopically by two technicians experi-enced in veterinary hematology. The mean of the two counts were used as the reference value of PLT count.
Precision
When the within-run precision of an instrument is determined, the reproducibility of the results is tested on the basis of repeated analyses of the same blood sample. The size of random errors is, thus, determined by calculation of the coefficient of variation (CV) (Knoll and Rowell 1996). The precision of the LaserCyte was determined on the basis of 12 and in one blood sample of 16 analyses of fresh K3-EDTA-anticoagulated blood samples. The blood samples had been collected from one dog with intermediate (17.03×10³/μl) WBC, one dog with a low (4.53×10³/μl) WBC, one dog with a high (82.59×10³/μl) WBC, and one cat with an intermediate (9.26×10³/μl) WBC count. For these measurements, at least 2 ml of blood was used. As the determination of the precision required a relatively large amount of blood, precision was determined once only with cat blood in order not to collect too much blood from an already sick cat. The blood samples were stored at room temperature during testing.
The precision was assessed for the counting of WBCs, LYMs, MONOs, NEUs, EOSs, BASOs, RBCs, RETIs, and PLTs, and the measurements of HGB, HCT, HCV, MCH, MCHC, RDW, PCT, and PDW. The assessment of precision took between 3½ and 6 h. During this time, cell aging could occur. To compensate for these processes, which could interfere with the precision measurement, the blood samples were analyzed simultaneously using the LaserCyte and the reference methods. In addition, unin-terrupted analyses could cause the LaserCyte to overheat. To determine the effect of any instrument warming on the blood cells, a 100-min cooling-down phase was introduced after each eight analyses.
Linearity
The linearity of the measurement range was assessed to determine whether blood values outside of the reference interval can be measured correctly. Cell counts could be underestimated when, with increasing cell counts, the probability of multiple cells passing simultaneously through the orifice of the laser beam increases. The linearity of the measurement range was assessed using two K3-EDTA anticoagulated canine blood samples. One blood sample was used to assess the linearity of the measurement range of WBC, LYM, MONO, NEU, HCT, RBC, HGB, and RETI.
A second blood sample with especially high PLT count (673×103/μl) was used to determine the linearity of the PLT measurement. To obtain hematological values above and below the reference range, the two canine blood samples were centrifuged at 400×g for 10 min.7 Some plasma was removed, and the concentrated HCT and blood cells were resuspended by careful mixing. The samples were then diluted with isotonic phosphate buffered saline
3Abbott AG, Baar, Switzerland.
4Hema Tek 1000, Bayer AG, Zürich, Switzerland. 5Assistant Germany, Karl Hecht AG, D-97647 Sandheim. 6Becton Dickinson and Company, Ranklin Lakes NJ 07414-1885,
(PBS8) in 10% increments from 100% (= undiluted samples) down to 10%. Measured values were plotted vs calculated vales in an x–y scattergram; the regression was calculated using the least square method and the equation of the resulting line was described as y=a+bx. The range of linearity was determined by visual inspection of the plots.
Accuracy
The accuracy was measured by comparison of the LaserCyte results with those of the reference methods. A total of 132 blood samples from dogs and 175 from cats were included. Around 90% of the blood samples were analysed within 2 h after collection, and 10% within 4 h after collection.
Evaluation of the clinical relevance of results obtained by LaserCyte
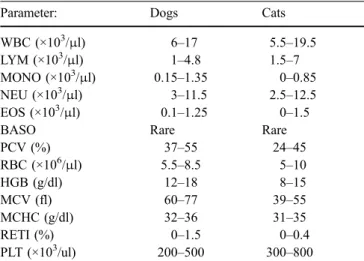
For each sample, the numeric data obtained by the LaserCyte were compared with accepted reference ranges for dogs and cats (Table1). The results obtained from the canine and feline samples were interpreted to be either within the reference range or below or above the reference range. The corresponding results obtained by the reference methods were analyzed identically. The two resulting interpretations obtained for each sample and each param-eter dparam-etermined by the two methods were compiled and compared to each other.
Statistical methods
All data were compiled using the Excel program.9 Preci-sion was determined by calculation of the coefficients of variation (CV). The variation determined included not only the technical variation but also variation due to aging processes of the cells; the latter was assessed by calculating a regression line of the measured values over time, and the aging effect was eliminated by calculating the CV of the mean plus the residual for each time point using a PC-based statistical program10(Altman1994). To determine whether changes of the values over time were significant, the p values of the regression coefficients were calculated; p values of ≤0.05 were considered significant. Linearity and accuracy were calculated on the basis of determination of the regression line of the form y=a+bx and calculation of the coefficient of correlation (r) using the Excel program.10 Accuracy was calculated by method comparison using the Passing Bablok method (Passing et al.1981; Passing and Bablok1983; Eisenwiener et al.1984; Passing and Bablok 1984; Bablok and Passing 1985; Bablok et al.1988). In addition, method comparison was also done by the difference plots described by Jensen (Jensen 2000). To test whether the differences between the methods deviated significantly from zero the Wilcoxon Signed rank test was used (Jensen2000).
Message codes
Message codes are displayed by the LaserCyte when the instrument’s system for quality assurance is not able to assign certain cells to a population or when certain limit values are exceeded. The messages draw the user’s attention to abnormal blood samples or technical problems. When results were displayed with a message code, samples were analyzed a second time. If the second analysis of a blood sample yielded again a message code, the results of the entire run were excluded from the determination of the accuracy with the exception of the samples that had been marked with a MPV-flag. The latter message code (“MPV out of reportable range”) is displayed if the MPV is supposedly outside the 2–30 fl range. For samples with a MPV message code, only the MPV values were dis-regarded; all other parameters were included in the analyses as they should not have been affected. In samples displaying a message code, twice the reason for the message code was evaluated by additional examination of the dot plots and the smear; the results were compiled separately in a table.
Table 1 Reference values of haematological parameters for dogs and cats used in this studya
Parameter: Dogs Cats
WBC (×103/μl) 6–17 5.5–19.5
LYM (×103/μl) 1–4.8 1.5–7
MONO (×103/μl) 0.15–1.35 0–0.85
NEU (×103/μl) 3–11.5 2.5–12.5
EOS (×103/μl) 0.1–1.25 0–1.5
BASO Rare Rare
PCV (%) 37–55 24–45 RBC (×106/μl) 5.5–8.5 5–10 HGB (g/dl) 12–18 8–15 MCV (fl) 60–77 39–55 MCHC (g/dl) 32–36 31–35 RETI (%) 0–1.5 0–0.4 PLT (×103/ul) 200–500 300–800 a
According to Feldman et al.,“Schalm’s Veterinary Hematology” (Feldman et al.2000), 5th edition, pages 1058 and 1065
8Dulbecco’s phosphate buffered saline, SIGMA-Aldrich Company,
LTD Ir vine, Ayrshire KA 12 8NB, UK.
9Excel 2003, Microsoft Corporation, 1 Microsoft Way, Redmond,
WA 98052-6399, USA.
10Stat View software, Version 5, SAS Campus Drive, Cary, NC
Results
Display of measured values
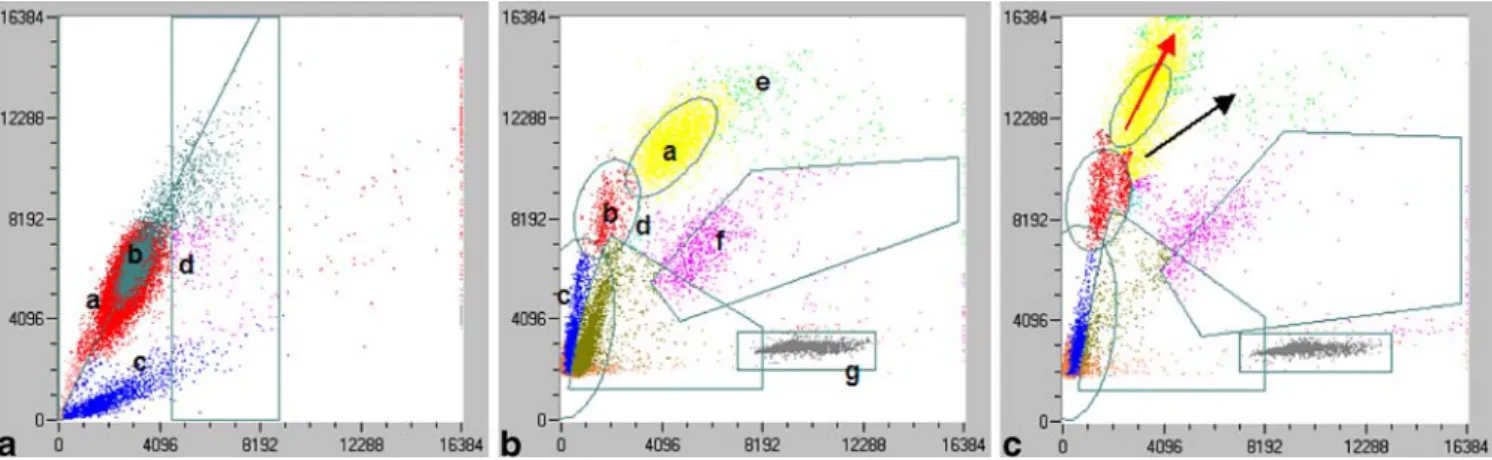
After each measurement, the LaserCyte displays the results of the 18 parameters analyzed on a report form together with reference values for juvenile, adult, and senile dogs and cats. In addition, the dot plots can be printed out. An experienced user can, thus, check the measurement visually. The dot plots for the first measurement step, relating to RBCs, reticulocytes, and platelets are shown in Fig. 1a and the dot plot for the second step, relating to WBC differentiation, in Fig.1b. The dot plots of the feline and canine blood samples in principle are quite similar. The cell populations and the latex beads are represented by colored clouds and the gates set by the instrument to discriminate the different cell populations are indicated by black lines. The correct differentiation of the cells can be estimated on the basis of the dot plots. In 25 feline and in two canine blood samples, a shift to the upper left of cell population representing the neutrophils was observed (Fig. 1c). This shift indicates the presence of stab neutrophils. In 12 out of these 25 feline blood samples and in both of the canine blood samples, a left shift of the neutrophils could also be found microscopically. In an additional two feline and 16 canine blood samples, stab neutrophils were found microscopically, but no left shift of the neutrophils was seen on the dot plots.
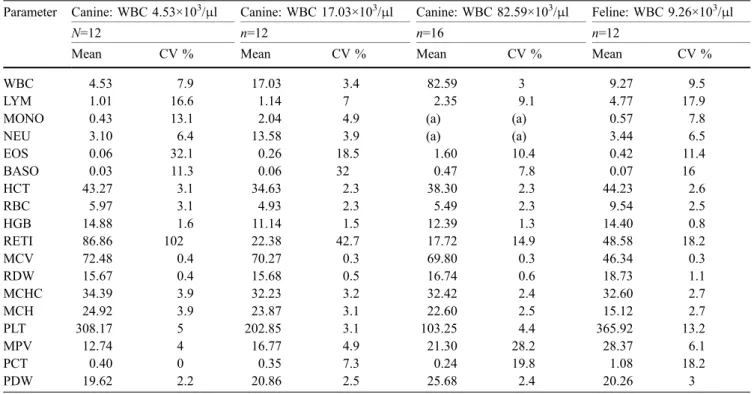
Precision
The precision of instrument no. DXBP001412 was determined using software version 1.15. The mean values and coefficients of variation for within-run precision are summarized in Table2. The following message codes were obtained during the assessment of the precision: in the canine blood sample with a mean WBC count of 4.53×10³/μl: four times “DECAY” standing for a
signif-icant number of WBC, which decayed during the analysis; in the canine blood sample with a WBC count of 17.03×10³/μl: two times “differential algorithm issues” concerning problems with the differentiation of lympho-cytes and monolympho-cytes; in the canine blood samples with a WBC count of 82.54×10³/μl: “differential algorithm issues” concerning the differentiation of neutrophils and monocytes in every run. In the feline sample, three times the message code “MPV out of reportable ranges” was shown. Measurements associated with a message code were excluded from the study.
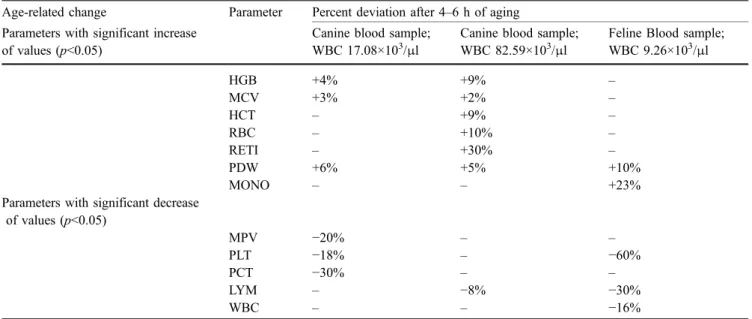
During the precision studies, it was found that the results changed with time. Therefore, the results were analyzed for systematic changes. The influence of cell aging and instrument warming was examined. Figure 2a and b shows the analysis of cell aging and possible effects of instrument warming. The cooling break did not result in a visible alteration of the precision in all measured parameters. The changes of the results caused by the sample aging process are presented in Table3. To prevent this biological process of cells from having a negative impact on measurement precision, the CV was calculated by means of analysis of residues.
Linearity
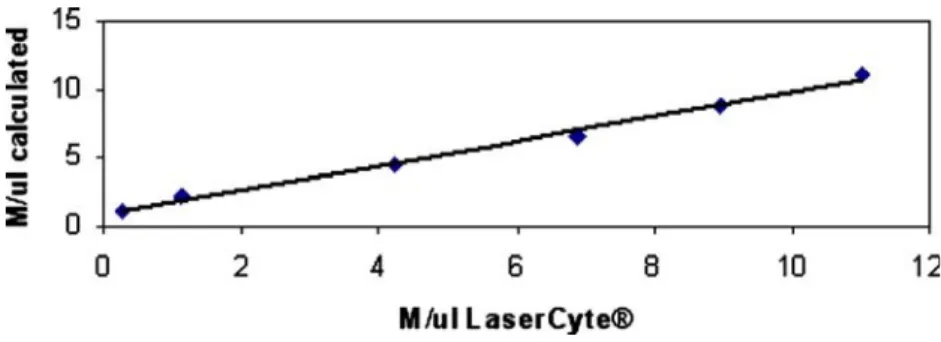
The parameters and ranges for which linearity was tested are compiled in Table4. In addition, the linearity for RBC measurements is shown in Fig. 3. For basophils and eosinophils, the linearity was not assessed as the cell numbers were too small. It became evident that the measurement of all parameters evaluated by the LaserCyte was linear, at least, within the tested ranges.
Fig. 1 a Scattergram presentation of normal feline red cells, reticulocytes, and platelets. X-axis: right angle scatter, y-axis: extinction of every cell passing the laser. a=RBC, b=RBC-Doublets, c=PLT, d=RETI. b: Scattergram presentation of normal feline white cells. X-axis: right angle scatter, y-axis: extinction of every cell passing the laser. a=NEU, b=MONO, c=LYM, d=BASO, e=EOS,
f =Cell debris, g=Latex beads. c: Representative scattergram presen-tation of a shift of the neutrophil population to the upper left region indicating an increase of stab neutrophils in a feline blood sample. X-axis: right angle scatter, y-X-axis: extinction of every cell passing the laser. Black arrow=usual direction of the neutrophil population; red arrow=shift of the neutrophil population to the upper left region
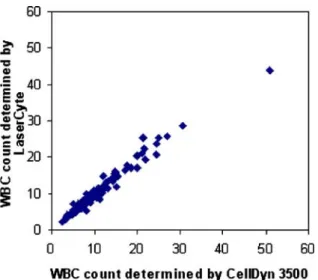
Accuracy
The results of the comparison of methods are listed in Table 5; one example (WBC) of the comparison is graphically displayed in Fig. 4. With the CellDyn 3500, the platelet indices MPV, PCT, and PDW are only displayed if a certain species–specific limit value for platelets is exceeded. Only 59 out of 116 canine blood samples and 19 out of 129 feline blood samples exceeded this limit value. In view of the relatively low clinical significance of the platelet indices, these were excluded from the comparative study. The evaluation of the accuracy by visual inspection revealed values which were clearly separated from the regression line and were, therefore, considered“outliers”. A total of 12 outliers were identified, namely, for monocytes (one dog), basophils (one cat, one dog), eosinophils (three cats, three dogs), HCT (one cat, one dog), and reticulocytes (one dog).
Evaluation of the clinical relevance of results obtained by LaserCyte
The evaluation of the LaserCyte results with respect to their clinical relevance, in comparison with the results of the reference methods, are compiled in Table6A and B. Every LaserCyte result that may have led to a clinical conclusion different from that of the reference method was individu-ally judged with respect to the degree of the deviation, and two categories were defined: if the discrepancy was minor, e.g., the MCHC of the reference method was 33 (reference Table 2 Within-run precision: mean value and coefficient of variation for blood samples from dogs with either low, normal or high total WBC counts and a cat with a normal WBC count
Parameter Canine: WBC 4.53×10³/μl Canine: WBC 17.03×10³/μl Canine: WBC 82.59×10³/μl Feline: WBC 9.26×10³/μl
N=12 n=12 n=16 n=12
Mean CV % Mean CV % Mean CV % Mean CV %
WBC 4.53 7.9 17.03 3.4 82.59 3 9.27 9.5
LYM 1.01 16.6 1.14 7 2.35 9.1 4.77 17.9
MONO 0.43 13.1 2.04 4.9 (a) (a) 0.57 7.8
NEU 3.10 6.4 13.58 3.9 (a) (a) 3.44 6.5
EOS 0.06 32.1 0.26 18.5 1.60 10.4 0.42 11.4 BASO 0.03 11.3 0.06 32 0.47 7.8 0.07 16 HCT 43.27 3.1 34.63 2.3 38.30 2.3 44.23 2.6 RBC 5.97 3.1 4.93 2.3 5.49 2.3 9.54 2.5 HGB 14.88 1.6 11.14 1.5 12.39 1.3 14.40 0.8 RETI 86.86 102 22.38 42.7 17.72 14.9 48.58 18.2 MCV 72.48 0.4 70.27 0.3 69.80 0.3 46.34 0.3 RDW 15.67 0.4 15.68 0.5 16.74 0.6 18.73 1.1 MCHC 34.39 3.9 32.23 3.2 32.42 2.4 32.60 2.7 MCH 24.92 3.9 23.87 3.1 22.60 2.5 15.12 2.7 PLT 308.17 5 202.85 3.1 103.25 4.4 365.92 13.2 MPV 12.74 4 16.77 4.9 21.30 28.2 28.37 6.1 PCT 0.40 0 0.35 7.3 0.24 19.8 1.08 18.2 PDW 19.62 2.2 20.86 2.5 25.68 2.4 20.26 3
(a) Message codes in every analysis
Fig. 2 Aging effect on RBC values over an observation time of 6 h. A canine blood sample was aliquoted into 16 tubes, which were stored at 20°C and analyzed by the two instruments in 20-min intervals. To determine the effect of instrument warm-up on the blood cells, a 100-min cooling-down phase was introduced after the eighth analysis. Red arrow 100-minute cooling-down phase. a Results obtained by the LaserCyte; y=0.04x+5.15; b results obtained by the CellDyn 3500, y=0.02x+5.12
values 32–36 g/l) and the LaserCyte had 31.7 g/l the discrepancy was considered minor. Minor deviations were usually <<10% of the lower or upper reference values. Major deviations were defined as discrepancies that would have led to a severely different clinical interpretation, e.g., >10% of the lower and upper reference values.
Message codes
The distribution of the various message codes in terms of numbers is summarized in Table7.
One or more message codes were displayed for 16 out of 137 canine blood samples (11.7%) and 97 out of 176 feline blood samples (55%). A total of 38 samples (ten canine and 28 feline) were marked with“Differential algorithm issues” or“Possible rate analysis issue” because of difficulties in assigning individual cells to a certain group. As recom-mended for each of these samples, the blood smears were inspected microscopically. In the only canine blood sample
with the message code concerning the differentiation of the monocytes and lymphocytes, a moderate left shift was observed by microscopy. In the two feline blood samples, no obvious reason for the message code “differential algorithm issues” was found. In six canine and eight feline blood samples no explanation was found for the message code “differential algorithm issues” regarding the separa-tion the monocytes from the neutrophils. In three out of nine canine blood samples and in two out of 12 feline blood samples, the message code“differential algorithm issues” was associated with a left shift. In one feline and one canine blood sample, an increased number of normoblasts was seen (9/100 WBC and 56/100 WBC, respectively) and in one cat suffering from a lymphoma, some atypical cells were found, which might have caused the message code. In the microscopic examination of the 14 feline blood samples with the message code“Possible rate analysis issue,” no hint as to the cause of this message code was found. In 81 out of 113 message codes observed in feline blood samples, the message codes were related to feline platelets (69 Table 3 Age-related changes in measured values observed in two canine blood samples containing 17.08×10³/μl, and 82.59×10³/μl WBC respectively, and in a feline blood sample with a WBC count of 9.26×x103/μl
Age-related change Parameter Percent deviation after 4–6 h of aging Parameters with significant increase
of values (p<0.05)
Canine blood sample; WBC 17.08×10³/μl
Canine blood sample; WBC 82.59×10³/μl
Feline Blood sample; WBC 9.26×10³/μl HGB +4% +9% – MCV +3% +2% – HCT – +9% – RBC – +10% – RETI – +30% – PDW +6% +5% +10% MONO – – +23%
Parameters with significant decrease of values (p<0.05) MPV −20% – – PLT −18% – −60% PCT −30% – – LYM – −8% −30% WBC – – −16%
Table 4 Linearity of the measurement range of blood samples from two dogs with coefficient of correlation, regression line, and the range of the tested parameters
Parameter Coefficient of correlation r Regression line Range tested for linearity Reference range according to the LaserCyte for adult dogs
Intercept a Slope b WBC 0.997 7.11 0.89 2.74– 75.07 ×10³/μl 5.5– 16.9 ×10³/μl LYM 0.943 0.05 0.78 0.16– 1.66 ×10³/μl 0.7– 4.9 ×10³/μl MONO 0.899 0.53 1 0.05– 1.93 ×10³/μl 9.1– 1.4 ×10³/μl NEU 0.997 6.88 1.12 2.39– 70.9 ×10³/μl 2– 12 ×103/μl HCT 0.998 6.07 0.89 1.9– 77.4% 37– 55% RBC 0.997 0.87 0.89 0.25– 11.02 ×10⁶/μl 5.5– 8.5 ×10⁶/μ×l HGB 0.998 0.23 0.83 3.3– 22.3 g/dl 12– 18 g/dl RETI 0.849 7.05 0.90 27.3– 68.6 ×10³/μl None PLT 0.995 −53.33 1.03 131– 950 ×103/μl 175– 500 ×103/μl
“MPVout of reportable range”, 12 “PLT Aggregations”). In the 12 feline samples and one canine sample displaying the message code“PLT Aggregation”, platelets were inspected microscopically. In seven feline blood samples, the message code could be confirmed, while in the six remaining samples, no obvious aggregation was found on the blood smears. One of nine samples flagged with the message code “MCHC out of reportable range”, was hyperlipemic. Three samples marked with the message
code “Too many RBC fragments” could be explained by hemolytic anemia.
Discussion
General feasibility of the LaserCyte
The LaserCyte is the first flow cytometer designed for hematology in private veterinary practice. It is an extremely Fig. 3 Linearity of the
mea-surement range for RBC over a range of 0.25×10⁶–11×106 RBC/μl. X-axis: values measured by LaserCyte; y-axis: RBC values calculated for the respective dilutions, y=0.89x+ 0.87
Table 5 Accuracy of the LaserCyte, determined by comparison of the results with those obtained by reference methods
Parameter Species Sample number n Coefficient of correlation r Intercept a Slope b Significance of differences of methodsa
WBC Dog 116 0.983 0.564 0.926 0.0765
Cat 129 0.944 −0.871 1.084 0.3231
LYM absolute Dog 116 0.798 0.482 0.938 <0.0001
Cat 123 0.769 0.168 0.915 0.1921
MONO absolute Dog 116 0.809 0.401 1.146 <0.0001
Cat 123 0.767 0.210 2.025 <0.0001
NEU absolute Dog 116 0.983 0.206 0.849 <0.0001
Cat 123 0.934 −0.863 1.007 0.0035
EOS absolute Dog 116 0.289 0.171 0.158 <0.0001
Cat 123 0.632 0.251 0.769 <0.0001
BASO absolute Dog 116 0.032 −0.336 31.097 <0.0001
Cat 123 0.084 0.042 1.489 <0.0001 HCT Dog 116 0.960 −1.756 1.036 0.1196 Cat 129 0.944 −1.437 1.120 <0.0001 RBC Dog 116 0.961 0.032 0.978 <0.0001 Cat 129 0.968 0.053 0.986 0.5872 HGB Dog 116 0.962 0.443 0.960 0.0536 Cat 129 0.985 −0.039 1.023 <0.0001
RETI absolute Dog 91 0.360 21.982 −0.240 0.0003
Cat 58 0.128 −179.541 15.612 <0.0001 MCV Dog 116 0.951 4.690 0.941 <0.0001 Cat 129 0.953 1.799 1.041 <0.0001 RDW Dog 116 0.777 8.077 0.503 0.0052 Cat 129 0.754 9.525 0.517 0.9916 MCHC Dog 116 0.094 −638.49 19.605 0.9637 Cat 129 0.276 −158.9 5.638 <0.0001 MCH Dog 116 0.712 −4.009 1.181 0.0866 Cat 129 0.845 −4.050 1.309 <0.0001 PLT Dog 116 0.946 35.202 0.793 <0.0001 Cat 79 0.862 −4.805 1.520 <0.0001
In addition, the significances of the differences of methods were calculated according to the Wilcoxon signed test
a
user-friendly instrument and can be used after approxi-mately 1 h of training. It took approxiapproxi-mately 13 min to analyse one blood sample. (According to the manufacturers information, the current software version should need about 10 min for analyzing a blood sample.) The instru-ment was evaluated over a period of 9 months. Towards the end of the evaluation, one instrument became clogged, requiring the intervention of a technician.
Representation of the measured values
There was a strong association between the left shift of neutrophils in the blood smears and an appearance of a neutrophil population extending to the upper left in the dot plot (12 out of 14 cats with left shift). It was concluded that appearance of this extension to the upper left of neutrophils present in the dot plot is a criterion for a left shift in cats. The same phenomenon can be observed in the dot plots of the CellDyn 3500. In 12 out of 14 feline blood samples of this study, the shift of the neutrophils to the upper left region of the dot plots correlated clearly with a left shift detected microscopically. In 13 feline samples, the LaserCyte detected a shift of the neutrophils to the upper left region of the dot plots; no left shift was seen in the blood smear.
A possible explanation for this discrepancy between the LaserCyte and the microscopic findings could be offered by an increased sensitivity of the LaserCyte to detect immature neutrophils in cats. However, two samples with a microscopically confirmed left shift were not recognized by the LaserCyte. It is suggested that samples with a shift of neutrophils to the upper left region of the dot plot are microscopically checked for the presence of stab neutro-phils. In canine blood samples, there was no correlation between a shift of the neutrophils to the upper left region of the dot plot and the microscopic detection of stab neutrophils. In only two out of 16 samples with
micro-scopically detected stab neutrophils, a shift to the upper left region of the dot plot was observed. In order not to miss left shifts in canine blood samples, it is, therefore, recom-mended to qualitatively evaluate each blood smear by microscopy.
Precision
Usually, CVs within a series of up to 3% are considered good and up to 5% acceptable for cell counts (Bollinger et al. 1987; Winkler et al. 1995; Hofmann-Lehmann et al. 1998). For statistical reasons, CV may be higher if the absolute number of counted cells is small. Good to acceptable precision was achieved for the measurement of the RBC parameters, with the exception of reticulocytes in both species, and platelets in dogs. The precision for reticulocyte counts for the feline blood sample and the canine sample with high WBC was in the range of the microscopy, which was 12.9% (data not shown). The two other canine samples gave very high CVs of up to 102%.
A valid explanation for these unacceptable high CVs cannot be offered. It is speculated that the differentiation between mature red cells and reticulocytes on the basis of different extinction and light scatter caused by ribosomal fragments of the reticulocytes by the LaserCyte is insufficient. For the WBC, the precision of the measure-ments in the canine blood samples with average and high WBC counts was considered good; in the feline and the canine blood samples with low WBC counts, the precision was moderate. The precision of the monocyte and neutro-phil measurements were good in the canine blood sample with average WBC counts; it was moderate in the other blood samples. The CV for lymphocytes of between 7 and 17.9% was in the same range as that of microscopy (16.2%, data not shown).
Lymphocyte precision has been a focal point of algorithm advancements in the software of the LaserCyte. Subsequent software releases may improve the separation of the cell populations. The high CVs for eosinophils and basophils can be explained by the low mean values and cannot be attributed solely to the measurement system. Therefore, the precision of the instrument for the eosinophils and basophils cannot be specified. The relatively high CV of 13.2% found for the measurement of feline platelets can be explained by the fact that feline platelets are relatively large and often have a tendency to form aggregates, which break up over time, resulting in increasing numbers (Norman et al. 2001). However, the high precision of the PDW measurements (CV 2.2–3%) contradicts the general observation that platelets form aggregates; no explanation for this discrepancy can be offered. The precision of the MPV and PCT measurements can be rated as good in dogs with low and normal WBC counts. The higher CV for the MPV and PCT measure-ments in a canine blood sample with leucocytosis (28.2 and 19.8%, respectively) and a feline blood sample (6.1 and 18.2%, respectively) may be explained by the pathologi-cally high variability in platelet size in these two patients. Fig. 4 Method comparison of WBC counts determined by CD 3500
(x-axis) and LaserCyte (y-axis). The linear regression line and coefficient of correlation were calculated according to Passing and Bablock4–6; n=116, r=0.98, y=0.93x+0.56
The advantage of an electronic cell counter over manual differentials is the high number of counted cells. This results in a better statistical distribution and a higher precision of measurements than can be achieved with any microscopic method (Pohland1989).
During the determination of the within-run precision, we observed systematic changes over time for some param-eters (Table 3). To determine whether these systematic changes may be due to the instrument warming, measure-ments were interrupted to let the instrument cool. From the observation that the systematic changes continued, it was concluded that the phenomenon was caused by aging of the samples and not by the instrument warm-up. Although the change over time in absolute values was not very large (with the possible exception of monocytes and platelets in the feline samples) some of these changes were significant.
Similar aging effects were also seen in the reference method CellDyn 3500 (data not shown) and, therefore, cannot be attributed to the LaserCyte. Still, these changes appear to be higher than in another report (Sachse and Henkel 1996), where—in contrast to our study—normal healthy subjects were used for blood collections to be used in an aging study. We, therefore, conclude that especially in ill animals in some of the parameters, an aging effect has to be considered already in the first few hours after collection. In this context, it is important to note that the cat used for the precision study was FeLV infected. FeLV is known to replicate among others in megacaryocytes and leukocytes, which may explain the accelerated loss of these cells during storage.
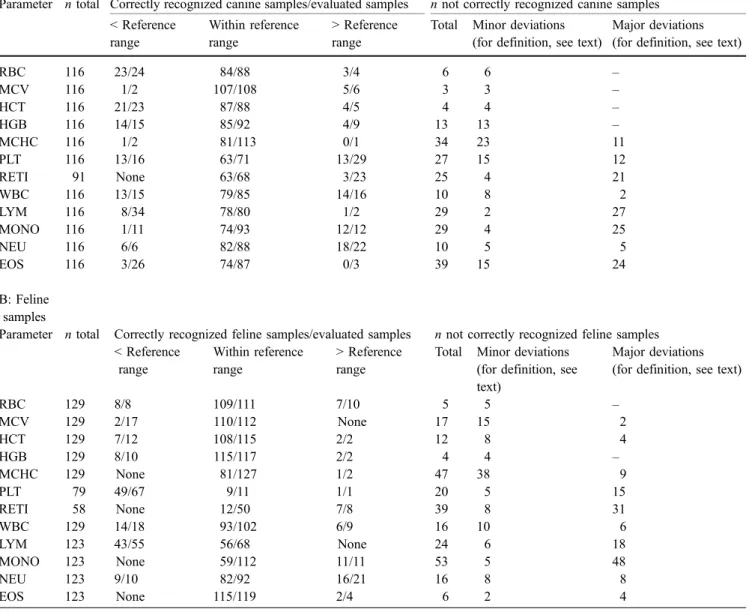
Table 6 A and B: clinical relevance of results obtained by LaserCyte discrepant from those obtained by reference methods A: Canine
samples
Parameter n total Correctly recognized canine samples/evaluated samples n not correctly recognized canine samples < Reference range Within reference range > Reference range
Total Minor deviations (for definition, see text)
Major deviations (for definition, see text)
RBC 116 23/24 84/88 3/4 6 6 – MCV 116 1/2 107/108 5/6 3 3 – HCT 116 21/23 87/88 4/5 4 4 – HGB 116 14/15 85/92 4/9 13 13 – MCHC 116 1/2 81/113 0/1 34 23 11 PLT 116 13/16 63/71 13/29 27 15 12 RETI 91 None 63/68 3/23 25 4 21 WBC 116 13/15 79/85 14/16 10 8 2 LYM 116 8/34 78/80 1/2 29 2 27 MONO 116 1/11 74/93 12/12 29 4 25 NEU 116 6/6 82/88 18/22 10 5 5 EOS 116 3/26 74/87 0/3 39 15 24 B: Feline samples
Parameter n total Correctly recognized feline samples/evaluated samples n not correctly recognized feline samples < Reference range Within reference range > Reference range
Total Minor deviations (for definition, see text)
Major deviations (for definition, see text)
RBC 129 8/8 109/111 7/10 5 5 – MCV 129 2/17 110/112 None 17 15 2 HCT 129 7/12 108/115 2/2 12 8 4 HGB 129 8/10 115/117 2/2 4 4 – MCHC 129 None 81/127 1/2 47 38 9 PLT 79 49/67 9/11 1/1 20 5 15 RETI 58 None 12/50 7/8 39 8 31 WBC 129 14/18 93/102 6/9 16 10 6 LYM 123 43/55 56/68 None 24 6 18 MONO 123 None 59/112 11/11 53 5 48 NEU 123 9/10 82/92 16/21 16 8 8 EOS 123 None 115/119 2/4 6 2 4
Linearity of the measurement range
From the observation that all parameters measured showed no deviation of linearity over the range tested, which was reflected by coefficients of correlation range from 0.849 to 0.998, we concluded that the linearity was excellent. The linearity of basophils and eosinophils measurements was not calculated because of the very low cell counts even in the undiluted blood sample (basophils 0.22×10³/μl and eosinophils 0.39×10³/μl).
Accuracy
The correlation coefficient (r) is a measure of the comparability of measurement methods. Under linear conditions, an r of 1 or−1 reflects total consistency between the results of both methods. An r of >0.95 can be rated as very good and an r of >0.8 as acceptable (Tisdall 1985; Bollinger et al.1987; Tvedten and Wilkins1988; Winkler et al.1995). In addition to the determination of r, the intercept and the slope have to been considered (Tvedten and Korcal 1996). If the intercept and the slope deviate from 0 and 1, respectively, systematic errors have to be suspected.
To characterize the method comparisons in the present study, we have not only evaluated the coefficient of correlation but also the intercept and the slope. In addition, to determine presence of absolute and proportional inaccuracies, difference plots were carried out (Jensen 2000). Good to very good correlation between the LaserCyte results and those of the reference methods could be observed for WBCs, NEU, RBCs, HCT, HGB, and MCV in both species and for platelets in dogs. Acceptable correlation was obtained for lymphocytes and monocytes in dogs and platelets and MCH in cats. The correlation for feline lymphocytes and monocytes was less satisfactory. This was probably attributable to the wide scatter of lymphocyte counts around the regression lines in the presence of only moderate precision.
In ten out of 12 samples, the reference method (manual differential in percent times the optical white cell count) found a lymphocytopenia, which was not readily detected by the LaserCyte. This became especially evident when difference plots were evaluated (data not shown). It was not determined to what degree this discrepancy was caused by the reference methods or the LaserCyte. The numbers of monocytes in both species were generally higher in the LaserCyte. Again, this could be explained by difficulties of Table 7 Message codes set by the LaserCyte during analyses of 137 canine and 176 feline blood samples
Message codes Flagged
samples: 16 out of 137 canine blood samples
Message code confirmed by observation
Flagged samples: 97 out of 176 feline blood samples
Message code confirmed by observation
“Differential algorithm issues: confirm with blood smear”; concerning lymphocytes and monocytes
1 Stab neutrophils (1.5%) 2 0
“Differential algorithm issues: confirm with blood smear”; concerning mono-cytes and neutrophils
9 2 samples with stab neutrophils (16.5%, 1%) 1 sample with stab neutrophils (4%) and normo-blasts (56/100 WBC) 6 normal blood samples
12 2 blood samples with stab
neutrophils (7%, 25.5%), 1 blood sample with normoblasts (9/100 WBC), 1 blood sample with atypical cells (lymphoma), 8 nor-mal blood samples.
“Possible rate analysis issue: confirm differential with blood smear and WBC”
0 14 14 normal blood samples
“MPV out of reportable range” 1 Not evaluated 69 Not evaluated
“Too many RBC fragments; confirm PLT value with blood smear”
3 Haemolytic blood samples 0
“MCHC out of reportable range”
5 1 lipaemic blood samples, 4 nor-mal blood samples
4 4 normal blood samples “PLT aggregation: confirm
differential with blood smear”
1 Normal blood sample 12 7 blood samples with confirmed
PLT aggregates, 5 normal blood samples
“Internal QA failure; qualiBeads not recovered”
the instrument to gate monocytes clearly from the other white blood cells, or by the fact that white blood cells, especially monocytes, are not evenly distributed on blood smears (Tvedten and Wilkins1988).
In the presence of good to very good precision, the fact that the correlation for RDW and MCHC in both species and MCH in dogs was only moderate is attributable to the narrow biological range of scatter associated with these parameters (cloud phenomenon). In addition to the cloud phenomenon, the distribution plots of canine MCHC revealed a slight systematic underestimation of MCHC of the LaserCyte in the lower range and an overestimation of the values in the higher ranges. It was not determined to what degree the two methods contributed to this discrep-ancy. The correlation was poor for eosinophils, basophils, and reticulocytes. In case of eosinophils and basophils, the insufficient accuracy can be explained by a low precision of both methods and the lack of a sufficient number of samples with significant counts of these cell types.
No explanation can be offered for the low correlation of the LaserCyte with the reference methods for the reticu-locytes. Of the 12 outliers, nine could be explained by a discrepancy between the LaserCyte and the reference method concerning the differential, suggesting that the outlier is explained by the uneven distribution on the smear or the low cell counts. One of the outliers regarding the reticulocytes was explained by the presence of a high number of normoblasts (60/100 WBCs). This outlier was evident from the dot plots showing an overlap of reticu-locytes and RBC. No explanation could be offered for the two outliers that concerned the hematocrit.
Message codes
Message codes are displayed when the LaserCyte’s system for quality assurance is not able to verify the results of a particular parameter. The message code“differential algo-rithm issues” and “possible rate analysis issue” are displayed when there are difficulties assigning the leuko-cytes to the respective populations or when a large number of WBCs decompose during the analysis process. In four out of ten canine blood samples and in four out of 28 feline blood samples, a left shift of the neutrophils or an increased number of normoblasts might have been the reason for these message codes. In order not to miss these clinically important parameters, we recommend to confirm the WBC differential with a blood smear under the microscope. In some cases, platelet aggregates, which occur frequently in cats for biological reasons (Norman et al. 2001), are difficult to distinguish from WBC populations. Occurrence of possible platelet aggregates is indicated by the LaserCyte with the message code “platelet aggregation”. The aggregates could be confirmed by microscopy in seven out of 13 flagged samples. One canine and 69 feline samples had a message code regarding the MPV. These results could not be further evaluated as the CellDyn 3500 usually does not yield MPV values for feline and canine samples. The MPV results outside the 2–30 fl range and
MCHC results outside the 24.5–39.5 g/dl range are flagged with the messages “MPV out of reportable range” or “MCHC out of reportable range”, respectively.
In the presence of fragile RBCs, the message“too many RBC fragments” indicates that fragile RBCs may interfere with the platelet count. The samples flagged by this message originated from canine hemolytic blood samples. If the message “too many RBC fragments” is set by the instrument, it is recommended to estimate the platelet and the erythrocyte counts on a blood smear. The message “internal QA failure”, which appeared three times during the study, indicates inadequate detection of the latex beads. This means that the internal quality control is not assured and the analysis must be repeated. Other message codes not discussed in this paper may also be displayed. The instrument also informs the user of the measures to be taken when these message codes show up.
Evaluation of the clinical relevance of results obtained by LaserCyte:
The vast majority of all results obtained by the LaserCyte would have led to the same clinical interpretation as the results obtained by the reference methods. In the following parameters, the discrepancy between the results of the LaserCyte and the reference methods were minor and would not have led to different clinical conclusions: RBC, MCV, HCT, and HGB in both species. In WBC and NEU in 18 out of 28 and 13 out of 26 blood samples, respectively, the discrepancy would have led to different clinical consequences. In addition, ten of 11 canine samples with low monocyte counts were not detected by the LaserCytes. This, however, was of no clinical relevance and could be explained by lack of detection of low monocyte counts in the blood smear. There were three parameters where the LaserCyte values were in serious discrepancy with the results of the reference methods: lymphocytes and reticu-locytes of both species and platelets in cats. The LaserCyte did not detect 26 of 34 canine samples with lymphocyto-penia, and 20 of 23 dogs with increased reticulocyte counts. In the cat, 12 of 55 lymphocytopenias were not detected. In the reticulocytes, 12 of 50 feline samples that were within the reference range by the reference method had increased reticulocyte counts by LaserCytes. In feline samples with low platelet counts, the LaserCyte would have missed 18 of 67 thrombocytopenias.
Thus, as a consequence of the analysis of the clinical relevance, it became evident that the LaserCyte has some weaknesses in detecting lymphocytopenia in dogs and cats, thrombocytopenias in some of the cats, and is unable to correctly judge increased numbers of reticulocytes in the dog and normal reticulocyte counts in the cat. These problems could be solved by the determination of reference values for dogs and cats by the LaserCyte and/or by adapting the software that processes the signals created by each cell to have a clearer separation between the different cell populations.
Conclusion
The instrument is very suitable for use in private veterinary practice. With the LaserCyte, the results of hematological analysis are obtained with little effort within 13 min. Results for WBC, NEU, RBC, HCT, HGB, and MCV in both animal species and platelet measurements in dogs are obtained with a high degree of reliability. According to the evaluation of the clinical relevance of results obtained by the LaserCyte, the user has to be aware of the possibility to miss lymphocytopenias in both species, reticulocytosis in dogs and—despite the noteworthy good correlation for the automated feline platelet counts—thrombocytopenias in cats. In cases where no clear evaluation is possible, this is indicated by appropriate message codes. The dot plot evidence of a left shift in cats is also very useful. In the dot plots of canine blood samples, however, left shifts cannot be identified. The ability to recognize abnormal cell morphologies and blood cell precursors is limited with all types of automatic cell counting. To recognize blood samples with such abnormalities, evaluation of all the samples qualitatively by microscopy, in addition to measurement by the instrument, is suggested.
Acknowledgements We thank the technicians of the Clinical Laboratory, Vetsuisse Faculty, University of Zurich, and Yvonne Sigrist for excellent support throughout the project. Thanks are also due to our colleagues in the clinics for providing the blood samples, and to Brigitte Egg and Richard Andrews for technical support. Regina Hofmann-Lehmann is the recipient of a professorship by the Swiss National Science Foundation (PP00B-102866). Sources of funding: IDEXX Laboratories, 1 IDEXX Drive, Westbrook, Maine 04092, U.S.A.
References
Altman DG (1994) Practical statistic for medical research. Chapman & Hall, London, UK
Bablok W, Passing H (1985) Application of statistical procedures in analytical instrument testing. J Clin Lab Autom 7:74–79 Bablok W, Passing H, Bender R, Schneider B (1988) A general
regression procedure for method transformation. Application of linear regression procedures for method comparison studies in clinical chemistry, Part III. J Clin Chem Clin Biochem 26: 783–790
Bienzle D, Stanton JB, Embry JM, Bush SE, Mahaffey EA (2000) Evaluation of an in-house centrifugal hematology analyzer for use in veterinary practice. J Am Vet Med Assoc 217: 1195–1200
Bollinger PB, Drewinko B, Brailas CD, Smeeton NA, Trujillo JM (1987) The technicon H*1—an automated hematology analyzer for today and tomorrow. Am J Clin Pathol 87:71–78
Eisenwiener HG, Bablok W, Bardorff W, Bender R, Markowetz D, Passing H, Spaethe R, Specht W, Völkert E (1984) Statistische Auswertung beim Methodenvergleich. Lab Med 8:232–244
Feldman BV, Zinkl JG, Jain NC (2000) Schalm’s veterinary hematology. Lippincott Williams & Wilkins, Philadelphia, PA, pp 1058–1065
Fulwyler MJ (1980) Flow cytometry and cell sorting. Blood Cells 6:173–184
Hofmann-Lehmann R, Wegmann D, Winkler G, Lutz H (1998) Evaluation of the QBC-vet autoread hematology system for domestic and pet animal species. Comp Haematol Int 8: 108–116
Jensen AL (2000) Validation of diagnostic tests in hematology laboratories. Lippincott Williams & Wilkins, Philadelphia, PA Kieffer J, Winkler G, Van Hove L, Walsh A, Thomann P, Wyss S,
Eggenberger E, Lutz H (1999) Evaluation of the CELL-DYN 3500 hematology instrument for the analysis of the mouse and rat blood. Comp Haematol Int 9:92–106
Knoll JS, Rowell SL (1996) Clinical hematology: in-clinic analysis, quality control, reference values, and system selection. Vet Clin North Am Small Anim Pract 26:981–1002
Norman EJ, Barron RCJ, N Andrew S, Clampitt RB (2001) Prevalence of low automated platelet counts in cats: compar-ison with prevalence of thrombocytopenia based on blood smear estimation. Vet Clin Pathol 30:137–140
Passing H, Bablok W (1983) A new biometrical procedure for testing the equality of measurements from two different analytical methods. Application of linear regression procedures for method comparison studies in clinical chemistry, Part I. J Clin Chem Clin Biochem 21:709–720
Passing H, Bablok W (1984) Comparison of several regression procedures for method comparison studies and determination of sample sizes. Application of linear regression procedures for method comparison studies in clinical chemistry, Part II. J Clin Chem Clin Biochem 22:431–445
Passing H, Bablok W, Glocke M (1981) An optimized design for the establishment of assigned values in control sera. The establish-ment of assigned values in control sera, IV. J Clin Chem Clin Biochem 19:1167–1179
Perkins PC, Grindem CB, Cullins LD (1995) Flow cytometric analysis of punctate and aggregate reticulocyte responses in phlebotomized cats. Am J Vet Res 56:1564–1569
Petrie A, Watson P (1999) Statistics for veterinary and animal science. Blackwell, Oxford, UK
Pohland D (1989) Evaluation of the automated hematology analyser sysmex M-2000. J Clin Chem Clin Biochem 27:41–47 Sachse C, Henkel E (1996) An evaluation of the CELL-DYN 1700
hematology analyser: automated cell counting and three-part leukocyte differentiation. Clin Lab Haematol 18:171–180 Tisdall PA (1985) Evaluation of a laser-based three-part leukocyte
differential analyzer in detection of clinical abnormalities. Lab Med 16:228–233
Tvedten H, Korcal D (1996) Automated differential leukocyte count in horses, cattle, and cats using the technicon H-1E hematology system. Vet Clin Pathol 25:14–22
Tvedten HW, Wilkins RJ (1988) Automated blood cell counting systems: a comparison of the Coulter S-Plus IV, Ortho ELT-8/ DS, Ortho ELT-8/WS, Technicon H-1, and Sysmex E-5,000. Vet Clin Pathol 17:47–54
Winkler GC, Engeli E, Rogg E, Kieffer J, Kellenberger H, Lutz H (1995) Evaluation of the Contraves AL 820 automated hematology analyser for domestic, pet and laboratory animals. Comp Haematol Int 5:130–139