HAL Id: hal-02921207
https://hal.archives-ouvertes.fr/hal-02921207
Submitted on 25 Aug 2020
HAL is a multi-disciplinary open access
archive for the deposit and dissemination of
sci-entific research documents, whether they are
pub-lished or not. The documents may come from
teaching and research institutions in France or
abroad, or from public or private research centers.
L’archive ouverte pluridisciplinaire HAL, est
destinée au dépôt et à la diffusion de documents
scientifiques de niveau recherche, publiés ou non,
émanant des établissements d’enseignement et de
recherche français ou étrangers, des laboratoires
publics ou privés.
Mesoscale Eddies Structure Mesopelagic Communities
Alice Della Penna, Peter Gaube
To cite this version:
Alice Della Penna, Peter Gaube. Mesoscale Eddies Structure Mesopelagic Communities. Frontiers in
Marine Science, Frontiers Media, 2020, 7, pp.454. �10.3389/fmars.2020.00454�. �hal-02921207�
Edited by: Cosimo Solidoro, Istituto Nazionale di Oceanografia e di Geofisica Sperimentale (OGS), Italy Reviewed by: Jean-Noel Druon, Joint Research Centre, Belgium Geir Huse, Norwegian Institute of Marine Research (IMR), Norway *Correspondence: Alice Della Penna alice.dellapenna@gmail.com
Specialty section: This article was submitted to Marine Ecosystem Ecology, a section of the journal Frontiers in Marine Science Received: 16 October 2019 Accepted: 22 May 2020 Published: 08 July 2020 Citation: Della Penna A and Gaube P (2020) Mesoscale Eddies Structure Mesopelagic Communities. Front. Mar. Sci. 7:454. doi: 10.3389/fmars.2020.00454
Mesoscale Eddies Structure
Mesopelagic Communities
Alice Della Penna1,2* and Peter Gaube1
1Applied Physics Laboratory, University of Washington, Air-Sea Interaction and Remote Sensing Department, Seattle, WA,
United States,2Laboratoire des Sciences de l’Environnement Marin (LEMAR), UMR 6539 CNRS-Ifremer-IRD-UBO-Institut
Universitaire Européen de la Mer (IUEM), Plouzané, France
Mesoscale eddies play a key role in structuring open ocean ecosystems, affecting the entire trophic web from primary producers to large pelagic predators including sharks and elephant seals. Recent advances in the tracking of pelagic predators have revealed that these animals forage in the mesopelagic and the depth and duration of their foraging dives are affected by the presence of eddies. The ways in which eddies impact the distribution of mesopelagic micronekton, however, remain largely unknown. During a multi-seasonal experiment we used a shipboard scientific echosounder transmitting at 38 kHz to observe the distribution of acoustic backscattering in the energetic mesoscale eddy field of the northwestern Atlantic. Observations were collected at 24 stations with 6 located in anticyclonic and 7 in cyclonic eddies. The sampled anticyclonic eddies are characterized by intense acoustic backscattering in the mesopelagic and changes in the intensity of acoustic backscattering layers match gradients of surface properties. Furthermore, mesopelagic daytime backscattering is positively correlated with sea level anomaly. These results suggest that anticyclonic eddies in the northwestern Atlantic impact the distribution of mesopelagic micronekton and may have the potential to locally enhance or structure spatially mesopelagic communities.
Keywords: NAAMES, North Atlantic Aerosols and Ecosystems Study, micronekton, mesoscale, eddies, echosounder, bioacoustics, intermediate trophic levels
1. INTRODUCTION
Mesoscale eddies affect primary production by modulating and structuring phytoplankton biomass, phenology, community composition, and diversity (Bracco et al., 2000; d’Ovidio et al., 2010; Mahadevan et al., 2012; Gaube et al., 2014; McGillicuddy, 2016). At the other end of the trophic web, a growing number of satellite-based animal trajectories suggests that mesoscale eddies are foraging hotspots for marine predators including sharks, sea turtles, marine mammals, and seabirds (Cotté et al., 2007; Cotté et al., 2015; Bailleul et al., 2010; Tew Kai and Marsac, 2010; Woodworth et al., 2012; d’Ovidio et al., 2013; Della Penna et al., 2015; Gaube et al., 2017, 2018a).
Mesoscale eddies are generated via a number of different mechanisms. In the open ocean, for example, baroclinic instability, topography effects, and adjustments of the fronts associated with strong currents (e.g., western boundary currents) can all spawn long-lived mesoscale eddies (Robinson, 2012). The northwest Atlantic is characterized by large amplitude eddies with some originating from the unstable meanders of the Gulf Stream and others by baroclinic instabilities in the open ocean. Eddies in this region can be expected to be present at any given location up to 80% of the time, as can occur along the northward extension of the Gulf Stream, while much of the region has a percent coverage range of 30–40%.
Della Penna and Gaube Eddies Structure DSL
Almost all of the eddies in the mid-to-high latitudes are characterized by swirl velocities that exceed their propagation rates (Chelton et al., 2011a). During their formation, these non-linear eddies trap water masses within their cores that may then be transported thousands of kilometers (Flierl, 1981; Chelton et al., 2011a; Early et al., 2011). In addition to the effect eddies have on advective transport, eddy formation drives vertical fluxes of nutrients and phytoplankton that can modulate the penetration of light into the mesopelagic (for a review of mesoscale physical/biological interactions, see
McGillicuddy, 2016).
These mechanisms introduce a source of variability for physical and biogeochemical tracers that can be readily identified in satellite observations of ocean color and sea surface temperature (with cyclones and anticyclones often associated with cool and warm temperature anomalies, respectively). The ocean color signatures of cyclonic eddies in the northwest Atlantic are generally characterized by enhanced levels of near-surface chlorophyll-a (Garçon et al., 2001; Gaube et al., 2014; Gaube and McGillicuddy, 2017). Enhanced chlorophyll-a (Chl-chlorophyll-a) in cyclones likely originchlorophyll-ates during eddy formchlorophyll-ation with the trapping of productive waters and can be sustained by the upwelling generated during their intensification. In contrast, anticyclonic eddies in this region contain, on average, anomalously low Chl-a, which in much of the region is consistent with the trapping of water with low Chl-a during eddy formation (Gaube et al., 2014).
The study of how mesoscale eddies structure higher trophic levels is beginning to make significant progress as a result of the combination of satellite animal telemetry with satellite observation of sea surface height. For example, the tracking of large pelagic animals including sea turtles and sharks in the Atlantic has revealed that these animals are more likely to occupy anticyclones compared to cyclones (Gaube et al., 2017, 2018a; Braun et al., 2019; Chambault et al., 2019). Relatively few studies, however, have focused on the effect of mesoscale features on intermediate trophic levels including micronekton: organisms such as crustaceans, small cephalopods, and small fish (e.g., myctophids, hatchetfish, and the abundant bristlemouth fish). These animals constitute a key intermediate trophic level between plankton and top predators (Irigoien et al., 2014) yet are too small to be tagged and tracked and are also not currently observable using space-borne sensors. These intermediate trophic levels can only be sampled directly using net trawls (which have been shown to be affected by net-avoidance of the fastest organisms,
Kaartvedt et al., 2012), or remotely using active acoustics (Wiebe et al., 1985; Greene and Wiebe, 1990), or, more generally, a combinations of the two (Ryan et al., 2009). In addition to this challenge, micronekton sampling strategies have to take account of the diel vertical migration performed by many micronekton species (Kloser et al., 2009). Only in recent years has the amount of data grown to a level allowing the delineation of basin scale biogeographies of mesopelagic micronekton (Irigoien et al., 2014; Bianchi and Mislan, 2016; Proud et al., 2017).
Mesoscale eddies can impact the distribution of mesopelagic micronekton in several ways. Eddies can enhance primary production or trap productive waters creating regions that may
have positive effects on mesopelagic micronekton communities. In addition, the displacement of isopycnals and the trapping of colder/warmer waters may support different communities compared to the surrounding waters. Finally, we cannot exclude that mesopelagic micronekton may be “trapped” inside the core of eddies during the eddy formation stage. Mesoscale eddies can trap and transport water parcels within their cores. Motile organisms, such as fish and squid, can escape the trapped cores of nonlinear eddies, crossing the eddy periphery and moving to a different water mass. While the movement properties of individual mesopelagic organisms are poorly understood, patterns in diel vertical migration suggest that their maximum speed is of the order of 0.1 m/s, which is at least an order of magnitude slower than the typical currents at the peripheries of mesoscale eddies (Chelton et al., 2011a; Bianchi and Mislan, 2016). These relatively slow swimming speeds coupled with eddy surface areas exceeding 20, 000 km2can suggest that active escape by micronekton likely has a small effect on the trapping of mesopelagic communities in eddy cores.
Basin scale studies have identified a positive relationship between primary production at the ocean surface and acoustic backscattering in the mesopelagic (Irigoien et al., 2014; Proud et al., 2017), yet their relationship at the (sub)mesoscale (spatial variability with scales of order 1–100 km) remains a mystery. Midwater trawls and acoustic sampling of a Gulf Stream warm core ring have suggested that eddies can present differences in biomass of micronekton and deep scattering layers and their temporal evolution compared to the surrounding waters (Boyd et al., 1986; Conte et al., 1986; Craddock et al., 1992). More recently Godø et al. (2012) used acoustic backscattering to survey mesoscale eddies in the northeast Atlantic, concluding that they can act as “oases” for micronekton. Other research in the Mozambique channel suggests a more complex relationship where seasonal variability and eddy polarity (i.e., whether an eddy is cyclonic or anticyclonic) may modulate the impact of mesoscale eddies on micronekton (Béhagle et al., 2014; Potier et al., 2014).
Here we analyze the vertical structure of acoustic backscattering inside a number of North Atlantic mesoscale eddies and regions outside the direct influence of eddies to evaluate whether mesoscale eddies have an impact on the distribution of micronekton and if eddies with different polarities present differences in acoustic backscattering.
2. DATA AND METHODS
2.1. Sampling Strategy
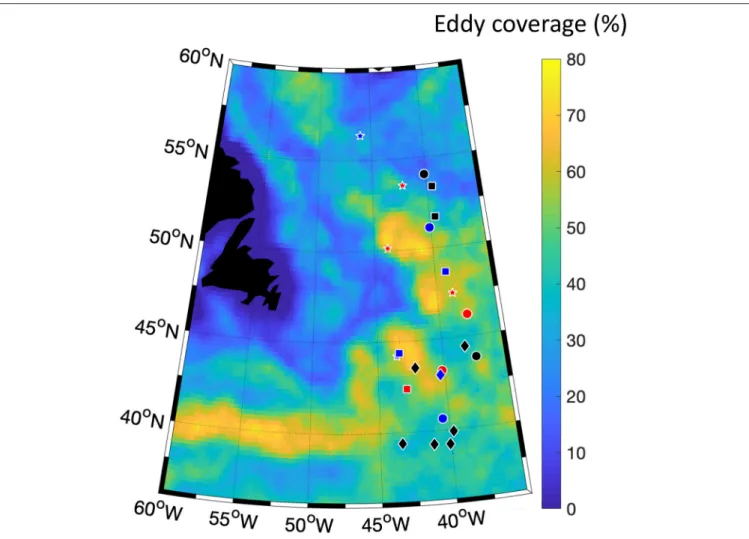
The observations used in this study were collected during the four North Atlantic Aerosols and Ecosystems Study (NAAMES) expeditions in November 2015, May 2016, September 2017, and March 2018 on board of the R/V Atlantis (Behrenfeld et al., 2019). Table S1 summarizes the eddy properties of the different stations where the data were collected. From a total of 33 stations sampled during the four expeditions, we were able to perform acoustic measurements in 24: one was located within an intra-thermocline mode-water eddy, 6 within anticyclonic features, 7 within cyclones, and 10 outside of eddies (Figure 1,Della Penna
FIGURE 1 | Eddy coverage of the study area between the years 1993 and 2015. The eddy coverage was calculated as the number of days when each 1/4◦pixel was occupied by a mesoscale eddy (defined as closed contour of Sea Level Anomaly) divided by the total number of days during the years 1993–2015. Red and blue dots indicate the locations of anticyclonic and cyclonic eddies, respectively, and black dots to the out-of-eddies sampling. Different symbols refer to different surveys: circles refer to November 2015, stars to May 2016, squares to September 2017, and diamonds to March 2018.
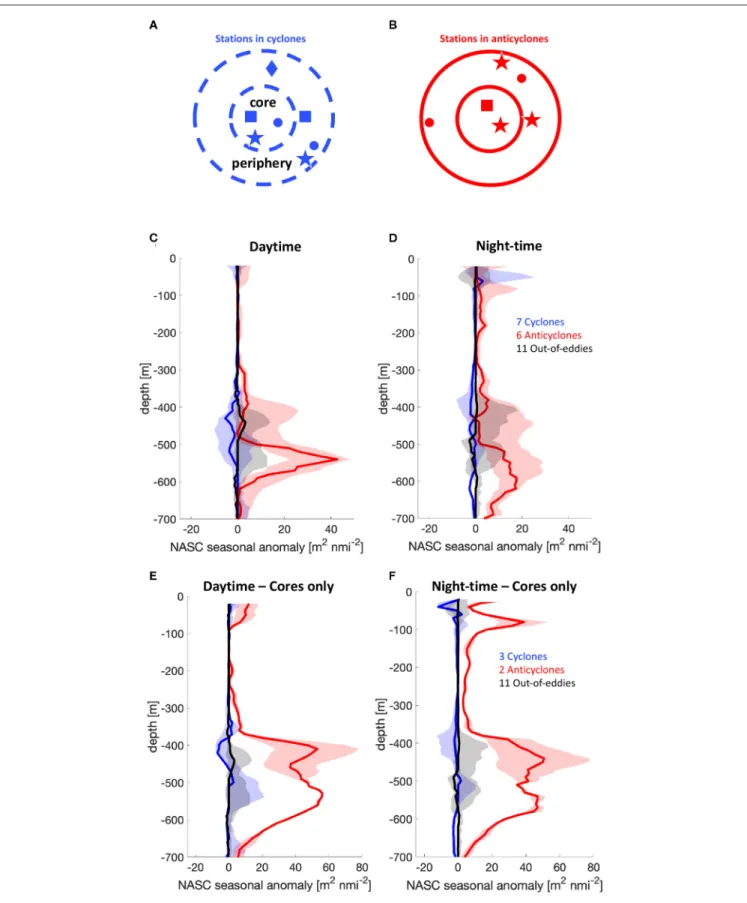
and Gaube, 2019). In total, we collected more than 650 h of acoustic data: ∼ 410 h during the night and ∼ 240 during the day. We excluded the observations collected in the intra-thermocline mode-water eddy as we expect its dynamics to be different from the ones of ordinary anticyclones. As detailed in the results, during one of the long duration stations, N2S4, we sampled waters from inside an eddy core, at its periphery and outside of the eddy. To take into account this variability, we separated the observations collected at N2S4 into “core” and “periphery” of an anticyclone and “out-of-eddies.” After this processing our samples consist of observations from 7 cyclonic eddies, 6 anticyclones, and 11 out-of-eddies stations (Figures 2A,B).
2.2. Acoustic Measurements and Data
Processing
Acoustic data were collected using a Biosonics single-beam scientific echosounder transmitting at 38 kHz. The transducer was mounted at the end of a steel pole affixed to the side of the R/V Atlantis during NAAMES 1, 2, 3 and in a transducer
well in the hull of the R/V Atlantis during NAAMES 4. The transducer was not calibrated in situ: calibrations were performed by the manufacturer before NAAMES 1, 2, and 3. While having uncalibrated data would be problematic if we were trying to estimate fish biomass, our analysis of anomalies in backscatter is not affected by this issue. Furthermore, we opted for comparing seasonal anomalies of acoustic backscattering to remove any effect caused by inter-annual, seasonal variability and transducer location. Pulse length and pinging period were of 2 and 0.2 ms, respectively during NAAMES 2, 3, and 4 and were adjusted according to different conditions during NAAMES 1. Data were collected using the Biosonics DT-X system and converted and analyzed using a set of custom-written Matlab/Octave scripts. First, the time-dependent range and volume backscattering, Sv, were calculated from 10-pings medians and corrected for the time-varying soundspeeds estimated using temperature and salinity measured at the surface using the shipboard thermosalinograph. Second, we followed the method described byDe Robertis and Higginbottom (2007)
Della Penna and Gaube Eddies Structure DSL
FIGURE 2 | Schematic of the sampled eddies and the location of the sampling in respect to the estimated location of the cores of cyclones (A) and anticyclones (B). Daytime (C) and night-time (D) NASC seasonal median anomalies (lines) for cyclones (blue, referring to the stations inside the outer dashed circle in A), anticyclones (red, referring to the stations inside the outer solid circle in B) and out-of-eddy (black) stations. Colored bands indicate the respective 15th and 85th percentiles divided by the square root of the number of observations. (E,F) The same diagnostics we calculated using only the locations inside eddy cores (i.e., inside the inner circles in A,B).
to quantify and mitigate background noise and the methods described by Ryan et al. (2015) to filter out the majority of impulsive and transient noise, as well as signal attenuation due to surface bubbles. Finally, echograms were visually inspected and the pings corresponding to unrealistic patterns were flagged. Data from the top 15 m were excluded to remove the effect of the bubbles created by breaking waves. Data deeper than 700 m were flagged because of low signal to noise ratio. The processed data can be found on SeaBASS at the URL https://seabass.gsfc.nasa.gov/archive/UWASH/gaube/NAAMES/.
2.3. Discrete Net Samples of Deep
Scattering Layers
During the last three NAAMES expeditions, an Isaacs-Kidd Midwater Trawl (IKMT) (Devereux and Winsett, 1953) was towed in the deep scattering layers at each station to qualitatively describe the composition of these layers. The mesh size for the net was 3.2 mm and the net was closed by a cod-end with mesh size of 0.2 mm. Details about the trawling conducted at each station (e.g., target depth, ship velocity, etc.) and the respective data sheets can be found in the Supplementary Material.
2.4. Satellite Altimetry
The location, polarity, and amplitude of the various sampled eddies were determined from maps of high-pass filtered sea level anomaly (SLA) following the methods detailed inDella Penna and Gaube (2019). Altimetry maps were downloaded from the Copernicus Marine Service Information (CMEMS). We calculated the high-pass filtered SLA as the difference between the daily SLA fields provided by CMEMS and a smoothed SLA that captures the effects of seasonal heating and cooling followingChelton et al. (2011b). The sign of each encountered SLA feature was used to classify it as a cyclone, anticyclone, or “out-of-eddy” station–i.e., a location outside of the direct influence of eddies. A combination of in situ observations from the shipboard thermosalinograph and Acoustic Doppler Current Profiler (ADCP) was used to discriminate between eddy peripheries and cores. In most cases, the structure of the velocities detected using the shipboard ADCP were in close agreement with the geostrophic velocity field detected using altimetry. We therefore associated each feature with the high-pass filtered SLA extracted along the ship track at times corresponding to the echosounder observations. An exception was found at station N2S3 where the trajectories of the drifters deployed indicate that this station was located at the periphery of an anticyclonic eddy yet the corresponding extracted high-pass filtered SLA values were negative. This suggests that the relatively coarse spatial resolution of altimetry (nominally 1/4◦) resulted in a mismatch in this specific case. We excluded this station from our analysis of high-pass filtered SLA and backscattering. The eddy properties of each sampled station are summarized in Table S1.
2.5. Continuous Measurements of
Temperature and Salinity
Continuous measurements of temperature and salinity were carried out using a thermosalinograph connected to a flow-through system that collected water at a depth
of 5 m. Measurements of temperature and salinity were used to estimate water density using the SeaWater package (Fofonoff and Millard, 1983).
2.6. Statistical Analyses
For each station, we separated data collected during the day from those collected at night and computed the median profiles of Svand Nautical Area Scattering Coefficient (NASC,MacLennan
et al., 2002) calculated for each 10 m depth bin. Our early analysis indicated that mean backscattering varied with season, regardless of eddy polarity. To address this unrelated variability we computed seasonal medians and seasonal anomalies of NASC for each station and for each depth bin by subtracting the appropriate seasonal median from each station’s median. Looking at anomalies instead of absolute values (shown in
Figure S1) would also remove any inter-annual and inter-survey sources of variability. To compare the mesopelagic backscattering (defined here as backscattering reflected by sources between 200 and 700 m) in cyclones and anticyclones with the “out-of-eddies” stations, we grouped the anomalies and used them to compute the medians of daytime and nighttime seasonal anomalies of NASC by polarity.
We used the Wilcoxon rank-sum test to evaluate whether the differences observed between mesopelagic backscattering for different polarities are due to the finiteness of the number of observations (Wilcoxon, 1945). The test was performed by pooling together all the median seasonal anomalies within the mesopelagic depths and testing if observations from anticyclones and cyclones, anticyclones and “out-of-eddies,” and cyclones and “out-of-eddies” stations, belonged to the same populations. This approach was chosen because it is based solely on the order in which the observations from the samples fall, is robust for limited sample sizes, and does not require making assumptions regarding the distributions followed by the observations.
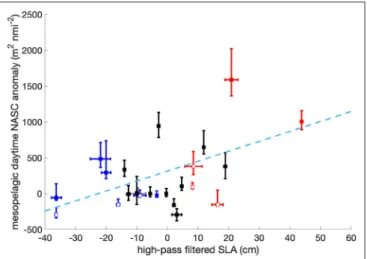
To compare the high-pass filtered SLA amplitude of the eddies to their mesopelagic backscattering anomalies, we computed the least squares fit between scattering anomalies and high-pass filtered SLA and calculated the Pearson’s correlation coefficient. For this specific analysis, we excluded an anticyclonic eddy sampled during NAAMES 2 (N2S3, marked in gray in
Figure 3) because the corresponding signature extracted from the altimetry map was likely to be affected by a spatial shift, as described above.
3. RESULTS
Measurements of acoustic backscattering revealed that mesopelagic micronekton at the sampled stations was distributed in deep scattering layers whose composition was investigated using a IKMT. Most of the samples were dominated by myctophids species such as Benthosema glaciale, Diogenichthys Atlanticus, and Myctophum punctuatum and bristlemouths (from the genus Cyclothone). Hatchetfish (Argyropelecus hemigymnus) and different species of Euphasiids were also observed (as detailed in the
Della Penna and Gaube Eddies Structure DSL
FIGURE 3 | Relationship between high-pass filtered SLA and mesopelagic daytime NASC seasonal anomaly. Blue dots represent sampling locations within the core or the periphery of cyclonic eddies, red dots represent locations within the core or the periphery of anticyclonic eddies, black dots represent out-of-eddy stations and the gray dot refers to N2S3 (SLA ∼ −10 cm), excluded from this analysis. Empty dots indicate stations at eddy peripheries whereas filled dots indicate stations within eddy cores. Errorbars refer to the standard deviation of the SLA extracted for the locations of the acoustic sampling and to the propagated uncertainty from the 15 to 85 quantiles for the NASC anomaly. The dashed line represents the linear relationship fitting the eddy stations (R2
= 0.37, p-value = 0.03).
On average, our surveys revealed that the median NASC seasonal anomaly in anticyclones is larger than in cyclones and out-of-eddies stations (Figures 2C,D). This trend is particularly evident in the mesopelagic where both night and daytime NASC are significantly higher. A Wilcoxon rank-sum test performed over the NASC values measured in the mesopelagic is compatible with the scenario that our observation of stronger backscattering in anticyclones is not due to the finiteness of the number of observations. Also the differences between out-of-eddies stations and cyclonic eddies are, even if of smaller magnitude, not due to the finiteness of our sample size. Furthermore, high-pass filtered SLA, a combination of the eddy amplitude, an indicator of how strong the eddy signature is in sea surface height, and the position of the observation in respect to the center of the eddy, correlates positively with the integrated mesopelagic daytime NASC seasonal anomaly (Figure 3, R2
= 0.37, p − value = 0.03 for “in-eddy” stations).
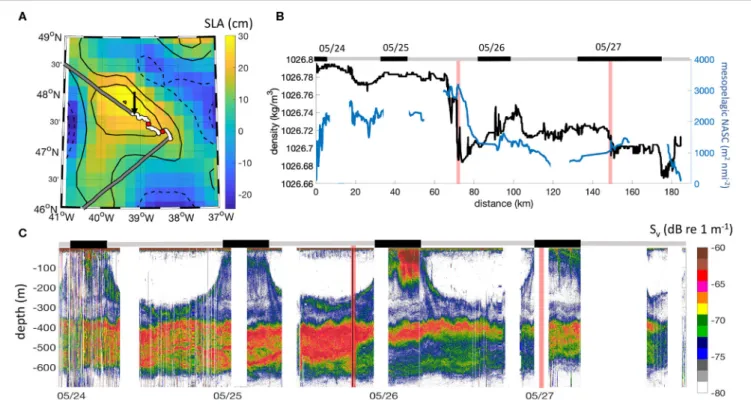
Mesopelagic acoustic backscattering in anticyclones appears to be particularly intense inside their cores (Figures 2E,F). The observations of mesopelagic acoustic backscattering collected at the peripheries of anticyclones, on the other hand, are indistinguishable from the ones from stations outside of the direct influence of mesoscale eddies (Figure S2). This radial pattern was further observed during a long occupation station (NAAMES 2–Station 4, N2S4) where the R/V Atlantis radially transected the core and periphery of an anticyclonic eddy (Figure 4A). Gradients in density (used here to delineate eddy regions) are collocated in time with sharp differences in the distribution of acoustic
backscattering in the mesopelagic (Figures 4B,C, with transitions indicated by red vertical lines). The most striking transition occurs as the ship leaves the eddy core and enters into the eddy periphery, which occurs around 70 km of the transect (Figure 4B) and is marked by a drastic reduction in mesopelagic backscattering and an increase near-surface acoustic backscattering (Figure 4C).
4. DISCUSSION AND CONCLUSIONS
Our results indicate that, in the northwest Atlantic, mesoscale features impact the distribution of acoustic backscattering in the mesopelagic zone. In particular, we find that anticyclonic eddies are characterized by intense acoustic backscattering. This result is consistent with the results presented by Godø et al. (2012)who found that four anticyclones in the Icelandic Basin (northeast Atlantic) were characterized by intense acoustic backscattering. Our findings are also consistent with those of Fennell and Rose (2015) who found that NASC densities in the deep scattering layer and average SLA were positively correlated on a yearly basis across transects from Ireland to the Grand Banks of Newfoundland. Our results suggest that the cores of anticyclones are regions of intense mesopelagic acoustic backscattering. Furthermore, our results indicate that the structure of mesopelagic backscattering is modulated by the in-eddy variability. This was highlighted by our radial transect across an anticyclone which revealed a sharp transition between the eddy core and its periphery (Figure 4).
Mesopelagic acoustic backscattering at 38 kHz is dominated by micronekton: a diverse and relatively unknown ensemble of small (2–10 cm), but actively swimming fishes, squids, and crustaceans (Benoit-Bird and Lawson, 2016). The species observed using the midwater trawl during NAAMES 2, 3, and 4 are consistent with those observed during the WHOI midwater program (Judkins and Haedrich, 2018). Measurements made using a single frequency, single beam echosounder do not allow for the identification of the species or groups that are scattering. The intensity of acoustic backscattering by fish is determined, in part, by the presence, gas content, and morphology of their swim bladder. It has been observed that these factors present a strong variability across species and life stages (Davison et al., 2015). In particular, a recent study conducted in the Southern Ocean highlighted how, going from sub-Antarctic to Antarctic waters, the proportion of mesopelagic fish with a gas-filled swim bladder -and therefore the biomass estimated from acoustics- decreased while the biomass measured by mid-water trawling remained approximately constant (Dornan et al., 2019). It is therefore important to emphasize that the patterns in acoustic backscattering we identify in this study may result from differences in micronekton biomass, community composition, or fish physiology.
As mentioned in the introduction, in the region of study, we expect mesoscale eddies to impact the distribution of mesopelagic micronekton via several mechanisms: eddy trapping and transport of micronekton, the creation of thermal niches
FIGURE 4 | Case study of an anticyclonic eddy sampled in the subtropical northwest Atlantic in May (N2S4). (A) High-pass filtered SLA map overlapped to the R/V Atlantis ship track. The white section of the trajectory corresponds to the acoustic sampling and the black arrow indicates the start of the section. (B) Observations of density (black) and mesopelagic NASC (blue) across the eddy. The distance is calculated from the start of the acoustic sampling. (C) 38 kHz echogram of
backscattering strength. Gray and black bands on the top of (B,C) indicate observations collected at night (black) and during the day (gray). Red lines (dots in A) identify the transitions between eddy core, periphery, and ambient waters.
that can sustain the growth of different species compared to the surrounding waters, and enhancement of primary production, possibly leading to enhanced epipelagic biomass that could be available to mesopelagic organisms.
Most of the eddies in the study region show distinctive trapping of near-surface Chl-a (Gaube et al., 2014). The sampled eddies had not moved more than a few hundreds of kilometers from their origin when they were sampled suggesting that they could not have trapped particularly productive water from far away locations (for example from the continental shelf). On the other hand, the fact that the sampled eddies may have isolated the contained mesopelagic communities from the ones in ambient waters is likely to be important.
In the northwest Atlantic anticyclonic eddies are generally warmer than their cyclonic counterparts or compared to ambient waters (Gaube et al., 2018a). This could have important consequences for the mesopelagic community inhabiting such eddies: temperature can positively influence metabolic rates and therefore growth and reproduction (Proud et al., 2017) and could favor or limit the growth of specific species. The anticyclones we observed present indeed a strong positive temperature anomaly when compared with the average monthly temperature from the World Ocean Atlas (Locarnini et al., 2013, Figure S3).
If we interpret strong acoustic signals as a proxy for mesopelagic biomass, the observed pattern may appear counter
intuitive as anticyclones are generally associated with reduced phytoplankton biomass in this region (Gaube et al., 2014; Gaube and McGillicuddy, 2017). Recent work has indicated that near-surface Chl-a may not be the valid measure of whether an eddy is more or less productive. Anticyclones are generally characterized by deeper mixed layers (Dufois et al., 2016; Gaube et al., 2018b) resulting in vertically-integrated Chl-a being significantly elevated in anticyclones compared to ambient waters and cyclonic eddies during the height of the annual spring bloom (Gaube, pers. comm.). If anticyclones are “primed” with a more productive ecosystem, it is likely that they could enhance biomass of intermediate trophic levels, including the micronekton largely responsible for the acoustic backscattering at 38 kHz.
Global scale studies have found a strong relationship between near-surface primary production and mesopelagic backscattering. At smaller scales, we do not expect locations characterized by high primary production to necessarily present high mesopelagic biomass. Indeed, in our study, surface fluorescence (a proxy for Chl-a) and mesopelagic backscattering do not show any clear relationship suggesting that different mechanisms may be dominant (Figure S4). We should expect a time lag between the time of a peak in primary production at a given location and the development of a profitable environment for micronekton (similarly to what observed for
Della Penna and Gaube Eddies Structure DSL
mesozooplankton by Druon et al., 2019). While such lag is strongly dependent on the species present inside different water masses, it is of the order of magnitude of few months (Croll et al., 2005). The limited size and temporal resolution of our observations do not allow to draw conclusions in this respect.
The presence of potentially abundant mesopelagic ecosystems inside northwest Atlantic anticyclones presented here is consistent with the growing body of literature detailing observations resulting from the satellite tracking of large marine animals including top predators such as great white sharks (Gaube et al., 2018a), blue sharks (Braun et al., 2019), and sea turtles (Gaube et al., 2017; Chambault et al., 2019). In particular, Braun et al. (2019) found that blue sharks spend considerably more time, likely foraging, inside the cores of anticyclonic eddies. These studies all suggest that large animals are more likely to be found in anticyclonic eddy cores when compared to the peripheries of anticyclones or the interiors of cyclones. Although the mechanisms proposed for this affinity toward anticyclones is anomalously warm water found within their cores, we cannot definitively link elevated micronekton biomass to anomalously warm water in the mesopelagic within the cores of anticyclones. Further studies are required in order to assess whether anticyclonic eddies can actually support enhanced biomass or contain different mesopelagic communities.
DATA AVAILABILITY STATEMENT
All the datasets generated for this study are included in the article,
Supplementary Material or on SeaBASS at the URL https:// seabass.gsfc.nasa.gov/archive/UWASH/gaube/NAAMES/.
AUTHOR CONTRIBUTIONS
AD and PG designed the study, collected and analyzed the data, and wrote the manuscript. Both authors contributed to the article and approved the submitted version.
FUNDING
AD is grateful for the support of the Applied Physics Laboratory Science and Engineering Enrichment Development (SEED) fellowship and to the European Union’s Horizon 2020 research and innovation program under the Marie Sklodowska-Curie grant agreement no. 749591. PG is grateful for the support of the NASA Physical Oceanography Program and NASA grant NNX16AH59G.
ACKNOWLEDGMENTS
We thank the captains and crew onboard of the R/V Atlantis for their assistance and enabling safe operation during the four expeditions. We would also like to thanks Roland Proud, Elizabeth Phillips, and Sophie Fielding for their advice about the treatment of acoustics data and Marnie Joe Zirbel for the classification of the midwater trawl samples. We are also grateful to Pascal Rivière for the valuable discussions and to the two reviewers for their suggestions. This study has been conducted using E.U. Copernicus Marine Service Information (CMEMS).
SUPPLEMENTARY MATERIAL
The Supplementary Material for this article can be found online at: https://www.frontiersin.org/articles/10.3389/fmars. 2020.00454/full#supplementary-material
REFERENCES
Bailleul, F., Cotté, C., Guinet, C., et al. (2010). Mesoscale eddies as foraging area of a deep-diving predator, the southern elephant seal. Mar. Ecol. Prog. Ser. 408, 251–264. doi: 10.3354/meps08560
Béhagle, N., du Buisson, L., Josse, E., Lebourges-Dhaussy, A., Roudaut, G., and Ménard, F. (2014). Mesoscale features and micronekton in the mozambique channel: an acoustic approach. Deep Sea Res. Part II 100, 164–173. doi: 10.1016/j.dsr2.2013.10.024
Behrenfeld, Michael J., M., Hostetler, C. A., Graff, J., Gaube, P., Russell, L., et al. (2019). The north atlantic aerosol and marine ecosystem study (naames): science motive and mission overview. Front. Mar. Sci. 6.
Benoit-Bird, K. J., and Lawson, G. L. (2016). Ecological insights from pelagic habitats acquired using active acoustic techniques. Annu. Rev. Mar. Sci. 8, 463–490. doi: 10.1146/annurev-marine-122414-034001
Bianchi, D., and Mislan, K. (2016). Global patterns of diel vertical migration times and velocities from acoustic data. Limnol. Oceanogr. 61, 353–364. doi: 10.1002/lno.10219
Boyd, S. H., Wiebe, P. H., Backus, R. H., Craddock, J. E., and Daher, M. A. (1986). Biomass of the micronekton in gulf stream ring 82-b and environs: changes with time. Deep Sea Res. Part A Oceanogr. Res. Pap. 33, 1885–1905. doi: 10.1016/0198-0149(86)90084-1
Bracco, A., Provenzale, A., and Scheuring, I. (2000). Mesoscale vortices and the paradox of the plankton. Proc. R. Soc. Lond. B Biol. Sci. 267, 1795–1800. doi: 10.1098/rspb.2000.1212
Braun, C. D., Gaube, P., Sinclair-Taylor, T. H., Skomal, G. B., and Thorrold, S. R. (2019). Mesoscale eddies release pelagic sharks from thermal constraints to foraging in the ocean twilight zone. Proc. Natl. Acad. Sci. 116, 17187–17192. doi: 10.1073/pnas.1903067116
Chambault, P., Baudena, A., Bjorndal, K. A., Santos, M. A., Bolten, A. B., and Vandeperre, F. (2019). Swirling in the ocean: immature loggerhead turtles seasonally target old anticyclonic eddies at the fringe of the north atlantic gyre. Prog. Oceanogr. 175, 345–358. doi: 10.1016/j.pocean.2019.05.005
Chelton, D., Gaube, P., Schlax, M., Early, J., and Samelson, R. (2011a). The influence of nonlinear mesoscale eddies on near-surface oceanic chlorophyll. Science 334, 328–332. doi: 10.1126/science.1208897
Chelton, D., Schlax, M., and Samelson, R. (2011b). Global observations
of nonlinear mesoscale eddies. Prog. Oceanogr. 91, 167–216.
doi: 10.1016/j.pocean.2011.01.002
Conte, M. H., Bishop, J. B., and Backus, R. H. (1986). Nonmigratory, 12-khz, deep scattering layers of sargasso sea origin in warm-core rings. Deep Sea Res. Part A Oceanogr. Res. Pap. 33, 1869–1884. doi: 10.1016/0198-0149(86)90 083-X
Cotté, C., d’Ovidio, F., Dragon, A.-C., Guinet, C., and Lévy, M. (2015). Flexible preference of southern elephant seals for distinct mesoscale features within the antarctic circumpolar current. Prog. Oceanogr. 131, 46–58. doi: 10.1016/j.pocean.2014.11.011
Cotté, C., Park, Y. H., Guinet, C., and Bost, C. A. (2007). Movements of foraging king penguins through marine mesoscale eddies. Proc. R. Soc. B Biol. Sci. 274, 2385–2391. doi: 10.1098/rspb.2007.0775
Craddock, J. E., Backus, R. H., and Daher, M. A. (1992). Vertical distribution and species composition of midwater fishes in warm-core gulf stream meander/ring 82-h. Deep Sea Res. Part A Oceanogr. Res. Pap. 39, S203–S218. doi: 10.1016/S0198-0149(11)80012-9
Croll, D. A., Marinovic, B., Benson, S., Chavez, F. P., Black, N., Ternullo, R., et al. (2005). From wind to whales: trophic links in a coastal upwelling system. Mar. Ecol. Prog. Ser. 289, 117–130. doi: 10.3354/meps289117
Davison, P. C., Koslow, J. A., and Kloser, R. J. (2015). Acoustic biomass estimation of mesopelagic fish: backscattering from individuals, populations, and communities. ICES J. Mar. Sci. 72, 1413–1424. doi: 10.1093/icesjms/fsv023 De Robertis, A., and Higginbottom, I. (2007). A post-processing technique to estimate the signal-to-noise ratio and remove echosounder background noise. ICES J. Mar. Sci. 64, 1282–1291. doi: 10.1093/icesjms/fsm112
Della Penna, A., De Monte, S., Kestenare, E., Guinet, C., and d’Ovidio, F. (2015). Quasi-planktonic behavior of foraging top marine predators. Sci. Rep. 5:18063. doi: 10.1038/srep18063
Della Penna, A., and Gaube, P. (2019). Overview of (sub) mesoscale ocean dynamics for the naames field program. Front. Mar. Sci. 6:384. doi: 10.3389/fmars.2019.00384
Devereux, R. F., and Winsett, R. C. (1953). Isaacs-Kidd Midwater Trawl. Technical report, Scripps Institution of Oceanography, La Jolla, CA.
Dornan, T., Fielding, S., Saunders, R. A., and Genner, M. J. (2019). Swimbladder morphology masks southern ocean mesopelagic fish biomass. Proc. R. Soc. B 286:20190353. doi: 10.1098/rspb.2019.0353
d’Ovidio, F., De Monte, S., Della Penna, A., Cotte’, C., and Guinet, C. (2013). Ecological implications of eddy retention in the open ocean: a lagrangian approach. J. Phys. A, 25:254023. doi: 10.1088/1751-8113/46/25/254023 d’Ovidio, F., Monte, S. D., Alvain, S., Dandonneau, Y., and Lévy, M. (2010). Fluid
dynamical niches of phytoplankton types. Proc. Natl. Acad. Sci. U.S.A. 107, 18366–18370. doi: 10.1073/pnas.1004620107
Druon, J.-N., Hélaouët, P., Beaugrand, G., Fromentin, J.-M., Palialexis, A., and Hoepffner, N. (2019). Satellite-based indicator of zooplankton distribution for global monitoring. Sci. Rep. 9, 1–13. doi: 10.1038/s41598-019-41212-2 Dufois, F., Hardman-Mountford, N. J., Greenwood, J., Richardson, A. J., Feng, M.,
and Matear, R. J. (2016). Anticyclonic eddies are more productive than cyclonic eddies in subtropical gyres because of winter mixing. Sci. Adv. 2:e1600282. doi: 10.1126/sciadv.1600282
Early, J., Samelson, R., and Chelton, D. (2011). The evolution and propagation of quasigeostrophic ocean eddies. J. Phys. Oceanogr. 41, 1535–1555. doi: 10.1175/2011JPO4601.1
Fennell, S., and Rose, G. (2015). Oceanographic influences on deep scattering layers across the north atlantic. Deep Sea Res. Part I Oceanogr. Res. Pap. 105, 132–141. doi: 10.1016/j.dsr.2015.09.002
Flierl, G. R. (1981). Particle motions in large-amplitude wave fields. Geophys. Astrophys. Fluid Dyn. 18, 39–74. doi: 10.1080/03091928108208773
Fofonoff, N. P., and Millard, R. (1983). Algorithms for the computation of fundamental properties of seawater. Available online at: http://hdl.handle.net/ 11329/109
Garçon, V., Oschlies, A., Doney, S., McGillicuddy, D., and Waniek, J. (2001). The role of mesoscale variability on plankton dynamics in the North Atlantic. Deep Sea Res. Part II 48, 2199–2226. doi: 10.1016/S0967-0645(00)00183-1 Gaube, P., Barceló, C., McGillicuddy, D. J. Jr, Domingo, A., Miller, P., Giffoni,
B., et al. (2017). The use of mesoscale eddies by juvenile loggerhead sea turtles (caretta caretta) in the southwestern atlantic. PLoS ONE 12:e0172839. doi: 10.1371/journal.pone.0172839
Gaube, P., Braun, C. D., Thorrold, S. R., McGillicuddy Jr, D. J., and Lawson, G. (2018a). Mesoscale eddies influence the movements of mature female white sharks in the gulf stream and Sargasso sea. Sci. Rep. 8:7363. doi: 10.1038/s41598-018-25565-8
Gaube, P., McGillicuddy D. Jr, Chelton, D., Behrenfeld, M., and Strutton, P. (2014). Regional variations in the influence of mesoscale eddies on near-surface chlorophyll. J. Geophys. Res. 119, 8195–8220. doi: 10.1002/2014JC010111 Gaube, P., McGillicuddy Jr, D. J., and Moulin, A. (2018b). Mesoscale eddies
modulate mixed layer depth globally. Geophys. Res. Lett. 46, 1505–1512. doi: 10.1029/2018GL080006
Gaube, P., and McGillicuddy, D. J. (2017). The influence of gulf stream eddies and meanders on near-surface chlorophyll. Deep Sea Res. Part I Oceanogr. Res. Pap. 122, 1–16. doi: 10.1016/j.dsr.2017.02.006
Godø, O. R., Samuelsen, A., Macaulay, G. J., Patel, R., Hjøllo, S. S., Horne, J., et al. (2012). Mesoscale eddies are oases for higher trophic marine life. PLoS ONE 7:e30161. doi: 10.1371/journal.pone.0030161
Greene, C. H., and Wiebe, P. H. (1990). Bioacoustical oceanography: new tools for zooplankton and micronekton research in the 1990s. Oceanography 3, 12–17. doi: 10.5670/oceanog.1990.15
Irigoien, X., Klevjer, T. A., Røstad, A., Martinez, U., Boyra, G., Acuña, J., et al. (2014). Large mesopelagic fishes biomass and trophic efficiency in the open ocean. Nat. Commun. 5:3271. doi: 10.1038/ncomms4271
Judkins, D. C., and Haedrich, R. L. (2018). The deep scattering layer micronektonic fish faunas of the atlantic mesopelagic ecoregions with comparison of the corresponding decapod shrimp faunas. Deep Sea Res. Part I Oceanogr. Res. Pap. 136, 1–30. doi: 10.1016/j.dsr.2018.04.008
Kaartvedt, S., Staby, A., and Aksnes, D. L. (2012). Efficient trawl avoidance by mesopelagic fishes causes large underestimation of their biomass. Mar. Ecol. Prog. Ser. 456, 1–6. doi: 10.3354/meps09785
Kloser, R. J., Ryan, T. E., Young, J. W., and Lewis, M. E. (2009). Acoustic observations of micronekton fish on the scale of an ocean basin: potential and challenges. ICES J. Mar. Sci. 66, 998–1006. doi: 10.1093/icesjms/fsp077 Locarnini, R. A., Mishonov, A. V., Antonov, J. I., Boyer, T. P., Garcia, H. E.,
Baranova, O. K., et al. (2013). World Ocean Atlas 2013, Vol. 1, Temperature. MacLennan, D. N., Fernandes, P. G., and Dalen, J. (2002). A consistent approach
to definitions and symbols in fisheries acoustics. ICES J. Mar. Sci. 59, 365–369. doi: 10.1006/jmsc.2001.1158
Mahadevan, A., D’asaro, E., Lee, C., and Perry, M. J. (2012). Eddy-driven stratification initiates north atlantic spring phytoplankton blooms. Science 337, 54–58. doi: 10.1126/science.1218740
McGillicuddy, D. J. (2016). Mechanisms of physical-biological-biogeochemical interaction at the oceanic mesoscale. Mar. Sci. 8, 125–159. doi: 10.1146/annurev-marine-010814-015606
Potier, M., Bach, P., Ménard, F., and Marsac, F. (2014). Influence of mesoscale features on micronekton and large pelagic fish communities in the mozambique channel. Deep Sea Res. Part II Top. Stud. Oceanogr. 100, 184–199. doi: 10.1016/j.dsr2.2013.10.026
Proud, R., Cox, M. J., and Brierley, A. S. (2017). Biogeography of the global ocean’s mesopelagic zone. Curr. Biol. 27, 113–119. doi: 10.1016/j.cub.2016.11.003 Robinson, A. R. (2012). Eddies in Marine Science. Berlin; Heidelberg:
Springer-Verlag.
Ryan, T. E., Downie, R. A., Kloser, R. J., and Keith, G. (2015). Reducing bias due to noise and attenuation in open-ocean echo integration data. ICES J. Mar. Sci. 72, 2482–2493. doi: 10.1093/icesjms/fsv121
Ryan, T. E., Kloser, R. J., and Macaulay, G. J. (2009). Measurement and visual verification of fish target strength using an acoustic-optical system attached to a trawlnet. ICES J. Mar. Sci. 66, 1238–1244. doi: 10.1093/icesjms/ fsp122
Tew Kai, E., and Marsac, F. (2010). Influence of mesoscale eddies on spatial structuring of top predators–communities in the mozambique channel. Prog. Oceanogr. 86, 214–223. doi: 10.1016/j.pocean.2010.04.010
Wiebe, P., Morton, A., Bradley, A., Backus, R., Craddock, J., Barber, V., et al. (1985). New development in the mocness, an apparatus for sampling zooplankton and micronekton. Mar. Biol. 87, 313–323. doi: 10.1007/BF00397811
Wilcoxon, F. (1945). Individual comparisons by ranking methods. Biometr. Bull. 1, 80–83. doi: 10.2307/3001968
Woodworth, P. A., Schorr, G. S., Baird, R. W., Webster, D. L., McSweeney, D. J., Hanson, M. B., et al. (2012). Eddies as offshore foraging grounds for melon-headed whales (peponocephala electra). Mar. Mamm. Sci. 28, 638–647. doi: 10.1111/j.1748-7692.2011.00509.x
Conflict of Interest:The authors declare that the research was conducted in the absence of any commercial or financial relationships that could be construed as a potential conflict of interest.
Copyright © 2020 Della Penna and Gaube. This is an open-access article distributed under the terms of the Creative Commons Attribution License (CC BY). The use, distribution or reproduction in other forums is permitted, provided the original author(s) and the copyright owner(s) are credited and that the original publication in this journal is cited, in accordance with accepted academic practice. No use, distribution or reproduction is permitted which does not comply with these terms.