HAL Id: hal-02795719
https://hal.inrae.fr/hal-02795719
Submitted on 5 Jun 2020HAL is a multi-disciplinary open access archive for the deposit and dissemination of sci-entific research documents, whether they are pub-lished or not. The documents may come from teaching and research institutions in France or abroad, or from public or private research centers.
L’archive ouverte pluridisciplinaire HAL, est destinée au dépôt et à la diffusion de documents scientifiques de niveau recherche, publiés ou non, émanant des établissements d’enseignement et de recherche français ou étrangers, des laboratoires publics ou privés.
Staple food market regulation in Algeria, what is the
alternative policy? A CGE analysis for wheat
Hilel Hamadache, Sophie Drogue
To cite this version:
Hilel Hamadache, Sophie Drogue. Staple food market regulation in Algeria, what is the alternative policy? A CGE analysis for wheat. 17. Conference on Global Economic Analysis: New Challenges in Food Policy, Trade and Economic Vulnerability, Global Trade Analysis Project (GTAP). USA., Jun 2014, Dakar, Senegal. 35 p. �hal-02795719�
Staple food market regulation in Algeria, what is the alternative policy?
A CGE analysis for wheat.
Hilel Hamadachea and Sophie Droguéb a
INRA UMR MOISA b
IAMM UMR MOISA
Paper prepared for presentation at the 17th Conference on Global Economic Analysis “New challenges in Food Policy, Trade and Economic Vulnerability”
18-20 June 2014 Dakar, Senegal
Corresponding author: Hilel Hamadache IAMM UMR MOISA, Centre International de Hautes Etudes Agronomiques Méditerranéennes Institut Agronomique Méditerranéen de Montpellier 3191 route de Mende, F-34093 Montpellier, France. hamadache@iamm.fr
(Preliminary version, please do not quote)
Abstract: In this paper we present a Social accounting matrix and a computable general equilibrium model of the Algerian economy for 2009. The model is then use to perform scenarios simulation of reduction and removal of consumption subsidies on the wheat sector in Algeria.
Keywords: Algeria, Social Accounting Matrix, General Equilibrium, Food subsidy JEL codes:
1. Introduction
Since 1962 the regulation of the wheat sector is a key concern for the Algerian government. The social and economic weight of the wheat sector is such that it has always been given a special attention. In Algeria the average consumption of wheat is 193 kilos per person and per year, twice the French (98kg) or US (85 kg) consumption. Wheat represents 26% of the Algerian households’ food expenses. Cereals producers represented in 2010 60% of the total agricultural labor force. On average, the cereal crops area is 3.5 million hectares of which 2 million hectares are devoted to wheat. These areas allow the production of 2 million tons of wheat which represent 5.6% of the agricultural gross interior product. The wheat processing sector represents about 40% of the total production of the agro-food industries at the first
place in the Algerian agro-food sector. With its 3.5% share, the wheat sector contributes substantially to the national economy. It also contributes greatly to the income of about 630,000 people of which 90% are cereals growers. But despite this apparently favorable situation, imports are still needed to supply the local market. The weak improvement of the domestic production has compelled the authorities to find a way to balance between foreign supplies to avoid shortages and equilibrium of the national budget. Wheat is the most imported staple food in Algeria which comes first in the world ranking of the wheat importing countries. In 2009 these imports have cost 2 billion dollars to Algeria and the increase of the domestic production was not enough to reduce the bill. The increase in other staple foods price has diverted the demand towards subsidized wheat flour. This situation of food substitution towards wheat processed products is a perverse effect of the consumption subsidy mechanism.
From 1962 (date of the independence of Algeria) to 1988, the Algerian state had a monopoly in importing and processing wheat in the country. This has required increasing the country’s wheat capacities of production, importations and process. The objective was to manage staple goods supplies and the state entity in charge of this regulation mission is the Office Algerien Interprofessionnel des cereales (OAIC) which had the monopoly in collecting, storing, importing and distributing cereal grains. This office controls the production and consumption prices as well as the production systems. Reforms were launched in 1982 in order to change the way the cereal market as well as the other sectors of the national economy are regulated. These reforms were initiated in parallel with the restructuration of the Algerian state. This leads to the decentralization and state partial decommitment in many parts of the economy of which the wheat sector.
This policy of regulation has become more difficult in 1986 with the dramatic drop in fuel prices. The sharp rise in the national debt has limited even more the financial resources of the Algerian state. The drop of the exchange rate of the Algerian Dinar has worsen the situation of the OAIC because the cost of imports rose entailing the deficit of the compensation fund, the state entity which compensates the gap between the world and domestic price through
subsidies. The decommitment of the state accelerates with the 1988 law of economic liberalization which enacts the dismantling of state production and trading enterprises and the end of the OAIC monopoly in wheat imports. But its mission of regulation continues. It relies upon the supervision of the pricing system throughout the sector and a policy of price intervention through subsidy. The policy implemented has a twofold objective:
- providing an incentive price to cereals producers in order to encourage them to improve yields and increase production;
- constraining the other actors of the sector (milling industry, distributors and bakers) to respect the price levels set by regulation. Consumption prices of wheat processing products are targeted on regulated prices of bread (for flour) and semolina. These latter prices are fixed at a very low level to keep them compatible with the level of the national guaranteed minimum wage.
This policy of subsidy aims at ensuring food security maintaining a low level of consumption price thanks to a ceiling pricing system of flour, bread and semolina. This role is devoted to the OAIC which controls the entire system of price and subsidy. It benefits from a public budget which in 2009 amounted to 160 billion dinars almost 2 billion dollars. These funds are directly provided to the OAIC, which is in charge of buying the wheat on the domestic or international markets and to re-sell it at the price set by the State. This consumption price has always been lower than the domestic or international price. The OAIC fills the gap between the buying and selling price. However these distorsive measures are on the verge of being given up. Their increasing weight in the public budget, the pressure of the demand for subsidized commodities and the liberalization process are such elements which urge to find an alternative to this policy. Only a few studies have analyzed the economic efficiency of this policy, and even less its impact on the population (Bencharif and Rastoin, 2006; Sassi, 2007; Djermoun, 2009; Chehat, 2010). However, this literature is very qualitative and unable to assess the breadth of a reform impact whether at a macro or micro level. Some others quantitative studies using a CGE model exist, but they were mainly developed to analyse an international trade liberalization impact (Oukaci, Kherbachi. 2008), or a global external price
shock on the Algerian economy (Touitou, 2014). Many studies used partial equilibrium models to analyse regulation policies but using this type of models often under-estimates the effects on the economy (Van Tongeren and al. 2001). As wheat as a widely-consumed product in Algeria, it is directly linked to the rest of the economy. Thus we think that computable general equilibrium models are the most suitable in our case.
In the rest of this article we will present the design of a Social Accounting Matrix (SAM) for the Algerian economy and a first version of a Computing General Equilibrium Model (CGEM) calibrated on this SAM (sections 2 to 4). We use a basic static CGEM model as presented in Martins et al. (2001), slightly modified to stay as close as possible to the Algerian economic reality. We pay a special emphasis to the sector of hydrocarbons and to the sector of wheat because they both play particular role in the Algerian economy as the revenues of the former feed the subsidies of the latter. Then section 5 is devoted to the presentation of the results of simulating a scenario of a removal of wheat subsidy in Algeria. Finally, section 6 concludes.
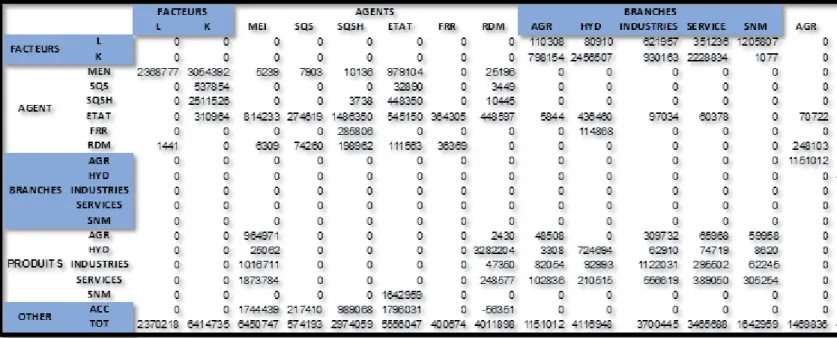
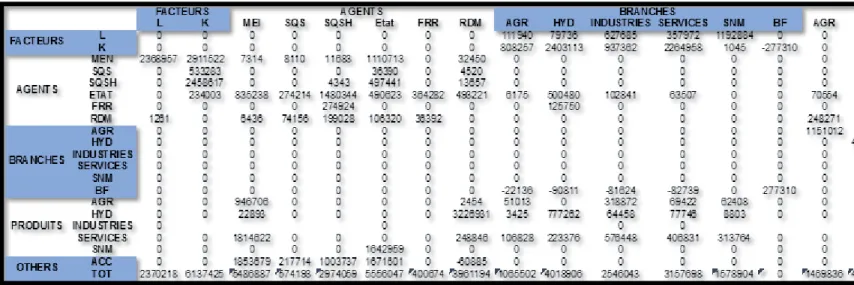
2. A social accounting matrix for the Algerian economy (SAM- Algeria)
The SAM presented here is part of the family of macro-SAM because, except for the wheat market, there is no other specific disaggregation. The accounts of the matrix display the data provided by the Algerian national accounts. Our social accounting matrix is based on the model proposed by Martins et al. (2001). Very convenient to build, this matrix called EXTER is a simplified representation of what information a SAM should contain. The final structure of the SAM is largely determined by the availability of data for the base year (2009), as well as the necessary compatibility with the classification and level of disaggregation established by the Algerian Economic Accounts System (AEAS).
The starting-point of building a SAM is the Input-Output (I-O) matrix (Keuning and De Ruijter, 1988). SAM-Algeria provides a summary of the intermediate and final input and output tables (IOT) and of the overall economic tables (OET) for the Algerian economy in the version of 2009. Additional data not included in these tables are obtained through several
other sources of information (Ministry of Finance, General Direction of Customs and the Algerian Statistical Office). The flows in the matrix are expressed in millions of current dinars for 2009, they are structured as follows.
2.1. Sectors and products
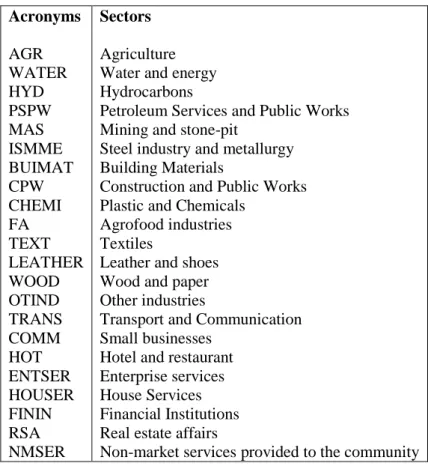
The Algerian economy is disaggregated in 22 productive sectors. According to the classifications of the IOT and OET, we have separated the agricultural sector from the food processing and chemical industry and the oil services are also split in oil services intended to households and oil services intended to business (the list of sectors and related acronyms used in this paper are listed in Appendix 1).
We believe that all sectors produce market goods and services, except public services which are produced by the government and offered free of charge to citizens (non-market services provided to the community NMSER). We also consider five economic sectors producing non- tradable services (PSPW, HOUSER, FININ, RSA, NMSER) to which is added the small businesses sector (COMM) also considered as non-importer. In this SAM, no distinction is made between domestic and foreign markets in the supply of products, the Algerian government does not apply any export tax, therefore it is not necessary to include a market for the supply of export products and another for the supply of composite products, we will return later to the structure of foreign trade.
2.2. Primary factors
Our SAM has only two factors of production, labor and capital. It was not possible to consider land as a factor of production for agriculture, therefore, the land endowment is assumed to be infinite. In this analysis, no distinction is made between categories of workers which are thus considered as perfectly substitutable. Indeed, at this stage of our work, disintegration of production factors was not possible given the available data.
In this classification we find a first category representing households. Unfortunately, unlike the EXTER matrix we cannot distinguish between “labour endowed households” and “capital endowed households” likewise we cannot make a distinction between poor and rich households. This failure prevents us to make any assessment according to social classes. The households account includes employees and unincorporated businesses which receive capital transfers including the return on capital for the capital endowed households; transfers from the State (social benefits and health insurance); operating subsidies for individual companies and the interest paid on savings. They also receive transfers from firms (dividends, rent, etc.) and intra-agents transfers, mainly rents paid by renters to landlords. The last transfer from the rest of the worldis the transfers to households by non-residents mainly by Algerian emigrants living and working abroad.
The second category concerns firms disaggregated in non-hydrocarbon companies and the national petroleum company. This distinction emphasizes the weight of oil in the Algerian economy; moreover the behavior of the two categories of companies is fundamentally different. Each category of firms receives direct aid from the state for a respective amount of 21,506 and 320,120. Transfers from the rest of the world correspond to dividends paid for the participation of foreign companies in the Algerian capital or the payment of services rendered abroad. In addition, the hydrocarbons company receives an intra-agent flow of 4,343 which is a transfer from the parent company (Sonatrach) to different subsidiaries.
The State account is split into two categories: the central and local administrations (institutions providing services) and the Revenue Regulation Fund (RRF). The latter was established in 2000 with a twofold purpose, to fight against the inflation and an overvalued exchange rate, and secure the development programs. Besides the classical levy taxes paid by households and businesses, the State currently receives revenues from capital totaling 73,217 for its participation in the production company capital. A new flow is recorded in the State account, the intergovernmental transfers totaling 444,182. They are mainly tax revenue transfers from the central government to local government and funding of the aforementioned
public regulatory agencies1. The State also receives transfers from abroad. They are mainly aid or assistance funds which are not related to public projects, aid from international organizations or foreign governments. The SAM-Algeria introduces a tax levied at the stage of production2. This tax applies to the sum of the factors of production (capital and earnings of the sector). Therefore, the total expenditure of sectors at factor cost includes the factor tax. The Revenue Regulation Fund, this account is specific to the SAM-Algeria. The disaggregation of the state into two accounts is made to better reflect the contribution of the oil sector to the national economy through the RRF.
The final category is the rest of the world (RoW) representing international flows paid or received by Algeria to and from abroad.
2.4. The wheat market
At this stage of our work, agriculture is aggregated in a single sector, according to the level of disaggregation of the IOT. Most of the information available in the matrix is from these two tables of national accounts, and all data sources to which we had access show the same level of disaggregation as IOT or OET.
However, in order to meet the need of our modelling exercise, we must separate the wheat sector from the rest of the agriculture. Wheat is added to the other sectors of the economy, as well as to the product accounts. Other agricultural products are combined into one category called "rest of agriculture" containing all agricultural products except wheat. To this end, in the SAM, the agricultural sector is split into two rows and two columns. The sum of the two accounts is equal to the total of the agricultural sector. The data of the wheat market are obtained through various sources: the agricultural statistics tables for 2009 matched with data bases from various sources, and estimates using assumptions and weights. For more rigorous
1Some SAM builders do not include this type of intra-agent transactions and leave the cells empty. For
our part, and knowing that their inclusion does not change the balance of the matrix, we prefer keeping them because the matrix of transfers is very important for our modeling work. These flows may be useful to us later.
evaluation of missing data, the results obtained are always validated by experts of the wheat sector in Algeria3.
2.5. The consumption subsidies
Subsidies are included in the various flows of taxes expressed as net values. In other words, taxes are calculated “net of subsidies”. In the case of wheat, the Algerian context is a bit particular because the public policy was at the same time supporting producers and consumers. The cereals national office (AIOC) is responsible to supply the local market at a price set by the public authority. This price, called “retrocession price” is lower than the international market price, and the purchase price of the national output. AIOC only compensates the difference between them, and the final price to the consumer (Chehat, 2010). When the international price of wheat was low, the AIOC bought the wheat to domestic producers at a price above the international price and re-sold it to consumers at a price equal or below the international price. The difference between the two prices was covered by the revenue of the oil industry. However, 2009 is a particular year because it is characterized by high level of cereals price on international market. As a consequence in the SAM-Algeria we decide to take account only of the consumer subsidies and consider the producers subsidies as equal to 0.
Given the fact that the subsidy budget is funded by the State, the flow of subsidies is registered in the matrix, as a public transfers paid directly to the final consumer of wheat. The variable representing this transfer is called (SUBwheat). To keep the consistency with the data
we must withdraw the value of subsidies from other aggregates like the intergovernmental transfers (transfers from the central government to the funding agencies and regulators, including the AIOC). The amount of state expenses and income does not change. Then, we add the value of subsidies to indirect taxes applied to Wheat.
3
They are mainly officials from the Department of Agriculture statistics, National Institute of agricultural science (INRA) researchers working on the wheat sector. We kindly thank them for their gentle help throughout this work.
3. Balancing the SAM
SAM-Algeria is built on the basis of data from different sources: IOT, OET, data of national accounts, household survey, the State’s accounts, foreign trade statistics, etc. Thus we must be able to find a consistent methodology to reconcile the basic information from various sources. Especially, it is sometimes necessary to evaluate, using assumptions, some data that does not exist. This necessarily creates a general inconsistency in the matrix, and an accounting imbalance. To balance the matrix several techniques are available, the most widely used are the RAS and cross-entropy methods (Fofana et al., 2005).
In our SAM, the imbalance appears at two levels: first of all economic sectors producing tradable goods i.e. all sectors using intermediate consumptions. The total cost of production at producer prices (columns) exceeds the output of the industry (rows). Then, another imbalance appears at the capital income level, total gross operating surplus for the different agents (column) is greater than the capital income of all sectors of the economy (row).
This raises in final, a serious problem of data consistency of the SAM. To overcome this issue, we propose in this section to test the RAS method, the cross-entropy method and a method called “the sector of control method”.
3.1. The RAS method
This method is the most commonly used for balancing a SAM. It is often useful when the total rows and columns are not equal, or when we have new data and would like to update the matrix (Sadibou Fall, 2010). The initial problem to solve is to find a new matriceY1 very close
to the initial Y matrix specifying in advance, totals of control for each row and column of the matrix to balance Y. We denote these totals of control Yi,1 for the new total lines and Yj,1 for
the new column totals. Then, using an iterative procedure, the elements of matrix Tti,j are
adjusted proportionally until obtaining totals of control previously assigned to Yi,1 and Yj,1. At
this point, we have reached the requirement of convergence. To apply this method, it is imperative that the equality between the total rows and total columns is checked:
Then later, we fix a threshold of control ε that will control the difference between the values of the totals of control and those of the new matrix. This verification is done at the end of an iterative procedure leading to the final balance of the matrix. To apply the RAS method, we use a GAMS program inspired from balancing the SAM of the Senegalese economy for 2006 (Sadibou Fall, 2010). We have adapted this code to our SAM, we take the values of rows in the base matrix as control value for the rows and columns as follows: Yi
1
= Yj 1
= Yi. We then
run the model until the SAM is balanced. The SAM 2009, balanced by RAS method is presented in the appendix.
3.2. The cross entropy method
As the RAS method, cross-entropy is commonly used to balance SAM. It measures the uncertainty between a data and a previous one, in the absence of uncertainty, the difference is zero. The first application of this method to balance SAM was done with the works of Robinson et al. (1998), Robillard and Robinson (1999) or Robinson and El- Said. (2000). The procedure is to minimize the extent of cross-entropy of the distance between post and a priori probabilities. This method is useful to minimize the impact of "additional" information in the SAM. The problem to be solved remains broadly the same as the RAS method, it is to find a new matrix T1 very close to the initial matrix T by minimizing the entropy distance between
them, with the possibility of introducing some constraints, such as control totals used for the RAS method, with the advantage of including new data in the SAM. We applied this method to balance our SAM using a GAMS program, to which we add the checksums in the same manner as the RAS method: Yi
1
= Yj 1
= Yi, i.e. taken as a reference, the total rows in the base
matrix. We have added two additional constraints. The first is used to equalize the total rows and columns. In addition to respecting the equality between the totals of rows and columns, we fix the zeros in the SAM, no fictitious transaction should be generated by the balancing
procedure. In other words, an empty cell in the base matrix should be empty once the matrix is balanced. The SAM 2009, balanced by the method of cross entropy is presented in Appendix.
3.3. The method of the sector of control
Inspired by the System of National Accounts of the Moroccan economy, this method involves the use of a new sector in the economy, only to reach an accounting balance of SAM. This method allows us to achieve a simple operating overall coherence of the SAM. In the case of our SAM, there are two main imbalances, the method of the sector of control should take place at the data level that are the source of these imbalances. To do this, we proceed as follows: we create a sector in the economy which does not produce anything, nor generate added value, it is only used to balance totals for rows and columns, by absorbing the variances. In our case, the sector of control corrects the deviations in columns of the total cost of production (VXj) for the various sectors, and the value of total capital income (RK) in rows.
The rest of the flows of the matrix do not change, it is the principal advantage of this method. Indeed, we achieve equilibrium between rows and columns without changing the internal values of the matrix, something that cannot be done with the previous two methods.
To summarize, the control branch has a negative amount of return of capital and a positive value of total intermediate consumption equal to the same amount. The (CIi,j) of the product
of this sector are distributed in negative values on all sectors of the economy to balance their total costs of the respective production. The SAM 2009, balanced by the method of sector of control is presented in Appendix.
3.4. Analyze of the results of the balancing procedure and choice of the SAM
The analysis of the three balanced SAM shows compliance with the constraints imposed by the balancing procedure. In addition to respect the equality between the totals of rows and columns, the matrix structure is very close to the original SAM. It is even identical to the SAM balanced by the sector of control; the latter has not induced a great transformation, but
involves the assumption of the existence of an additional sector in the economy. But a problem arises because the behaviour of this sector must be modeled in the CGEM and cannot. No fictitious transaction appears in the three matrices, the share of different values in total is also respected and accounting macroeconomic balance. The RAS method and the entropy both converge to an optimal solution. The totals for rows and columns are equal to the two matrices, but the values of their cells are different. However, the method of entropy allows accounting for some hypotheses, for example, fixing the initial value of the GDP at factor cost, keeping the amount of government savings, etc.
Based on the analysis of three balanced matrices, we keep to calibrate the model, the SAM balanced according to the cross-entropy method. Indeed, for the sake of modeling, we discarded the first matrix including the sector of control. To decide between the last two SAM, we find that the gap between the values of the original SAM and the balanced SAM is significantly lower for the cross-entropy method.
4. A Computable General Equilibrium Model for the Algerian economy (CGEM - Algeria)
The CGEM presented in this section follows the macroeconomic structure of the SAM previously described. Our model is adapted from the EXTER PEP standard CGE model presented in Martins et al. (2001). Except for a few assumptions, this model is close to the others CGE found in the literature: IFPRI (Lofgren et al., 2002), MIRAGE (Bchir et al., 2002), GTAP (Brockmeier, 2001).
It is a static model calibrated for 2009. We present in what follows, the theoretical framework of our model, focusing only on specific aspects added to the standard version EXTER. We seek in this section to highlight the specificities of the Algerian economy to be as faithful as possible to the economic reality studied.
We present in this section the main basic characteristics of the CGEM-Algeria. They are grouped into blocks, namely: production, transfers between agents, income and saving of agents, transfers between agents, foreign trade, final demand, taxes, and price formation, we
finally conclude with the closure assumptions and conditions of macroeconomic stability. A special treatment is given to the hydrocarbons sector and the public sector represented by the government.
4.1. Production
Dealing with production is pretty standard when the economy is divided into sectors, each producing a composite good consisting of a domestic good sold on the local market and another exported. Every industry uses labor and capital as factors of production, capital is specific to each sector and labor is perfectly mobile between sectors.
The Leontief production function induces a perfect complementarity between intermediate consumption and value added in the production goods and services. The formation of value added is represented by a Cobb-Douglas function implying perfectly substitutable factors of production with constant returns to scale.
4.2. Final demand
The household utility function is a Cobb-Douglas between savings and consumption. In other words, households determine their consumption for each composite good
on two levels: first, they set relatively to their disposable income, what they want to save and what they want to spend, then, they determine according to the prices of all goods, the share of the consumption budget allocated to each good
is the consumption of the household category
of product
.
and are
respectively, disposable income and household savings.
4.3. Foreign Trade
The assumption of international trade adopted in our work is that there is imperfect substitutability between tradable goods. It is also assumed that the demand from the rest of the world for all products is infinitely elastic, Algeria is considered as a "small country" in a
situation of "price-taker", so that prices of imports and exports are completely exogenous to the functioning of the economy.
On the domestic market, the idea is that the output is a composite of two goods (domestic and exported), imperfectly substitutable. According to this hypothesis, output is modeled by a constant elasticity of transformation (CET) function. Therefore the export volume is calculated based on the export price
and the domestic price
.
Imports from different countries are not perfectly substitutable. This specification is called the "Armington assumption". Therefore, the consumer buys a composite good which is the result of a constant elasticity substitution (CES) function between a domestic product (
)
and an imported one ()
.4.4. Extension of the basic model and characteristics of the Algerian economy
Some features of the Algerian economy have been treated differently. This includes the State as a provider of public services, the hydrocarbon sector as a driving force of the economy, and the wheat market as highly regulated by the government.
4.4.1. The public sector
Unlike the private sector, the public sector produces non-market goods and services; which are freely available to economic agents. Therefore, this sector does not adopt the same functioning as the other sectors (Karam, and Decaluwé, 2007). The productive sector demands labour
and capital
in order to maximize its profit. On the other hand, the State as a producer of public goods and services does adopt an optimizing behavior. Therefore, we assume that the added value of non-market goods is a “Leontief” combination between labour and capital. The value added is as follows:
Where
is the Leontief coefficient of capital,
is the added value of the public sector.
is the demand for capital in the public sector. Labour demand is therefore:
The demand for labour is no longer based on the price of labour, made of the price of value added and wage rates to maximize profit, but it is a part of the value defined by the Leontief technical coefficient of labour
.
The government final consumption
is equal to the value of the production of non-market services provided to the community.
Non-market goods are not importable and non-tradable; the government does not choose between what it may export to international market and what it can sell on the local market. Therefore, the production function is expressed as follows:
Where the quantity produced is equal to the domestic market demand. The amount of composite good available on the local market depends, only on local demand, and writes:
Therefore, the arbitration between importing and purchasing on the domestic market no longer exists. Public services also have a different price structure. The producer prices
does not depend on the export price
and the market price
does not depend
on import prices
, which gives us the following calculation:
These features presented here are used to characterize the specific functioning of the public sector, due to the nature of services produced, and because of its relationship with the rest of the economic sectors.
4.4.2. The hydrocarbon sector
The sector producing oil and gas, hereafter “hydrocarbon sector” is also very specific. Oil and gas revenue is an essential component of the Algerian economy. The exploitation and management of hydrocarbon resources are assigned to a single public company the “Sonatrach”, which with its subsidiaries is responsible for all activities in this sector, from exploration to distribution through the supply of oil services.
At the level of value added, there is no research of profit maximization, or cost minimization. Hydrocarbons are a rent product, and the selling price is totally disconnected from the cost of production. To produce more oil, the public company must use capital (machines drilling and extraction equipment, etc.) to which is added the wages of workers (engineers, technical staff, etc.) The objective of the State is primarily to meet the demand for hydrocarbons, there is no optimization process therefore, the value added is a Leontief between capital and labor.
Where
is the Leontief coefficient of capital,
is the added value of the hydrocarbons sector.
is the capital demand of the hydrocarbon sector. The labor demand is written as follows:
The hydrocarbon sector income consists of both the return on capital from this sector and from the oil services sector, which is also managed by the government.
The oil sector benefits from a tax structure completely different from that of other sectors it can be simplified through the following scheme (see figure 1):
Figure 1: tax structure of the hydrocarbon sector
Taxes levied on the hydrocarbon sector are composed of two main taxes: direct taxes
and oil royalties
. The first tax is a direct transfer from the oil companies to the fund of regulation (RRF). This is written as follows:
Hydrocarbon sector Oil tax Oil royalties
Direct taxes on production
Share paid to the State Portion paid to RRF Share paid to the State Portion paid to RRF
Oil tax sterilized Oil tax budgeted
It is obtained by applying a direct tax rates
on the value of the return on capital in the hydrocarbon sector and petroleum services. This tax consists of a share of revenues from these two sectors paid to the government and represents the budgeted tax
, the rest of the direct tax is placed in the revenue regulation fund, representing the value of tax "sterilized"
, not included in the State budget. Both make up the total tax paid to the government.
The second tax
is a fee consisting of a share paid by the oil industry to the government
, included in the composition of the budget, and the remainder is placed in the Revenue Regulation Fund
, the total of the two payments constitutes the oil royalties. The calculation is as follows:
Where
is the rate of oil royalties applied to the value of the production of hydrocarbons, calculated on producer prices.
To calibrate the oil taxes paid to the government (tax budgeted) or placed in the RRF, we should first understand the functioning of the government budget. It is determined every year on the basis of a finance act, which includes all expenses that the government should make during the year. The hydrocarbons exports revenues directly fund these expenses. As the
capacity of absorption of the economy is limited and to avoid a “Dutch syndrome” scenario (Hamadache, 2009) the budget of the Finance act is calculated on the basis of an established export price
, and undervalue compared to international market prices. This price once fixed, will be used as the basis for determining the final State budget included in the Finance Act. For the calibration of our variables
and
, we take into account the price fixed by the Finance Act, which we call
, which is part of the price fixed by the
government in relation to international oil prices. It is no really a price, but a relationship between two prices.
A distinction is also to be made regarding the structure of hydrocarbon prices. Indeed, the consumer price of oil
is fixed by regulation; it is completely exogenous to the model. To do this, we maintain the equation of
, and we specify in the closure that the price of oil production
must remain fixed.
And finally, foreign trade oil has also a functioning, which is linked to the logic of oil exports in Algeria. The assumption is based on the fact that, local market supply is a priority of the government; the entire domestic demand for hydrocarbons must be satisfied first. This political decision can be widely feasible, because the only company in this sector, Sonatrach, is fully managed by the government. This implies that export supply is no longer determined by the domestic prices and export prices, but it is determined residually by the surplus of production over domestic consumption. The function is given as follows:
Where
is the volume exported,
sector output and is the local market demand. This specification implies that the exporter would not have to make a choice between international sales and sales on the local market, this functional form does not allow it. As for the RRF, it is considered as an agent of the economy, it has relations with the rest of the agents and a single sector, hydrocarbons. The income of this fund is composed of the transfer of oil sector as a direct tax, in addition to oil royalties
.
4.4.3. The wheat market in model
The Algerian wheat market has experienced various regulatory policies which main objective is to ensure the food security of the population. Therefore, the intervention on consumer prices has always been the flagship of food regulation mechanism in Algeria. It is based on
maintaining a low consumer price of wheat, regardless of the international or local price. The agency in charge of the price control must ensure the continued availability of wheat throughout the country, at an affordable price for the Algerian population. Indeed, wheat consumption price is fixed by the government. Despite fluctuations in the international wheat market, the consumer price remains stable; it is the subsidy budget that fluctuates according to international prices changes. To take into account the subsidies of the wheat market, we must include it in each structure of the model. First, at the government savings level, the amount of subsidies is taken into account as follows:
Where is the government-spending budget. Public saving and income do not change compared with the initial model.
The consumer price is assumed to be fixed. The wheat subsidy is adjusted
according to the international and local producer price level. Therefore, consumer price is the share of market price paid by consumers; the rest is paid by the government. We call the subsidy rate. This parameter is calculated as follows:
And the wheat consumer price is obtained as follows:
The consumer price is equal to market price minus the subsidy. is the inverse proportion of the subsidy rate.
Finally, goods and services consumption function will also change. We introduce a Linear Expenditure System (LES) demand function, which splits aggregated food products into two products wheat and rest of food. The LES is very close to the Cobb-Douglas function, but it allows a richer consumer behavior (Karam and Decaluwé, 2007) by adding varying elasticities. The use of this new functional form also introduces the concept of minimum consumption level . In other words, the share of the budget allocated to the
consumption of each product varies according to the change in the consumption budget
. The consumption function is given by:
We find that the introduction of the new variable significantly changes the
behavior of household consumption. The budget for the consumer is strongly modified; it is reduced by the share of minimum consumption for all goods .
is an exogenous parameter.
Then, the share of each product consumption in the total consumption of households is calibrated using the income-elasticity of demand which is also an exogenous parameter given by the following formula:
In other words, the part is adjusted by elasticity .
5. Closure
In general equilibrium, There are four main macroeconomic constraints to be satisfied: the equilibrium of the investment through savings, the equilibrium on the market of goods and services between supply and demand, the equilibrium of primary factors and the equilibrium
of the balance of payments. In our model, we adopted a standard Walrasian closure, adding some adjustments in order to the model structure coincide with the economic reality of Algeria. The model is calibrated on the social accounting matrix for 2009. The structure of our economy as we have described through the structure of supply and demand will be in equilibrium if it simultaneously reach the following equilibriums: the equality between supply and demand of composite goods. In other words, it is necessary that the total demand is equal to the total endogenous supply of composite product through price adjustment. Second, the macroeconomic equilibrium is always guaranteed by adjusting the investment to savings. The savings of all agents gives us the desired balance. Another main feature is related to macro demand factors productions. In our model, the demand for capital is assumed to be fixed and fully used by the various sectors, however, labour is mobile between sectors and can not be fully used, therefore, the assumption of full employment is rejected incorporating an unemployment rate, in order to equilibrate supply and demand for labour. The total demand for labour must also satisfy equilibrium, so as to equalize the sum of labour demand for all economic sectors. We will check the final Walras' law on general market equilibrium. It postulates that for a positive excess demand in a market, there will be a negative excess demand in other markets. And finally, the model takes into account relative prices, which are crucial in the decisions of production and consumption. These are themselves expressed relative to a good price chosen arbitrarily, the numeraire. For our model, we choose the exogenous nominal exchange rate as numeraire. The deficit in the current account balance, the government budget expenditure and capital demand are exogenous variables, as well as the price of imports and exports, according to the hypothesis of small country with price taker situation.
6. Results of simulations
In order to assess the impact of the subsidy policy reform on the overall economy and more particularly on the households’ consumption level, we compare the baseline equilibrium (with subsidy) to a situation where the subsidies have been removed. Doing so, we assume that a
the removal of subsidies leads to a price increase for subsidized goods and to a loss of households’ - particularly the poorest – market power (Gharibnavaz and Waschik, 2012). It is thus necessary to protect households from unwanted impacts of this reform implementing a redistributive program of consumption subsidies. We simulate a scenario of removal of subsidies where the share of State’s revenue primarly intended to subsidize consumption is directly redistributed to the households. In this reform, the government removes the consumption subsidies ( , and transfers them to the households in order to respect a fixed amount of public expenses considered as exogenous in our model. The gain from the removal of the subsidies is redistributed to household exogenously. It is used to provide them with revenue high enough to maintain a satisfying level of consumption (Löfgren and El-Said, 1999). We assume a liberalization of the domestic wheat market. As expected the results of the simulation show an increase of following the suppression of the administrative price
and a decrease in the final consumption of wheat by Algerian households who substitutes other staple goods (See table 1).
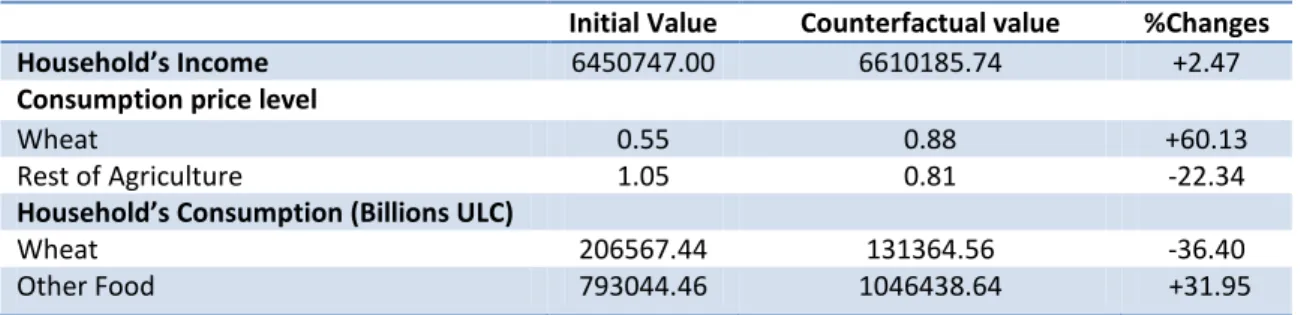
Table 1. Aggregate effects of the consumption subsidy removing on Households.
Initial Value Counterfactual value %Changes
Household’s Income 6450747.00 6610185.74 +2.47
Consumption price level
Wheat 0.55 0.88 +60.13
Rest of Agriculture 1.05 0.81 -22.34
Household’s Consumption (Billions ULC)
Wheat 206567.44 131364.56 -36.40
Other Food 793044.46 1046438.64 +31.95
Sources: author’s calculation.
We observe a 2.47% increase of households’ incomes due to the public transfer to households, following the re-distribution of the subsidies’ budget as direct support. The removal of wheat consumption subsidies lead to a sharp rise in the domestic price (+60.13%) and consequently its consumption has decreased greatly (-34.4%). Conversely, the prices of other food products decrease (-22.34%), and their consumption increases (+31.95%) because Algerian households substitute less expensive staple food to wheat.
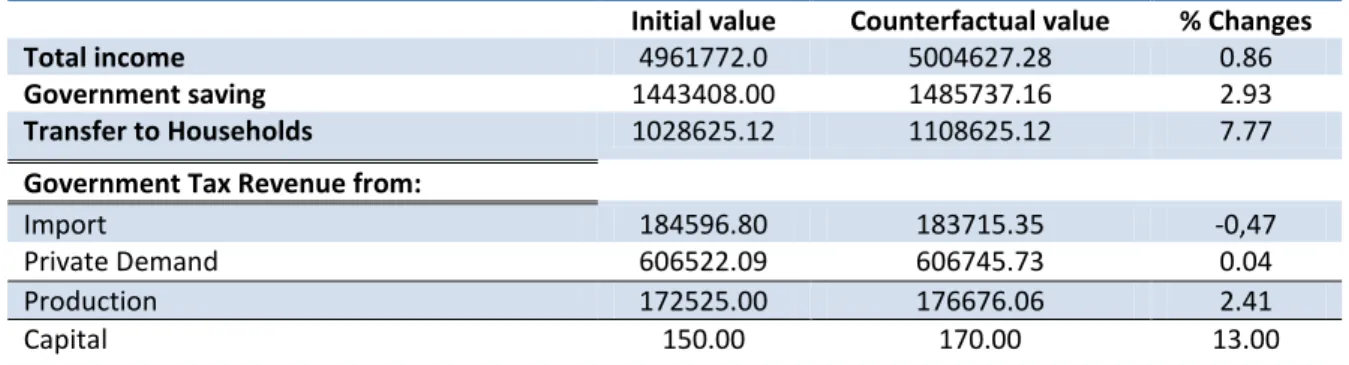
As shown in table 2, following the removal of consumption subsidy, the governement total income and public savings have slightly changed (+0.86% and +2.93% respectively).
Table 2. Changes in the government revenue
Initial value Counterfactual value % Changes
Total income 4961772.0 5004627.28 0.86
Government saving 1443408.00 1485737.16 2.93
Transfer to Households 1028625.12 1108625.12 7.77
Government Tax Revenue from:
Import 184596.80 183715.35 -0,47
Private Demand 606522.09 606745.73 0.04 Production 172525.00 176676.06 2.41
Capital 150.00 170.00 13.00
Sources: author’s calculation.
This policy reform has a cost for the public budget as the transfers to households have increased (+7.7%). This is, indeed, a simple re-orientation of the subsidy budget, but this direct support could be redistributed towards the poorest households. Total food consumption raises (+17%) including processed food. Food security is ensured as a satisfying level of food consumption is guaranteed to households. The benefit for the Algerian economy to transform wheat subsidies in direct transfers to households is (i) this latter type of support is less distorsive; and (ii) it can be targeted at a specific category of households.
Table 3. Macroeconomic effects of the consumption subsidy reform
(variations in %)
Base Level Change %
GDP in value 8507645.2 8632727.9 1.47 Private consumption 3748082.9 3840721.7 2.47 Total investment 4685844.0 4794573.4 2.32 Total production 14077050.7 14037770.7 2.02 Total import 3583770.5 3577972.5 -0.16 Total export 3524105.1 3525815.7 0.05
Sources: author’s calculation.
The macroeconomic effects of the policy reform are shown in table 3. All macroeconomic variables increase; the GDP (+1.47%) following an increase in capital income; private consumption (+2.47%) thanks to an increase in households’ income, investment (+2.32%) further to the raise of savings. Production and trade experience also slight variations. Total output increases (+2.02%) thanks to an increase in the final demand and exports in goods and
services and despite a decrease in hydrocarbons exports. Imports decrease (-0.16%) due to the development of domestic production mainly food production. Finally, the removal of subsidies has a positive impact on the Algerian economy as a whole.
7. Conclusion
Algerian agri-food products and more particularly wheat markets have experienced a strong government intervention. Over time, consumer prices support has emerged as the preferred mechanism of the government, to ensure food security of the population. In this article, we are particularly interested in the wheat domestic market; we analyze the impact of a consumer subsidies reform of the Algerian wheat market on household consumption and welfare. To do this, we have built a social accounting matrix for the Algerian economy on the 2009 data. The starting point was the EXTER matrix proposed by Martin et al. (2001). The SAM includes one household category, 21 categories of goods and services and two factors of production. It is clear that the level of disaggregation is quite limited; it is due to the lack of more detailed data. From what we could, we produced an imbalanced SAM for 2009, to which we applied the RAS balancing method. Then, we present the main characteristics and structure of a computable general equilibrium model for the Algerian economy. It is static version calibrated on a social accounting matrix for 2009. The CGE model proposed in this paper shows the level of disaggregation of the SAM for 2009, it is a fairly comprehensive model, reproducing as closely as possible the functioning of the Algerian economy. To this end, and due to the nature of their functioning, some sectors have received a special treatment: the oil sector, the public sector and the wheat market. In the end, we simulate a total removal of consumer subsidies and reinjection of their total amount as direct transfer to households. Analysis of the results shows a decrease in the consumption of wheat following the increase in its domestic price, while the consumption of other agricultural products increases. Food consumption as a whole greatly increases, due to the increase in household income, caused by the redistribution of subsidies. The elimination of market distorting measures following this reform has produced an increase in government income and public savings, added to this, a
welfare gain is observed on the economy as a whole. This shows that taking simultaneously into account the free-market pricing of wheat, and the transfer of subsidies to households is more efficient than the previous system of price support. Consequently, the impact of possible wheat domestic price liberalization would not necessarily be harmful to the population, as potential food security risk would be moderated.
8. References
Badri, N.G., Aguiar, A., McDougall, R.B, Hertel, T. (2008). GTAP 7 Data Base Documentation - Chapter 14: Behavioral Parameters. Center for Global Trade Analysis, Purdue University.
Bchir, M.H., Decreux, Y., Guérin, J.L. et al. (2002). MIRAGE, A CGE Model for Trade Policy Analysis, CEPII Working Paper 2002-17, Paris.
Bencharif, A, Rastoin, J.L. (2006). Libéralisation commercial agricole et pays en voie de développement : des effets attendus aux impacts effectifs, Séminaire Acralenos II, GDR CNRS EMMA-CEPALC, Santiago, Chile, 9-10 November 2006.
Brockmeier, M. (2001). A Graphical Exposition of the GTAP Model, GTAP Technical Paper No.8, Center for Global Trade Analysis, Purdue University.
Chehat, F. (2010). La filière des blés en Algérie Analyse macro et méso économique. Research Report. PAMLIM-CIHEAM-IAMM, Mars 2010.
Djermoun, A. (2009). La production céréalière en Algérie: les principales caractéristiques, Revue Nature et Technologie, n° 01/Juin 2009. Pages 45 à 53.
Fofana, I., Lemelin, A., Cockburn, J. (2005). Balancing a Social Accounting Matrix: Theory and Application. Working paper, Centre Interuniversitaire sur le Risque les Politiques Economiques et L’Emploi (CIRPEE), Université Laval, ville de Québec, August 2005.
Gharibnavaz, M.R., Waschik, R. (2012). A General Equilibrium Analysis of Alternative Scenarios for Food and Energy Subsidy Reforms in Iran, 15th GTAP Conference paper, Geneva, 27-29 June 2012.
Hamadache, H. (2009). Le syndrome hollandais et le secteur agricole en Algérie. CIHEAM Master Thesis, IAMM of Montpellier, July 2009.
Karam, F., Decaluwé, B. (2007). Les effets de la migration sur le chômage marocain: une analyse en équilibre général calculable statique, CES Working Paper 2007.16, Centre d’Economie de la Sorbonne, Paris, October 2007.
Keuning, S.J, De Ruijter, W.A. (1988). Guidelines to the construction of a Social Accounting Matrix. Review of Income and Wealth, 34(1), 71-100.
Löfgren, H, El-Said, M. (1999). A General Equilibrium Analysis of Alternative Scenarios for Food Subsidy Reform in Egypt, TMD discussion paper no°48, International Food Policy Research Institute, Washington D.C, September 1999.
Lofgren, H., Harris, R.L., Robinson, S. (2002). A standard computable general equilibrium (CGE) model in GAMS. International Food Policy Research Institute (IFPRI), Washington DC.
Martins, A., Decaluwé, B., Savard, L. (2001). La politique économique du développement et les modèles d’équilibre général calculable. Les presses de l’université de Montréal, Montréal, Canada, 509p.
Oukaci, K., Kherbachi, H. (2008). Impact de la libéralisation commerciale sur l’intégration et le développement de l’économie algérienne : évaluation par un modèle d’équilibre général calculable, les cahiers du CREAD n°83-84/2008.
Robichaud, V. (2001). Calculating Equivalent and Compensating Variations in CGE Models, Research note, Partnership for Economic Policy, Université Laval, Québec City, July 2001. Robinson, S., Cattaneo A., El-Said, M. (1998). Estimating a Social Accounting Matrix Using Cross Entropy Methods”, Discussion Paper No 33, IFPRI, Washington DC.
Robinson, S., El-Said, M. (2000). GAMS Code for Estimating a Social Accounting Matrix (SAM) Using Cross Entropy (CE) Methods, Discussion Paper No 64, IFPRI, Washington DC. Sadibou Fall, C. (2010). Une Matrice de Comptabilité Sociale du Sénégal pour l'année 2006, Centre D'analyse Théorique et de Traitement des données économiques (CATT), Université de Pau et des pays de l'Adour, Working Papers. Novembre 2010.
Sassi, Y. (2007). Transformation des cereals, Research Report, l’agence national de développement de la PME, January- March 2007.
Touitou, M. (2014). The Multidimensional Impacts of External Price Shocks on the Algerian Economy by using of CGEM, Developing Country Studies, Vol.4, No.1, 2014, Page 13-23.
Van Tongeren, F, Van Meijl, H, Surry, Y. (2001). Global models applied to agricultural and trade policies: a review and assessment, Agricultural Economics 26 (2001) 149–172.
9. Appendix
Table A1. List of sectors and corresponding acronyms Acronyms AGR WATER HYD PSPW MAS ISMME BUIMAT CPW CHEMI FA TEXT LEATHER WOOD OTIND TRANS COMM HOT ENTSER HOUSER FININ RSA NMSER Sectors Agriculture Water and energy Hydrocarbons
Petroleum Services and Public Works Mining and stone-pit
Steel industry and metallurgy Building Materials
Construction and Public Works Plastic and Chemicals
Agrofood industries Textiles
Leather and shoes Wood and paper Other industries
Transport and Communication Small businesses
Hotel and restaurant Enterprise services House Services Financial Institutions Real estate affairs
Table A5. Share in the output of the industry
Agriculture Oil Industry Service
Added Value 79 % 73 % 43 % 74%
Intermediate Consumption 21 % 27 % 57 % 26% Source: author's calculation based on the SAM 2009
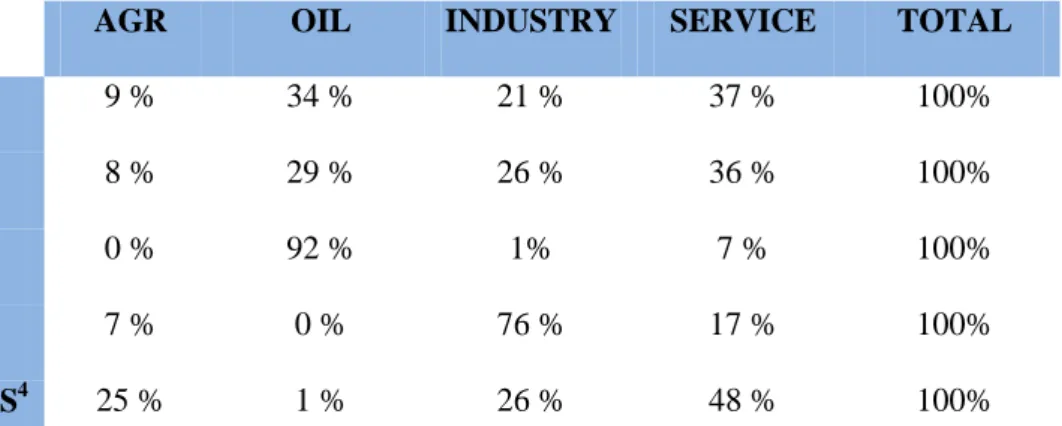
Table A6. Sector share in GDP, output, export, import and households’ consumption
AGR OIL INDUSTRY SERVICE TOTAL
GDP 9 % 34 % 21 % 37 % 100%
OUTPUT 8 % 29 % 26 % 36 % 100%
EXPORT 0 % 92 % 1% 7 % 100%
IMPORT 7 % 0 % 76 % 17 % 100%
CONSO.HOUS4 25 % 1 % 26 % 48 % 100%
Source: author's calculation based on the SAM 2009
Table A3. The composition of institutions’ income: TAXES
L K HC TRANSFER OIL NON-OIL IM TOT
HC 43.7% 53.7% 0.1% 2.5% 100%
ENT 0.0% 94.6% 0.0 % 5.4 % 100%
GOV 0.0% 1.4 % 15.1% 4.2% 47.6% 31.9% 100%
ROW 0.0% 0.0% 0.2% 26.8% 0.0% 73% 100%
Source: author's calculation based on the SAM 2009
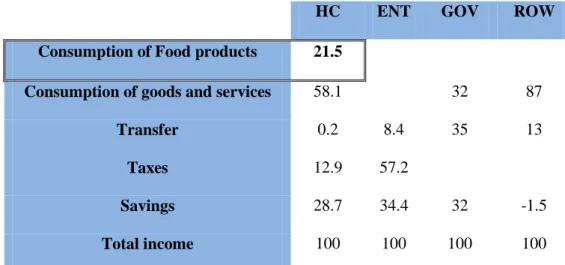
Table A4. The composition of institutions’ expenditure
HC ENT GOV ROW
Consumption of Food products 21.5
Consumption of goods and services 58.1 32 87
Transfer 0.2 8.4 35 13
Taxes 12.9 57.2
Savings 28.7 34.4 32 -1.5
Total income 100 100 100 100