HAL Id: hal-01416667
https://hal.archives-ouvertes.fr/hal-01416667
Preprint submitted on 14 Dec 2016
HAL is a multi-disciplinary open access
archive for the deposit and dissemination of
sci-entific research documents, whether they are
pub-lished or not. The documents may come from
teaching and research institutions in France or
abroad, or from public or private research centers.
L’archive ouverte pluridisciplinaire HAL, est
destinée au dépôt et à la diffusion de documents
scientifiques de niveau recherche, publiés ou non,
émanant des établissements d’enseignement et de
recherche français ou étrangers, des laboratoires
publics ou privés.
Combining both quantum mechanics and Hierarchical
Organisation of Spherical Environments for natural
products 2D NMR spectra simulation
Sergio Ortiz, Mustapha-Kamel Dali-Yahia, Raphäel Grougnet, Yannick
Estevez, Sylvie Michel, Sabrina Boutefnouchet, Grégory Genta-Jouve
To cite this version:
Sergio Ortiz, Mustapha-Kamel Dali-Yahia, Raphäel Grougnet, Yannick Estevez, Sylvie Michel, et al..
Combining both quantum mechanics and Hierarchical Organisation of Spherical Environments for
natural products 2D NMR spectra simulation. 2016. �hal-01416667�
Combining both quantum mechanics and
Hierarchical Organisation of Spherical Environments
for natural products 2D NMR spectra simulation
Sergio Ortiz
1, Mustapha-Kamel Dali-Yahia
1,2, Rapha ¨el Grougnet
1, Yannick Estevez
3, Sylvie
Michel
1, Sabrina Boutefnouchet
1and Gr ´egory Genta-Jouve
1*
Abstract
Structure elucidation of unknown compounds has been the task of natural products chemists for a long time and their approach seems to be the most efficient when it comes to identification. Very recently, Kokkotou et al. proposed a work-flow based on an integrative approach for new metabolite identification. This approach, including prediction of 2D NMR HSQC spectra, demonstrated the necessity for implementation of new algorithms leading to the prediction of 2D NMR spectra. Herein we present a method based on both quantum mechanics (QM) and Hierarchical Organisation of Spherical Environments (HOSE) of the prediction 2D NMR spectra.
Keywords
DFT GIAO — HOSE — NMR prediction — seco-tanapartholide A — natural products
1Laboratoire de Pharmacognosie et de Chimie des Substances Naturelles, UMR CNRS 8638 COMETE, Universit ´e Paris Descartes Sorbonne
Paris-Cit ´e, 4 Avenue de l’Observatoire 75006 Paris, France
2D ´epartement de Pharmacie, Universit ´e de Tlemcen, BP 119, 13000, Tlemcen, Algeria
3CNRS, UMR EcoFoG, (AgroParisTech, Cirad, Inra, Universit ´e des Antilles -Universit ´e de Guyane) Kourou, French Guiana, France
*Corresponding author: gregory.genta-jouve@parisdescartes.fr
Introduction
Identification of small molecules, such as metabolites, re-mains a difficult task [1,2]. It is one of the largest challenges in chemistry today and has even been considered as the main bottleneck in metabolomics for the last decade [3,4]. Struc-ture elucidation of unknown compounds has been the task of natural products chemists for a long time and their approach seems to be the most efficient when it comes to identification [5,6]. The main problem of the natural products approach is that it is time consuming. Indeed, the isolation and characteri-sation of a new compound is usually performed within months as it requires a sufficient amount of a pure compound to be successful. In the last decade, several hyphenated approaches have been proposed to overcome this issue, mainly using high performance liquid chromatography coupled to mass spec-trometry (LC-MS) [7,8,9]. Very recently, Kokkotou et al. proposed a work-flow based on an integrative approach for new metabolite identification [10]. This approach, including prediction of 2D NMR HSQC spectra, demonstrated the ne-cessity for implementation of new algorithms leading to the prediction of 2D NMR spectra.
Herein we present a method based on both quantum me-chanics (QM) and Hierarchical Organisation of Spherical Environments (HOSE) of the prediction 2D NMR spectra. We don’t intend to describe here the theory of NMR calculations (DFT or HOSE), for more information, the reader are encour-aged to look over [11] for an overview of the DFT calculations
and [12] for an HOSE description. The main difference be-tween the two approaches is time. While computation of hundreds of spectra can be done in less than a second using HOSE, several hours are required for the calculation using DFT. The main steps involved in NMR calculation using DFT have been well described by Willoughby et al. [13] and in-clude a geometry optimization (of each conformer) followed by a frequency calculation. The NMR properties are then calculated (for each conformer) and the chemical shifts are computed using the Boltzmann equation.
In the current approach, the simulation of the 2D NMR spectra is based on the package Spinach [14]. The focus of the present work will be on 2D NMR spectra as several ap-proaches already exist for the prediction of accurate 1D NMR spectra [15,16]. The magnetic parameters are computed with Gaussian 09 [17] (coordinates, g-tensor, hyperfine coupling tensors, chemical shielding tensors, scalar couplings) and nmr-shiftdb2 [18] (chemical shifts). To illustrate the methodology, the method has been tested on two compounds, caffeic acid (1) which is ubiquitous in plants and seco-tanapartholide A (2), a sesquiterpene lactone isolated from the aerial parts of Pentzia monodianaMaire (1929) (Asteracea)[19]:
1. Experimental Section
1.1 General
1H and13C NMR experiments were performed in
Combining both quantum mechanics and Hierarchical Organisation of Spherical Environments for natural products 2D NMR spectra simulation — 2/6 6 4 5 3 2 1 OH O HO HO 44 55 11 22 33 66 O 1111 12 12 77 15 15 HO 88 99 10 10 O 14 14 O 13 13 O 1 2 1’ 2’ 3’
equipped with a 5 mm inverse probe (Auto X PGF 1H/15N-13C) for compound 1 and on a Bruker AC a Bruker 400 MHz spectrometer (Wissembourg, France) for compound 2. MS experiments were performed on a mass spectrometer ZQ 2000 Waters (Saint-Quentin, France). The ESI source conditions were capillary cone voltage 50 V in positive mode, spray volt-age 3.4 kV. Column silica gel 60 0.025-0.04 mm (Macherey-Nagel GmbH & Co.) was used for column chromatography (CC). Analytical HPLC were performed on LaChrom Elite ap-paratus provided by VWR (Fontenay-sous-Bois, France) with a D-7000 interface, a L-7200 autosampler, a L-7100 pump, a L-7400 UV detector and running on EZChrom Elite 3.3 soft-ware. ODS reverse phase column (Phenomenex, 150 mm×4.6 mm, 5 µm) was used for analysis. Preparative HPLC were performed on a AP-MOD-100 apparatus provided by Armen Instrument (Saint-Av´e, France), injector Vanne Rheodyne 3725-038 inox, column PursuitTMVarian with reverse phase (250 mm×30 mm, 10 µm), detector B¨uchi UV/VIS Filter-photometer, integrator Merck D-2500, collector B¨uchi C-660. High pressure extractions were performed on a Speed Extrac-tor E-914 apparatus provided by B¨uchi (Fawil, Switzerland) equipped with four cells (120 mL) and a collector with four flat bottom vials (220 mL). Maximum pressure and tempera-ture can be adjusted from 50 to 150 bar and from 30 to 200
◦C, respectively. CPC was performed on a SCPC-250+1000B
apparatus provided by Armen Instrument (Sain-Av´e, France) fitted with two rotors, containing respectively 1953 or 2016 twin-cells. Rotation speed can be adjusted from 0 to 3000 rpm for the 250 mL rotor and from 0 to 1500 rpm for the 1 L rotor. A valve incorporated in the CPC apparatus allowed operation in ascending or descending mode. Fractions were collected by a B¨uchi 684 collector (Flawil, Switzerland). The experiments were conducted at room temperature. All the reagents and solvents were purchased from Carlo Erba-SDS. Cyclohexane and EtOAc were distilled before use. Water was distilled from deionized water. TLC were performed on Merck silica-gel 60 F254aluminum sheets, using vanillin/H2SO4as spray reagent.
1.2 NMR acquisition parameters
For compound 1: The pulse conditions were as follows: spec-trometer frequency (SF) 399.83 MHz (1H) and 100.55 MHz
(13C) , acquisition time(AQ) 0.624 s, relaxation delay (RD) 2.0 s, spectral width 3205.1 (1H) and 20105.6 (13C, a
one-bond coupling constant of 145.0 Hz, ns = 4. For compound 2: (SF) 400.13 MHz (1H) and 100.61 MHz (13C) , acquisition
time(AQ) 0.319 s, relaxation delay (RD) 1.5 s, spectral width 3205.1 (1H) and 16103.1 (13C, a one-bond coupling constant of 145.0 Hz, ns = 2.
1.3 Plant material
Aerial parts of Pentzia monodiana were collected in National Park Hoggar (Algeria), in April 2011. A voucher specimen (voucher N◦PM-tmp-002415) was deposited in the herbar-ium of the department of Pharmacognosy, University Paris Descartes, France.
1.4 Seco-tanapartholide extraction and isolation
A sample of 557 g of aerial part of P. monodiana were mixed with sand (500 g). Extraction cells were filled with the mixture and charged in the apparatus. Extraction program consisted in two distinct cycles of 20 min with ethyl acetate. Each cycle comprised a pre-heat period of 5 min, pumping of ethyl acetate through the extraction cell unit with a final pressure of 100 bar, a hold-on time fixed at 5 min and a final flush of acetate extract into the corresponding vial. The extracts were concentrated under reduced pressure affording 42.72 g of ethyl acetate extract. A sample of 10 g of ethyl acetate extract was applied to a silica gel column with a gradient of cyclohexane/EtOAc (100:0, 80:20, 70:30, 60:40, 50:50, 40:60, 30:70, 20:80 and 10:90, v/v) to give 32 fractions. The fractions 17 to 22 (F17-22) were pooled on the basis of TLC profiles to perform a CPC procedure. The chosen tertiary and quaternary solvent systems containing cyclohexane/EtOAc/MeOH/H2O
(1/4/1/4, S1 v/v) and EtOAc/THF/H2O (4/2/5, S2 v/v) were
prepared by mixing the solvent. The resulting phases were separated just before use. The upper phases were used as the mobile phases, whereas the lower phases were employed as the stationary phases. A sample of 400 mg of F17-22 was dissolved in a 1:1 (v/v) mixture of the biphasic system of S1. The separation was performed in ascending mode on 250 mL rotor, flow rate of 5 mL min−1at 1600 rpm. A total volume of 1.5 L of mobile phase was collected in fractions of 10 mL. Then the extrusion step was initiated in ascending mode using the lower phase as the mobile phase to ensure that any residual extract was recovered. Compound 1 was isolated from fractions 16 to 20 (23 mg).
1.5 Magnetic properties calculations
All density functional theory (DFT) have been performed us-ing the Gaussian 09W package [17] and the B3LYP functional at the 6-311+g(d,p) levels of theory. Structure optimisation was followed with frequency calculation in order to check the absence of imaginary modes. Calculations of the magnetic properties (coordinates, g-tensor, hyperfine coupling tensors, chemical shielding tensors, scalar couplings) have been per-formed on the optimized conformer. The resulting set of tensor values were converted to chemical shifts by subtracting the shielding tensor value of tetramethylsilane (TMS) at the same level of theory. HOSE chemical shifts prediction was
realised thanks to nmrshiftdb2[20,21] using the DFT opti-mised tridimentional structure as input (.mol). NMR spectra were plotted using the Spinach 1.6 toolbox [14] running in the Matlab environment.R
2. Results and Discussion
In order to demonstrate the efficiency of the proposed method-ology on a natural product, the whole work-flow was first applied to one of the most ubiquitous compound in plants: caffeic acid (1) and then to seco-tanapartholide A (2). While commercial caffeic acid (1) was used, the phytochemical in-vestigation of the aerial parts of P. monodiana was undertaken to obtain compound 2. After extraction of the plant material with ethyl acetate under pressure (100 bar), a first fractiona-tion on silica gel was performed, this step was then followed by a CPC separation that yielded seco-tanapartholide A (1). After acquisition of1H-13C HSQC spectrum of 1, the predic-tion of the different magnetic parameters was performed using both GIAO DFT (coordinates, g-tensor, hyperfine coupling tensors, chemical shielding tensors and scalar couplings) and the HOSE prediction (chemical shifts). In table1are sum-marized the experimental and predicted chemical shifts and couplings for compound 1 and 2.
Case study 1: caffeic acid (1) In order to evaluate how close the chemical shifts predictions were to the experimental data, the mean absolute error (MAE) and the corrected mean average error (CMAE) were calculated. As expressed in table 1, both1H and13C MAE values for the HOSE prediction were smaller from those obtained using DFT (MAE1H= 0.08 and
CMAE13C= 1.94). Those results were also confirmed by the
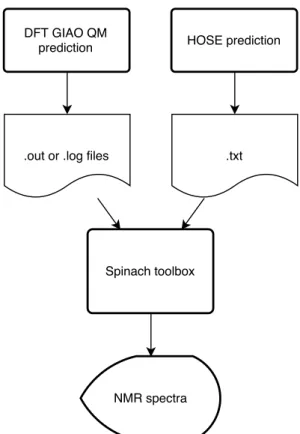
CMAE values (0.016 and 0.21 for1H and13C respectively). A simulation of the HSQC spectrum was then performed to compare the both DFT and HOSE-DFT combined spectra. The current version of the Spinach toolbox[14] is able to read Gaussian 09 outputs file (.out or .log) in order to get the parameters values needed for the NMR spectrum computa-tion. At this step it was then possible to introduce the full chemical shift tensors (in ppm) predicted using the HOSE pre-diction and imported as a .txt file. The overall work-flow is described below (Figure1).
The HSQC simulations are presented in the figure2. Cross-peaks between 1H and 13C for the HOSE values are not rep-resented on figure2as no peak intensity and resolution were generated from this method. As expected from the values presented in table1, a relatively good agreement was obtained between experimental HSQC spectrum and both simulated spectra. Only two protons were clearly separated from the experimental for the DFT prediction (H-2 and H-9 at δH5.8
and 6.4 ppm instead of 6.22 and 6.78 ppm). On the other hand, only two signals corresponding to one proton (H-9 at δH 6.67 ppm) were clear separated from the experimental
spectrum. This example clearly demonstrated the assets of the method. In order to test the validity of the method on another natural product, calculations were undertaken for a
Figure 1.Global work-flow used for the NMR spectra prediction.
sesquiterpene lactone isolated from the aerial parts of Pentzia monodiana. F2: 1H chemical shift / ppm 5.5 6 6.5 7 7.5 8 F1: 13C chemical shift / ppm 110 115 120 125 130 135 140 145 150 155 160 Experimental DFT HOSE and DFT combined
OH O
HO HO
Figure 2.Overlapping of the experimental and predicted HSQC spectra of compound 1 (full scale available in SI).
Case study 2: seco-tanapartholide A (2) In the present ex-ample, DFT predictions for13C shielding tensors were more accurate than the ones obtained using the HOSE algorithm, as MAE values were smaller, 2.91 and and 4.11 ppm for DFT and HOSE respectively. Nonetheless, it is well known that quan-tum mechanical methods (QM) give quite frequently larger MAE’s [22]. This last assumption was confirmed by looking at the1H shielding tensors predictions. Indeed, MAE’s values were greater for the DFT (0.36) than for HOSE (0.26). To
Combining both quantum mechanics and Hierarchical Organisation of Spherical Environments for natural products 2D NMR spectra simulation — 4/6 Table 1.1H and13C NMR data for compound 1 and 2
Experimental Predicted Experimental Predicted
DFT HOSE DFT HOSE position 1H 13C 1H 13C 1H 13C position 1H 13C 1H 13C 1H 13C 1 - 127.9 - 133.9 - 128.0 1 - 207.9 - 209.7 - 209.4 2 7.02 114.7 7.1 116.2 6.27 115.2 2 6.07 133.0 6.33 138.6 6.11 132.5 3 - 146.8 - 150.0 7.45 145.9 3 7.48 168.9 6.76 174.3 7.21 156.2 4 - 147.2 - 151.4 - 146.5 4 - 79.5 - 83.70 - 66.9 5 6.94 122.4 7.1 126.1 7.06 117.2 5 2.69 59.1 2.78 62.53 1.91 70.2 6 6.78 116.1 6.4 119.9 - 123.2 6 4.46 82.5 4.72 83.42 4.38 74.1 1’ 7.53 146.5 7.8 155.2 - 144.9 7 3.46 41.9 2.57 44.31 3.32 45.7 2’ 6.22 115.4 5.8 114.6 6.82 116.5 8 1.89 28.9 1.55 29.43 1.98 25.2 3’ - 171.2 - 166.6 6.67 171.5 9 2.60 42.0 2.43 37.29 2.25 42.7 MAE 0.23 4.05 0.08 1.94 10 - 210.7 - 212.9 - 207.7 CMAE 0.047 0.45 0.016 0.21 11 - 140.9 - 148.6 - 138.2 12 - 168,9 - 172.9 - 170 13a 6.36 123,0 5.81 123.6 6.35 119.9 13b 5.78 6.83 5.31 14 2.21 28.8 2.1 31.6 1.91 27 15 1.58 27.2 1.28 27.0 1.19 28.9 MAE 0.43 3.1 0.26 4.56 CMAE 0.03 0.19 0.02 0.29
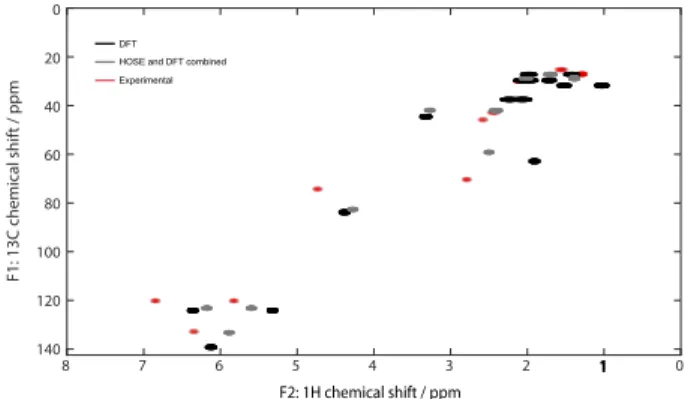
illustrate the values presented in table 1, the prediction of the HSQC spectra of compound 2 was conducted and was presented below. As illustrated on figure3, an overall good agreement was observed between the predicted and the ex-perimental spectra with a higher degree of similarity for the QM predicted spectrum as expected after calculation of the accuracy (see Table1). However, a disparity was observed between the predicted and the experimental spectra for the equivalent protons (methyls or linear methylenes). For in-stance, the three H-14 protons (methyl) are represented as mutliple signals at δH2.08, 1.95 and 1.71 ppm while on the
experimental, only one cross peak was observed at δH 2.10
ppm. 0 2 3 4 5 6 7 8 F1: 13C chemical shift / ppm 0 20 40 60 80 100 120 140 F2: 1H chemical shift / ppm 1 DFT HOSE and DFT combined Experimental
Figure 3.Overlapping of the experimental and predicted HSQC spectra of compound 2 (full scale available in SI).
To overcome this problem, the DFT GIAO full chemi-cal shift tensors can be replace by empirichemi-cal chemi-calculated ones (obtained using the HOSE code) and then submitted to the Spinach toolbox. While the full chemical shift tensors (in ppm) were read from the Gaussian output files (.out or .log), Zeeman interactions may also be specified as scalars[14] and read from a .txt file using a short home made script. In the present case, hybridisation of both methods gave a slightly less accurate spectrum in term of chemical shifts, especially
for the down-shielded signals at δH6.11 6.34 and 7.21 ppm.
But one important improvement relied in the fact that the number of cross peaks observed on the HSQC spectrum fitted perfectly with the experimental spectrum (Figure3). This last point was highlighted by Roussis’ group in a recent paper in which they use HSQC spectra for dereplication purposes of the red alga Laurencia[10]. Using this method enabled the prediction of HSQC spectra but also any kind of 2D NMR spectra such NOESY, HMQC or HMBC as it relies on the Spinach toolbox formalism[23]. Dereplication strategies us-ing pattern recognition of NMR spectra have been thoroughly studied in the last decade[24,25] and the proposed strategy is another tool available to the natural products chemists.
Acknowledgments
The authors want to thank l’Office du Parc National de l’Ahaggar (OPNA, Alg´erie for field collection. The authors are grateful to the University Paris Descartes for financial support.
References
[1] Nadja Bross-Walch, Till K¨uhn, Detlef Moskau, and
Oliver Zerbe. Strategies and tools for structure deter-mination of natural products using modern methods of nmr spectroscopy. Chemistry & Biodiversity, 2(2):147– 177, 2005.
[2] Thomas Hoffmann, Daniel Krug, Stephan H¨uttel, and
Rolf M¨uller. Improving natural products identifica-tion through targeted lc-ms/ms in an untargeted sec-ondary metabolomics workflow. Analytical Chemistry, 86(21):10780–10788, 2014.
[3] Steffen Neumann and Sebastian B¨ocker. Computational
mass spectrometry for metabolomics: Identification of metabolites and small molecules. Analytical and Bioana-lytical Chemistry, 398(7-8):2779–2788, 2010.
[4] Reza Salek, Christoph Steinbeck, Mark Viant, Royston
standards for metabolite annotation and identification in metabolomic studies. GigaScience, 2(1):13, 2013.
[5] John W. Blunt, Brent R. Copp, Robert A. Keyzers,
Mur-ray H. G. Munro, and Michele R. Prinsep. Marine natural products. Nat. Prod. Rep., 31:160–258, 2014.
[6] Lloyd W. Sumner, Zhentian Lei, Basil J. Nikolau, and
Kazuki Saito. Modern plant metabolomics: advanced natural product gene discoveries, improved technologies, and future prospects. Nat. Prod. Rep., pages 212–229, 2015.
[7] Cristiano S. Funari, Philippe J. Eugster, Sophie Martel,
Pierre-Alain Carrupt, Jean-Luc Wolfender, and Dulce Helena S. Silva. High resolution ultra high pressure liquid chromatography-time-of-flight mass spectrome-try dereplication strategy for the metabolite profiling of brazilian lippia species. Journal of Chromatography A, 1259(0):167 – 178, 2012.
[8] Kerstin Scheubert, Franziska Hufsky, and Sebastian
Bocker. Computational mass spectrometry for small molecules. Journal of Cheminformatics, 5(1):12, 2013.
[9] Jean-Luc Wolfender, Guillaume Marti, Aur´elien Thomas,
and Samuel Bertrand. Current approaches and challenges for the metabolite profiling of complex natural extracts. Journal of Chromatography A, 0(0):136 –164, 2014.
[10] Katerina Kokkotou, Efstathia Ioannou, Marianna
Nomikou, Florian Pitterl, Ariadni Vonaparti, Eleni Siapi, Maria Zervou, and Vassilios Roussis. An integrated ap-proach using uhplc-pda-hrms and 2d hsqc nmr for the metabolic profiling of the red alga Laurencia: Derepli-cation and tracing of natural products. Phytochemistry, 0(0):–, 2014.
[11] Density functional calculations of nmr chemical shifts
and esr g-tensors. Theoretical Chemistry Accounts, 99(2):71–82, 1998.
[12] W. Bremser. Hose — a novel substructure code. Analytica
Chimica Acta, 103(4):355 – 365, 1978.
[13] Patrick H. Willoughby, Matthew J. Jansma, and
Thomas R. Hoye. A guide to small-molecule structure assignment through computation of (1h and13c) nmr chemical shifts. Nat. Protocols, 9(3):643–660, 2014.
[14] H.J. Hogben, M. Krzystyniak, G.T.P. Charnock, P.J. Hore,
and Ilya Kuprov. Spinach - a software library for simula-tion of spin dynamics in large spin systems. Journal of Magnetic Resonance, 208(2):179 – 194, 2011.
[15] Yuri Binev and Joao Aires-de Sousa. Structure-based
predictions of1h nmr chemical shifts using feed-forward
neural networks. Journal of Chemical Information and Computer Sciences, 44(3):940–945, 2004.
[16] Yuri Binev, Maria M. B. Marques, and Joao Aires-de
Sousa. Prediction of1h nmr coupling constants with asso-ciative neural networks trained for chemical shifts.
Jour-nal of Chemical Information and Modeling, 47(6):2089– 2097, 2007.
[17] M. J. Frisch, G. W. Trucks, H. B. Schlegel, G. E. Scuseria,
M. A. Robb, J. R. Cheeseman, G. Scalmani, V. Barone, B. Mennucci, G. A. Petersson, H. Nakatsuji, M. Cari-cato, X. Li, H. P. Hratchian, A. F. Izmaylov, J. Bloino, G. Zheng, J. L. Sonnenberg, M. Hada, M. Ehara, K. Toy-ota, R. Fukuda, J. Hasegawa, M. Ishida, T. Nakajima, Y. Honda, O. Kitao, H. Nakai, T. Vreven, J. A. Mont-gomery, Jr., J. E. Peralta, F. Ogliaro, M. Bearpark, J. J. Heyd, E. Brothers, K. N. Kudin, V. N. Staroverov, R. Kobayashi, J. Normand, K. Raghavachari, A. Ren-dell, J. C. Burant, S. S. Iyengar, J. Tomasi, M. Cossi, N. Rega, J. M. Millam, M. Klene, J. E. Knox, J. B. Cross, V. Bakken, C. Adamo, J. Jaramillo, R. Gomperts, R. E. Stratmann, O. Yazyev, A. J. Austin, R. Cammi, C. Pomelli, J. W. Ochterski, R. L. Martin, K. Morokuma, V. G. Zakrzewski, G. A. Voth, P. Salvador, J. J. Dan-nenberg, S. Dapprich, A. D. Daniels, ¨O. Farkas, J. B. Foresman, J. V. Ortiz, J. Cioslowski, and D. J. Fox. Gaus-sian 09 Revision D.01. GausGaus-sian Inc. Wallingford CT 2009.
[18] Stefan Kuhn, Nils Schlorer, Heinz Kolshorn, and Raphael
Stoll. From chemical shift data through prediction to assignment and NMR LIMS - multiple functionalities of nmrshiftdb2. Journal of Cheminformatics, 4(Suppl 1):P52, 2012.
[19] Paul Ozenda. Flore et v´eg´etation du Sahara. CNRS
Editions, 2004.
[20] Stefan Kuhn and Nils E. Schl¨orer. Facilitating quality
con-trol for spectra assignments of small organic molecules: nmrshiftdb2 – a free in-house nmr database with inte-grated lims for academic service laboratories. Magnetic Resonance in Chemistry, 53(8), 2015.
[21] Christoph Steinbeck, Stefan Krause, and Stefan Kuhn.
Nmrshiftdbconstructing a free chemical information sys-tem with open-source components. Journal of Chemical Information and Computer Sciences, 43(6):1733–1739, 2003.
[22] Mikhail Elyashberg, Kirill Blinov, Yegor Smurnyy,
Ta-tiana Churanova, and Antony Williams. Empirical and dft giao quantum-mechanical methods of13c chemical shifts prediction: competitors or collaborators? Magnetic Resonance in Chemistry, 48(3), 2010.
[23] Luke J. Edwards, D.V. Savostyanov, Z.T. Welderufael,
Donghan Lee, and Ilya Kuprov. Quantum mechanical nmr simulation algorithm for protein-size spin systems. Journal of Magnetic Resonance, 243:107 – 113, 2014.
[24] Feng Qiu, James B. McAlpine, David C. Lankin, Ian
Bur-ton, Tobias Karakach, Shao-Nong Chen, and Guido F. Pauli. 2d nmr barcoding and differential analysis of complex mixtures for chemical identification: The
ac-Combining both quantum mechanics and Hierarchical Organisation of Spherical Environments for natural products 2D NMR spectra simulation — 6/6
taea triterpenes. Analytical Chemistry, 86(8):3964–3972, 2014.
[25] Jane Hubert, Jean-Marc Nuzillard, Sylvain Purson,
Mah-moud Hamzaoui, Nicolas Borie, Romain Reynaud, and Jean-Hugues Renault. Identification of natural metabo-lites in mixture: A pattern recognition strategy based on