HAL Id: hal-03192262
https://hal.inrae.fr/hal-03192262
Submitted on 7 Apr 2021
HAL is a multi-disciplinary open access archive for the deposit and dissemination of sci-entific research documents, whether they are pub-lished or not. The documents may come from teaching and research institutions in France or abroad, or from public or private research centers.
L’archive ouverte pluridisciplinaire HAL, est destinée au dépôt et à la diffusion de documents scientifiques de niveau recherche, publiés ou non, émanant des établissements d’enseignement et de recherche français ou étrangers, des laboratoires publics ou privés.
Valley fever virus in animals and humans in Mayotte,
2018–19
Younjung Kim, Raphaëlle Métras, Laure Dommergues, Chouanibou
Youssouffi, Soihibou Combo, Gilles Le Godais, Dirk Pfeiffer, Catherine
Cêtre-Sossah, Eric Cardinale, Laurent Filleul, et al.
To cite this version:
Younjung Kim, Raphaëlle Métras, Laure Dommergues, Chouanibou Youssouffi, Soihibou Combo, et al.. The role of livestock movements in the spread of Rift Valley fever virus in animals and humans in Mayotte, 2018–19. PLoS Neglected Tropical Diseases, Public Library of Science, 2021, 15 (3), pp.e0009202. �10.1371/journal.pntd.0009202�. �hal-03192262�
of Rift Valley fever virus in animals and
humans in Mayotte, 2018–19
Younjung KimID1*, Raphae¨lle Me´tras2, Laure DommerguesID3, Chouanibou Youssouffi4, Soihibou Combo5, Gilles Le Godais5, Dirk U. PfeifferID1,6, Catherine Cêtre-SossahID7,8, Eric CardinaleID7,8, Laurent FilleulID9, Hassani Youssouf9, Marion Subiros9,
Guillaume Fournie´ID6
1 Department of Infectious Diseases and Public Health, Jockey Club College of Veterinary Medicine and Life Sciences, City University of Hong Kong, Hong Kong, China, 2 INSERM, Sorbonne Universite´, Institut Pierre Louis d’E´ pide´miologie et de Sante´ Publique (UMRS-1136), Paris, France, 3 La Coope´ration Agricole, Paris, France, 4 GDS 976 Mayotte, Combani, France, 5 Direction de l’Alimentation, de l’Agriculture et de la Forêt de Mayotte, Mamoudzou, France, 6 Veterinary Epidemiology, Economics and Public Health group, Department of Pathobiology and Population Sciences, The Royal Veterinary College, Hatfield, United Kingdom, 7 CIRAD, UMR ASTRE, Sainte Clotilde, La Re´union, France, 8 ASTRE, CIRAD, Univ Montpellier, INRAE, Montpellier, France, 9 Sante´ Publique France, Mamoudzou, France
*younjung.kim@my.cityu.edu.hk
Abstract
Rift Valley fever (RVF) is a vector-borne viral disease of major animal and public health importance. In 2018–19, it caused an epidemic in both livestock and human populations of the island of Mayotte. Using Bayesian modelling approaches, we assessed the spatio-tem-poral pattern of RVF virus (RVFV) infection in livestock and human populations across the island, and factors shaping it. First, we assessed if (i) livestock movements, (ii) spatial prox-imity from communes with infected animals, and (iii) livestock density were associated with the temporal sequence of RVFV introduction into Mayotte communes’ livestock populations. Second, we assessed whether the rate of human infection was associated with (a) spatial proximity from and (b) livestock density of communes with infected animals. Our analyses showed that the temporal sequence of RVFV introduction into communes’ livestock popula-tions was associated with livestock movements and spatial proximity from communes with infected animals, with livestock movements being associated with the best model fit. More-over, the pattern of human cases was associated with their spatial proximity from com-munes with infected animals, with the risk of human infection sharply increasing if livestock in the same or close communes were infected. This study highlights the importance of understanding livestock movement networks in informing the design of risk-based RVF sur-veillance programs.
Author summary
Rift Valley fever (RVF) is a vector-borne zoonotic disease, endemic in many sub-Saharan Africa regions with substantial outbreaks. RVF virus (RVFV) is transmitted to animals
a1111111111 a1111111111 a1111111111 a1111111111 a1111111111 OPEN ACCESS
Citation: Kim Y, Me´tras R, Dommergues L,
Youssouffi C, Combo S, Le Godais G, et al. (2021) The role of livestock movements in the spread of Rift Valley fever virus in animals and humans in Mayotte, 2018–19. PLoS Negl Trop Dis 15(3): e0009202.https://doi.org/10.1371/journal. pntd.0009202
Editor: Brianna R. Beechler, Oregon State
University College of Veterinary Medicine, UNITED STATES
Received: July 16, 2020 Accepted: February 3, 2021 Published: March 8, 2021
Copyright:© 2021 Kim et al. This is an open access article distributed under the terms of the
Creative Commons Attribution License, which permits unrestricted use, distribution, and reproduction in any medium, provided the original author and source are credited.
Data Availability Statement: The livestock data
was collected under the Mayotte disease surveillance system (SESAM) with the approval of the Direction of Agriculture, Food, and Forestry of Mayotte. As far as human data are concerned, according to French law, only “research involving a human being” (as defined by articles L. 1121-1 and R.1121-1 of the Code de la Sante´ Publique) have to be approved by an ethics committee. This study was based on anonymous data collected from
primarily by the bite of infected mosquitos, whereas direct or indirect contact with infected animals forms the primary route of RVFV transmission to humans. In 2018–19, Mayotte, an archipelago in the Indian Ocean between Madagascar and the coast of East-ern Africa, experienced an RVF epidemic in both livestock and humans. In this study, we investigated factors shaping the spatio-temporal pattern of RVFV infection in livestock and human populations across Mayotte. The diffusion of RVFV through Mayotte’s live-stock population was associated with livelive-stock movements and, potentially to a lesser extent, spatial proximity from communes with infected animals. Moreover, the pressure of infection on humans was the highest if nearby livestock were infected. This study high-lights the value of accounting for the structure of livestock movement networks in the sur-veillance of zoonotic diseases at the human-animal interface, and the need for One Health approaches.
Introduction
Livestock movements are a major pathway for the spread of many infectious diseases, including those with zoonotic potential [1–3]. The structure of livestock movement networks has been analyzed to identify epidemiological units (e.g. farms and geographical areas) at high risk of becoming infected and spreading infection, and to inform the design of risk-based surveillance programs [4,5]. Targeting surveillance efforts towards those units would be expected to allow the early detection of infectious disease outbreaks, promoting their effective management [6]. However, compared to other livestock infectious diseases, our understanding of the role of livestock movements in the spread of Rift Valley fever (RVF) is limited. RVF is a vector-borne and zoonotic viral disease of major animal and public health importance. RVF virus (RVFV), a member of the genusPhlebovirus in the family Phenuiviridae, infects animals primarily by the
bite of infected mosquitos, whereas contact with infected animal blood, body fluids, or tissues forms the major route of RVFV transmission to humans [7]. RVFV is endemic in many sub-Saharan Africa regions and has been likely introduced into the island of Mayotte, a French department in the Mozambique Channel of the Indian Ocean, through the movements of peo-ple and animals from the Union of the Comoros [8] (Fig 1A). In the last ten years, Mayotte has experienced two RVF epidemics, in 2008–10 [9] and 2018–19 [10]. In the 2008–10 epidemic, RVFV antibody prevalence patterns suggested that the network of livestock movements influ-enced the spatial dissemination of the virus among the island’s livestock population [11]. Among the island’s 17 communes (i.e. administrative regions), in the early stage of the 2008– 10 epidemic, seroprevalence was significantly higher incentral communes, which formed a
group of communes densely connected via livestock movements, than inouter communes,
which were weakly connected with one another and received most livestock from central com-munes. Antibody prevalence in outer communes subsequently increased to the level experi-enced in central communes [11]. Livestock movements were not, however, explicitly modelled, and their potential contribution to RVFV dissemination was not quantified [11].
Several RVFV transmission models have provided useful insights into the contribution of different host species, vector and environmental factors to RVFV spread [12–17]. While some models used proxy measures (e.g. distance and livestock populations) to capture animal move-ment patterns [14,15], others were informed by animal movement survey data focusing on the role of cattle movements in maintaining viral circulation in RVFV-endemic livestock popula-tions [16,17]. However, none explored the role of livestock movements in RVFV dissemina-tion during an epidemic following its incursion into a susceptible populadissemina-tion by combining
health professionals for public health purposes relating to the health surveillance mission entrusted to Sante´ Publique France by the French Law (article L. 1413-1 Code de la Sante´ Publique). Therefore, the study did not require to be approved by an ethics committee. Furthermore, as the data were anonymous, it did not require to be authorized by the French data protection authority (Commission Nationale Informatique et Liberte´s). Animal and human data are available upon reasonable request and with the permission of the Direction of Agriculture, Food, and Forestry of Mayotte (daaf976@agriculture.gouv.fr) and Sante´ Publique France (data-mad@santepubliquefrance.fr), respectively.
Funding: The authors received no specific funding
for this work.
Competing interests: The authors have declared
both animal movement and epidemic case data. In particular, RVFV transmission models focusing on Mayotte have not considered the movements of livestock on the island. Addition-ally, although around half of human infections were estimated to have resulted from direct contact with infected animals during this 2018–19 epidemic [18], no studies have analyzed, so far, the potential implications of livestock movements for human infections based on both ani-mal and human epidemic case data.
In November 2018, RVFV re-emerged in Mayotte. Between November 2018 and August 2019, a total of 165 animals and 143 humans tested positive for RVFV [10,19]. Outbreaks in livestock affected 16 out of the island’s 17 communes, and human cases were reported in all communes. Such concurrent epidemics in livestock and humans provided a unique opportu-nity to explore the role of livestock movements in the 2018–19 RVF epidemic in both animals and humans, and the possible implications for risk-based surveillance and control programs. This study had two objectives. The first objective was to assess whether (i) livestock move-ments, (ii) spatial proximity from communes with infected animals, and (iii) livestock density were associated with the temporal sequence of RVFV introduction into communes’ livestock populations. The second objective was to assess whether the rate of human infection was asso-ciated with (a) spatial proximity from and (b) livestock density of communes with infected animals.
Methods
Data
Livestock and human case data for the 2018–19 Mayotte RVF epidemic were provided by the Veterinary Services of Mayotte, the CoopADEM (Coope´rative des Eleveurs de Mayotte), and Sante´ Publique France. Livestock referred to cattle, sheep, and goats. Farmers were sensitized to the disease and encouraged to report clinical signs suggestive of RVFV infection (e.g.
Fig 1. Geographical location of Mayotte (A) and its communes (B). In Fig 1B, communes were classified into central
(red) or outer (blue) communes based on their structural equivalence in the livestock movement network [11].
abortions or pyrexia) to the animal disease surveillance system (SESAM, Système d’e´pide´mio-surveillance animaleà Mayotte). Suspected livestock identified through this passive surveil-lance system were tested for RVFV by RT-PCR [20], and those that tested positive were defined as livestock cases of RVF. The proportion of farms with a declared veterinarian was only slightly higher in central (30.7%) than outer communes (26.6%) [21]. Also, due to the small size of the island (374km2), all farms in Mayotte were located less than one hour away, by car, from the nearest private veterinary practice (Dommergues, personal communication). This suggests that the coverage of veterinary services, and the level of underreporting were likely to be similar across the island. Human cases of RVF were individuals who tested positive by RT-PCR [20] following a consultation with a general practitioner for a dengue-like syn-drome. For each case, animal or human, the sampling date and the commune where the farm was located, or where the person was a resident, were recorded. While samples were collected from humans on the day of their medical consultation, samples were collected from animals within two weeks following the onset of clinical signs suggestive of an RVFV infection (Dom-mergues, personal communication).
We used livestock movement records for the period of 2007–14, since such data were not available for 2018–19. A previous analysis of these data showed that the yearly networks were strongly correlated with one another, suggesting that the overall structure of the Mayotte live-stock movement network was stable during that period [11]. Also, while the size of livestock populations in each commune likely varied over the past decade, the ranking of those com-munes according to their number of livestock was similar between the 2010 agricultural census [22] and a survey conducted in 2015 [23] (p = 0.015, Spearman’s rank correlationρ = 0.61).
Moreover, there was no livestock movement restriction during the epidemic. Therefore, assuming that the network structure remained stable over the following six years including the 2018–2019 epidemic, we computed the average daily number of livestock movements between communes in 2007–2014 and used it as an estimation of livestock movement patterns in 2018–2019. We also classified communes into one of two clusters (i.e. central or outer), based on their level of structural equivalence [24] (Fig 1B). Briefly, two communes were considered structurally equivalent if they received and sent the same number of animals from, and to, the same communes. We described the temporal changes in the number of livestock cases in each cluster. The size of the livestock population per commune was provided by the latest agricul-tural census conducted in 2010 [22], and for any two communes, the Euclidean distance between their geometric centroids was used as their geographical distance. There were on aver-age 1,751 livestock per commune (IQR: 1,019–1,876, Fig A inS1 Text), and the average live-stock density was 87.4/km2per commune (IQR: 41.8–202.3/km2), according to the 2010 agricultural census. Finally, we assessed variations in Normalized Difference Vegetation Index (NDVI) across the island, during the study period as a proxy of mosquito abundance since it reflects the level of vegetation and presence of water (i.e. conditions promoting mosquito pro-liferation) [25].
Models
Role of the Mayotte livestock movement network in the livestock epidemic. We
hypothesized that the structure of the Mayotte livestock movement network was associated with the temporal sequence of RVFV introduction into communes’ livestock populations. Yet, this temporal sequence could have also been influenced by the spatial proximity between com-munes, or the density of communes’ livestock populations. To test these hypotheses, we fitted 20 models simulating RVFV spread among communes’ livestock populations to the livestock case data. Under the baseline model formulations, RVFV spread among communes was
influenced by (i) livestock movements (‘livestock movement model for livestock infection’, Model L.1), (ii) spatial proximity from infected communes (‘spatial proximity model for live-stock infection’, Model L.2), (iii) livelive-stock density in communes (‘livelive-stock density model for livestock infection’, Model L.3), or (iv) none of those factors (‘null model’ with a constant background transmission rate, Model L.4). Model L.1 was further divided into the weighted (Model L.1.1) or unweighted (Model L.1.2) model, depending on whether it accounted for the number of animals moved between any two communes or not (4 + 1 = 5 models). Each of these 5 models was fitted with or without considering a delay between the viral incursion in a commune and viral transmission among its livestock (5× 2 = 10 models), and each of these 10 models was further evaluated assuming time-independent or time-dependent daily rates of infection (10× 2 = 20 models), as described below.
In the livestock movement (Models L.1.1 and L.1.2) and spatial proximity (Model L.2) models, the overall rate of infection (λi,d) exerted on the livestock population in communei on
dayd was modelled as:
li;d¼pi;dþq ð1Þ
pi,dwas the rate of infection resulting from communei’s relationship with communes whose
livestock populations were infected and infectious (‘livestock-infected communes’). In other words, it was the rate of infection resulting from introducing animals from livestock-infected communes (Models L.1.1 and L.1.2) or sharing borders with livestock-infected communes (Model L.2). In both models,q was the background rate of infection, which accounted for
other transmission routes (e.g. additional mosquito dissemination). We assumed that all com-munes were exposed to the same background infection rate, as suggested by NDVI spatiotem-poral patterns (Fig B inS1 Text).
In Models L.1.1 and L.1.2,pi,dwas expressed as:
pi;d ¼ c
X
j¼1;j6¼iðmi;jIj;dÞ ð2AÞ
ψ was the daily rate at which a commune became infected through the introduction of an
animal moved from a livestock-infected commune.μi,jwas informed by the 2007–14
live-stock movement data and expressed in two different ways. In the weighted model (Model L.1.1),μi,jwas the average daily number of animals moved from communej to commune i,
while in the unweighted model (Model L.1.2), it was the presence of animal movements between communes (i.e. if animals were moved from communej to commune i, μi,j= 1). Ij,d
was a variable indicating the infection status of communej on day d (i.e. 1 if infected,
other-wise 0).
In Model L.2,pi,dwas expressed as:
pi;d¼ s
X
j¼1;j6¼iðBi;jIj;dÞ ð2BÞ
σ was the daily rate at which communes sharing a border with livestock-infected communes
became infected. Bi,jwas a variable indicating whether communesi and j shared a border (1 if
shared, 0 otherwise). We considered that the two communes on the neighboring island, Petite-Terre, shared a border with the nearest commune on the main island, Grande-Petite-Terre, assuming that high levels of human movements between those communes [26] were associated with the movements of animals.
In Model L.3,λi,dwas assumed to increase with livestock density in communei (i.e. the
average number of animals per km2) (Li) to the power ofω:
li;d ¼qLio
ð2CÞ
Finally, in the null model (Model L.4),λi,d=q.
Under the baseline model formulations, a commune was assumed to have become infected and infectious on the day its first livestock case was sampled, and daily rates of infec-tion were fixed during the entire epidemic (‘time-independent models’). Alternative model formulations were also considered in order to account for a possible lag between the intro-duction of RVFV into a commune and its transmission to susceptible animals (‘time-lag models’), and temporal variations in infection rates due to changes in mosquito abundance (‘time-dependent models’). For the time-lag models, we assumed that a commune became infected 5 weeks and infectious 2 weeks before the day its first livestock case was sampled. This was to account for the time required for viral amplification in the vector population (2 weeks) [27,28], the maximum latent period in livestock (1 week) [29], and the estimated maximum delay between the onset of clinical signs and sample collection in livestock cases (2 weeks). For the time-dependent models, the study period was divided into 30-day periods, and the daily rates of infection were allowed to vary at each periodt. We assumed that the
changes in mosquito abundance impacted all transmission routes similarly. Therefore, in the time-dependent versions of the livestock movement (Models L.1.1 and L.1.2) and spatial proximity (Model L.2) models, the background rate of infection,qt, was expressed asqt, =sψt
andqt, =sσt, respectively, withs being a scaling parameter. The model parameters and
vari-ables are summarized inTable 1.
Table 1. Parameters and variables in the models investigating factors associated with the epidemic in livestock. Model Parameter or variable
Notation Description Prior
Models L.1–4 λi,d Overall daily rate of infection exerted on the livestock population in communei on day d NA
Models L.1–4 (time-independent) q Background rate of infection Uniform (0,
100) Models L.1–2 pi,d Daily rate of infection resulting from communei’s relationship with livestock-infected communes NA
s Scaling parameter for time-dependent models Uniform (0,
100) Livestock movement (Models L.1.1
and L.1.2)
ψ Daily rate at which a commune became infected through introduction of an animal from a livestock-infected commune
Uniform (0, 100)
μi,j Average daily number (weighted model) or occurrence (unweighted model) of animals moved from communej to commune i
NA
Ii,d Indicator variable for infection status of communei on day d NA
Spatial proximity (Model L.2) σ Daily rate at which a commune sharing a border with livestock-infected communes became infected
Uniform (0, 100)
Bi,j Indicator variable for border sharing between communesi and j NA
Ii,d Indicator variable for infection status of communei on day d NA
Livestock density (Model L.3) Li Average number of animals per km2in communei NA
ω Exponent for livestock density Uniform (0,
100) NA = not applicable
For all models, the likelihood (l) of the observed temporal sequence of infection of Mayotte
communes was expressed as follows:
l1i¼ ðe
Pd¼ti 1
d¼1 li;dÞð1 e li;tiÞ ð3AÞ
l2j ¼e Pd¼tlast d¼1 lj;d ð3BÞ l ¼Qil1i Q jl2j ð3CÞ
tiwas the day communei became infected (i.e., report of its first livestock case), and tlastwas
the day after the last reported livestock case in this epidemic on Mayotte.Eq 3Arepresented the probability of communei avoiding the infection until ti−1 and becoming infected on ti.Eq 3Bwas the probability of communej avoiding the infection during the epidemic. Given that
the first four livestock cases were recorded in three communes within ten days in early Decem-ber 2018, several weeks before the epidemic took off in January 2019, RVFV was assumed to have been introduced in these three communes, referred to as seeding communes.
We estimated parameters (ψ, σ, q, ω and s) within a Bayesian Markov Chain Monte Carlo
(MCMC) framework. We used a single-component random-walk Metropolis-Hastings (SCMH) algorithm [30] to express the above likelihood function explicitly. The models were run by custom-built codes in R.3.4.2 [31], and those with the same time-lag and time-depen-dency assumptions were compared with one another based on deviance information criterion (DIC) values. Additionally, for the best model (see Model evaluation below), we compared for each commune the rate of infection resulting from a given transmission route (e.g. livestock movements) with the background rate of infection. For this, we randomly sampled parameter values from their joint posterior distributions and computed the rate of infection for each commune on the day their first livestock case was confirmed. We then computed the propor-tions of simulapropor-tions for which the rate of infection resulting from a given transmission route was higher than the background rate of infection. In each simulation (i.e. for each set of parameters sampled from the joint posterior distribution), we also randomly assigned a source of infection to each commune by simulating a binomial trial, with a probability of success equal topi,d/λi,d. Finally, we performed a posterior predictive check by comparing the observed
and simulated temporal sequence of communes’ infection. In each simulation, we introduced RVFV into the three seeding communes and simulated disease transmission between com-munes based on parameter values randomly sampled from their joint posterior distributions.
Association between human and livestock Rift Valley fever epidemic patterns. We
investigated the spatio-temporal association between livestock and human cases, to test the hypothesis that the risk of infection for humans was higher if the virus was present in nearby livestock populations. The epidemic was divided into nine 4-week epidemic periods. With this 4-week interval, among commune-period combinations that experienced at least one human case, the number of human cases per commune and period was low, with a median of one case (interquartile range (IQR): 1–2.3) and a maximum value of 11 cases. The infection pressure on humans residing in a commune from a livestock-infected commune was formulated in 12 dif-ferent ways. First, we assumed that it (a) decreased exponentially as the distance between the two communes increased (‘distance model for human infection’, Model H.1), (b) depended on livestock density in a livestock-infected commune (‘livestock density model for human infec-tion’, Model H.2) or (c) was not influenced by those factors (‘a null model’, Model H.3), as a baseline comparison. Each of these 3 models was fitted with or without accounting for a possi-ble delay between the onset of symptoms and sampling of livestock cases (3× 2 = 6 models),
and each of these 6 models was further evaluated assuming time-dependent or time-indepen-dent rates of infection (6× 2 = 12 models). The model formulations are presented below.
For all models, the observed number of humans infected by RVFV in communei during
the periodt, τi,t, was simulated through a Poisson process:
ti;t�Pðdi;tÞ ð4Þ
di;t¼ piεtZi;t ð5Þ
δi,twas the expected number of human cases in communei during period t and formulated as
a product ofπi(i.e. the size of the human population in communei), εt(i.e. the daily baseline
rate of human infection during periodt on the island), and ηi,t(i.e. a measure of the relative
rate of human infection in communei in period t). ηi,twas expressed in 3 different ways (Eqs
6A,6Bor6C).
Whenηi,tdepended on the spatial proximity from livestock-infected communes (Model
H.1), the rate of humans infection in communei from livestock-infected commune j decreased
exponentially at a rateα as the Euclidean distance Di,jbetween the geometric centroids of both
communes increased. Therefore, withθj,tdefined as the number of days during which
com-munej’s livestock population was infected and infectious in period t, ηi,twas expressed as:
Zi;t¼Pj¼17j¼1ðe aDi;jy
j;tÞ ð6AÞ
Secondly, whenηi,twas assumed to depend on the livestock density in livestock-infected
com-munes (Model H.2), the rate of human infection in communei from livestock-infected
com-munej was assumed to increase with livestock density in commune j (γj) to the power ofβ. ηi,t
was expressed as:
Zi;t¼Xj¼17
j¼1ðg b
jyj;tÞ ð6BÞ
Finally, in the null model (Model H.3),
Zi;t¼ 1: ð6CÞ
In Models H.1–3, the daily baseline rate was fixed during the entire epidemic (εt=ε,
‘time-independent models’) or allowed to vary with the considered time periodt (‘time-dependent
models’). The three parameters (εt,α, and β) were estimated by using an MCMC simulation in
JAGS [32] in R.3.4.2 [31]. JAGS was used, instead of the SCMH algorithm, becauseτi,tcould
be modelled as a function ofδi,tdirectly in JAGS. In order to assess the impact of a delay
between the onset of symptoms and sample collection in livestock cases on the model results, we fitted the models with all sampling dates moved backwards by 2 weeks, the estimated maxi-mum delay (‘time-lag models’). The parameters and variables in the above models are summa-rized inTable 2. We compared the models with the same time-lag and time-dependency assumptions with one another, based on DIC values, and performed a posterior predictive check on the best model to assess its goodness of fit. For each communei and period t, we
ran-domly sampled model parameters from the joint posterior distribution, and we simulated the number of human cases based on a Poisson process. We repeated this procedure 10,000 times and compared the observed and simulated number of human cases.
Model evaluation. All models were run with two chains and iterated up to the point
where convergence was considered achieved for all unknown parameters based on a visual inspection of trace plots and the Gelman–Rubin convergence diagnostic (<1.01) [33]. Weakly informed priors were used for all unknown parameters (Tables1and2), and the first 10,000
iterations were discarded from the posterior distributions. A posterior predictive check was performed to assess the goodness of fit. For each objective, when comparing any two models, we considered that a model explained the data substantially better than another model if their DIC difference was greater than five [34]. We selected the model whose DIC difference from its null model was greatest as the best model.
Results
Livestock and human epidemic patterns
Livestock cases (n = 165) were identified through the report of abortions (n = 116, 70.3%) and other clinical signs suggestive of RVFV (e.g. pyrexia) (n = 49, 29.6%) from 109 farms. The number of livestock cases per farm showed a highly right-skewed distribution, with only one livestock case detected in 76.1% of affected farms (n = 83) (Fig C inS1 Text). About half of the human cases (n = 70, 49.0%) reported living or working close to animals, and 60.1% (n = 86) reported recent direct contacts with animals or animal fluids.
Communes were classified ascentral (n = 5) and outer (n = 12) based on the structure of
the 2007–14 livestock movement networks, with those movements being much more frequent among central, and from central to outer communes, than from outer communes to other outer and central communes [11]. During the 2018–19 epidemic, the number of livestock cases was slightly higher in outer (n = 87, 52.7%) than central communes (n = 78, 47.3%). However, most cases in central communes were reported earlier than those in outer munes. During the first half of the epidemic (i.e. the first 50% of livestock cases), central com-munes accounted for 61.0% of cases, whereas in the second half of the epidemic, outer communes accounted for 66.3% of cases (Figs2Aand3A). A similar pattern was observed at farm-level, with farm cases being defined as farms with at least one livestock case (Figs D and
E inS1 Text). Information on the commune of residence was available for 112 out of 143
human cases (73.8%). The overall number of human cases was also slightly higher in outer
Table 2. Parameters and variables in the models investigating factors associated with the epidemic in humans. Model Parameter or variable
Notation Description Prior
Models H.1–3 τi,t Observed number of humans infected by RVFV in communei during the period t
NA
δi,t Expected number of human cases in communei during periodt
NA
πi Human population size in communei NA
εt Daily baseline rate of human infection in periodt on the island
Normal (0, 10,000)
ηi,t Relative rate of human infection in communei in period t NA Models H.1–2 θi,t Number of days communei’s livestock population was
infected and infectious in periodt
NA Distance (Model H.1) Di,j Euclidean distance between communesi and j NA
α Exponent for spatial proximity Normal (0,
10,000), I(0,)a Livestock density
(Model H.2)
γi Livestock density in communei NA
β Exponent for livestock density Normal (0,
10,000), I(0,)a
a Priors forα and β were left-truncated.
NA = not applicable
Fig 2. Weekly number of Rift Valley fever virus (RVFV) RT-PCR positive (A) animals and (B) humans in central or outer communes. The bar plots show the weekly
number of RVFV-positive cases (left y-axis), and the solid lines their cumulative distributions (right y-axis). Central communes are colored in red and outer communes in blue.
https://doi.org/10.1371/journal.pntd.0009202.g002
Fig 3. Spatio-temporal pattern of Rift Valley fever virus (RVFV) RT-PCR positive (A) animals and (B) humans. The epidemic was divided into five 4-week periods,
and a sixth period comprised the last 15 weeks of the epidemic. The numbers on the map show the number of RVFV RT-PCR positive cases reported in each commune. Central communes are colored in red and outer communes in blue, with a darker shade representing a higher number of RVFV RT-PCR positive cases. Communes where RVFV was assumed to have been introduced into livestock (‘seeding communes’) are represented with a dashed border in the first map ofFig 3A.
(n = 61, 54.5%) than central communes (n = 51, 45.5%). However, infections in central com-munes did not seem to precede infections in outer comcom-munes (Figs2Band3B).
Role of the Mayotte livestock movement network in the livestock epidemic
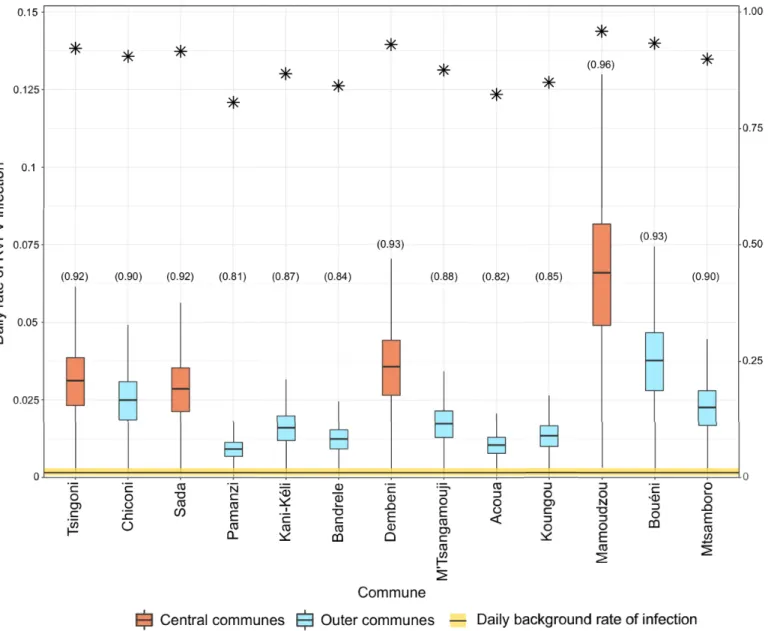
Convergence was achieved for all models (Fig F inS1 Text).Table 3shows the DIC values of different models. The weighted livestock movement models had the lowest DIC value under all model formulations (i.e. time-dependent and time-independent infection rates, with or without a time lag). In particular, the model with time-independent infection rates and a lag between viral incursion and transmission in a commune had the greatest DIC difference from its null model and was therefore chosen as the best model. Additionally, the spatial proximity model with time-independent infection rates and a time-lag in transmission explained the live-stock case data considerably better than its null model, although it was not the case for the other formulations of the spatial proximity models. Finally, for all models, the difference in DIC from the null model was reduced when infection rates could vary over time (‘time-depen-dent models’).On the day that communes had their first livestock case, the estimated force of infection resulting from livestock movements was greater than the background force of infection, espe-cially in central communes (Fig 4). In a posterior predictive check, the model reproduced rea-sonably well the temporal sequence of infection among communes (Fig G inS1 Text).
Association between human and livestock epidemic patterns
Convergence was obtained for all models. Models assuming that the rate of human infection depended on the livestock density in livestock-infected communes (Model H.2) did not explain the spatio-temporal pattern of human RVF cases better than the null model. In contrast, the mod-els assuming that the rate of human infection was a function of the distance to livestock-infected communes (Model H.1) had substantially lower DIC values than other models (DIC difference
>20 for all model formulations). These patterns were not affected by considering
time-indepen-dent or time-depentime-indepen-dent rates of human infection, and by accounting or not for a plausible delay in the detection of livestock cases (Table 4). The distance model accounting for time-dependent infection rates and without delay in the detection of livestock cases had the greatest DIC difference from its null model and was therefore chosen as the best model (Table 4).
While the time-dependent formulation of the distance model (Model H.1) predicted well the observed number of RVF-positive human cases in each epidemic period, the posterior pre-dictive check of the time-independent formulation of this model showed discrepancies
Table 3. Models assessing factors associated with the livestock epidemic.
Model Time-independent infection rates Time-dependent infection rates DIC No. of parameters DIC No. of parameters
Model L.1.1 –Weighted livestock movement 135.0b(131.0a, b) 2 134.1 (134.9) 6
Model L.1.2 –Unweighted livestock movement 138.2 (137.2b) 2 138.3 (139.0) 6
Model L.2 –Spatial proximity 138.5 (133.9b) 2 135.3 (135.5) 6
Model L.3 –Livestock density 139.5 (140.3) 2 137.2 (137.5) 6
Model L.4 –Null model 143.1 (143.1) 1 137.8 (137.5) 5
DIC = deviance information criterion
DIC values in brackets are from the time-lag models (i.e. delay between viral incursion and transmission in a commune)
a The best model with the greatest DIC difference from its null model (see Table A inS1 Textfor the parameter estimates of the best model) b The DIC difference from the null model is >5
between observed and predicted values (Fig H inS1 Text). However, as the distance from live-stock-infected communes increased, the infection rate decreased similarly in both time-depen-dent and time-indepentime-depen-dent models, at a rate ofα = 0.43 (median, 95% highest density interval (HDI): 0.33–0.52) and 0.31 (median, 95% HDI: 0.23–0.40), respectively (Fig 5). At such rates, compared to the daily rate of human infection exerted by infected livestock in the same com-mune, the daily rate of human infection exerted by infected livestock from another commune decreased by 61.7% with the time-dependent, and by 51.9% with the time-independent mod-els, at a distance of 2.3km, the shortest distance between any two commune centroids, and
Fig 4. Daily rate of infection per commune estimated from the best livestock movement model. It shows the results of the weighted, time-independent and time-lag
livestock movement model. Boxplots show the posterior distributions of the daily rate of infection from livestock movements (red and blue boxplots) and the background daily rate of infection (yellow horizontal bar) on the observed infection day of each commune. Asterisks represent the proportion of simulations where RVFV introduction into a commune was due to livestock movements rather than other routes (i.e. background risk) (y-axis). Numbers in brackets along x-axis labels correspond to the proportion of iterations in which the daily rate of RVFV infection exerted by livestock movements on each commune on the day they reported their first livestock case was greater than the background daily rate of infection.
became negligible at a distance of 14.3km, the median distance between any two communes (Fig 5).
Discussion
Our study shows that during the 2018–2019 RVF epidemic in Mayotte, the temporal sequence of RVFV introduction into communes’ livestock populations was associated with the historic
Table 4. Models assessing the association between the livestock and human epidemics.
Model Time-independent infection rates Time-dependent infection rates DIC No. of parameters DIC No. of parameters
Model H.1 –Distance 463.7b(446.9b) 2 323.9a, b(334.4b) 10
Model H.2 –Livestock density 511.9 (485.6) 2 386.0 (386.0) 10
Model H.3 –Null model 484.4 (484.4) 1 386.1 (386.1) 9
DIC = deviance information criterion
DIC values in brackets are from the time-lag models (i.e. delay in the detection of livestock cases)
a The best model with the largest DIC difference from its null model (see Table B inS1 Textfor the parameter estimates of the best model) b The DIC difference from the null model is >5
https://doi.org/10.1371/journal.pntd.0009202.t004 0.0 0.2 0.4 0.6 0.8 0 3 0 2 0 1 0
Relative daily rate of human infection
Distance between communes (km)
Fig 5. Relative daily rate of human infection in a commune as a function of the distance from a livestock-infected commune. Mode (solid line) and 95% highest density intervals (shaded areas) are shown. The vertical lines represent
the minimum, median and maximum Euclidean distances between the centroids of Mayotte communes, respectively (from left).
patterns of livestock movements and, potentially less strongly, with spatial proximity from communes with infected livestock. Also, the spatio-temporal pattern of RVFV infection in humans was associated with spatial proximity from communes with infected animals. Those findings suggest that the analysis of livestock movement networks could be used to identify epidemiological units at high risk of becoming infected and spreading RVFV in both animals and humans.
Previous transmission models based on livestock movement data have suggested a contri-bution of livestock movements to the maintenance of RVFV circulation in endemic settings [16,17]. Livestock movements, through the import of infectious animals, were already shown to be a likely route of RVFV introduction into Mayotte [7]. Our findings support the hypothe-sis that livestock movements may also drive the epidemic spread of RVFV within a naïve host population. Approximately 95% of livestock was estimated to be susceptible to RVFV infection before the 2018–19 epidemic [35], providing suitable conditions for a large RVFV epidemic. Therefore, the introduction of infected animals into a commune’s susceptible livestock popula-tion could lead to the amplificapopula-tion of RVFV in both livestock and mosquitoes, which could then pose an infection risk to humans in the area, as shown by the association between the live-stock and human RVF epidemics. However, it should also be noted that livelive-stock movements were unlikely the only factor shaping the transmission pattern of RVFV on the island. When the spatial proximity model accounted for a time lag, its DIC value also became substantially lower than the null model and marginally higher than the livestock movement model. Consid-ering the time required for the virus to amplify in a mosquito population after its introduction and possible dispersal of infected mosquitos to neighboring communes, this suggests that the observed pattern could have also been influenced by mosquitoes’ dispersion. Indeed, the influ-ence of westerly wind gradually became stronger at the early stage of the epidemic, coinciding with the eastward expansion of RVFV [36]. NDVI was relatively similar across the island, and entomological surveys conducted in Mayotte were consistent with our assumption that spatial variations in RVFV vectors may be limited [37,38]. However, entomological data on potential RVFV vectors still remain limited, meaning that the RVFV vectors’ dynamics is yet to be eluci-dated in Mayotte [37,38]. Therefore, we cannot exclude the possibility that other ecological factors, which are heterogeneously distributed across the island impact on mosquito popula-tion dynamics, result in spatial variapopula-tions in mosquito abundance and eventually influence RVFV transmission dynamics.
Contrary to livestock, humans were not affected in central communes earlier than in outer communes. Nonetheless, the model suggested that RVFV infection pressure on humans was associated with the distance from livestock-infected communes, with the infection pressure rapidly decreasing with the distance. This may reflect mobility patterns on the island. Indeed, communes reported for human cases were the commune of residence, not the commune of workplace. Yet, early in the epidemic, livestock cases were clustered in central communes where many people commute to, from outer communes. Contacts with infected animal tissues or fluids, or bites by mosquitoes fed on infected animals may have thus occurred at the work-place, rather than the commune of residence. Interestingly, the spatial distribution of RVF human cases contrasted drastically with the spatial distribution of COVID-19 cases, which were clustered in Mamoudzou, the capital of Mayotte [39], highlighting different primary transmission routes for those two diseases.
The livestock- and human-infection models associated with the lowest DIC value were time-independent and time-dependent, respectively. This is likely due to the different model outcomes: the date of viral incursion in a commune’s livestock population, and the number of human cases in a commune. While the dates at which livestock were first detected as infected in all but one commune spread over several months, around half of the human cases were
confirmed only over a month. Therefore, allowing the infection rate to vary over time was more likely to impact substantially the goodness of fit of the human than the livestock-infec-tion model.
Our results suggest that understanding the structure of livestock movement networks could help identify high-risk epidemiological units and therefore benefit RVF surveillance, from both animal and public health perspectives. As already emphasized in an earlier study [11], animal health surveillance should initially be targeted to central communes. In the event of an RVF incursion on the island, communication messages could particularly target people living or working in the affected and high-risk areas, encouraging them to practice good hygiene when handling animal fluids and tissues, and to seek medical advice when they have dengue-like symptoms [10]. Metras et al. [18] suggested that targeting hypothetical vaccination efforts on livestock, rather than on humans, would be most effective to reduce the burden of RVF human infections. Our results could support the design of such vaccination programs by iden-tifying livestock populations where vaccination should be prioritized.
This study had several limitations. First, considerable under-reporting was possible for live-stock and human cases. For livelive-stock, subclinical infections, which were likely to account for most infections, as well as infections associated with mild clinical signs, would have been missed by farmers. Moreover, while people were tested by RT-PCR on the day of their medical consultation, animals have been sampled several days after clinical signs suggestive of an RVFV infection were reported. Therefore, it was also likely that most infected animals were no longer viremic at the time of testing and therefore missed. Under-reporting of livestock cases was also likely to depend on farms’ accessibility and whether they had a declared state veteri-narian. In Mayotte, while some farms were not easily accessible by road, they were scattered across the island and not clustered in particular communes. Also, as mentioned above, central and outer communes had similar proportions of farms with a declared state veterinarian. These suggest that the level of under-reporting, although not negligible, may have been similar across the island, and the observed temporal sequence of communes’ infection may still reflect the actual epidemic patterns. For humans, under-reporting was also possible as RVFV infec-tions may be asymptomatic or associated with a mild illness, as observed in a previous epi-demic [40]. However, for the past ten years, people with dengue-like symptoms have been tested for RVFV when visiting local healthcare facilities across the island [10], suggesting that the observed human epidemic curve may have also captured the actual spatio-temporal pattern of human cases. For both livestock and human cases, if the level of biases caused by the above factors was more severe in some communes, the observed associations could have been indeed the result of differential bias.
Another limitation was that dates of infection of livestock and humans were not reported. Since people were tested on the day of medical consultation, the recorded dates were likely to reflect the timing of symptom onsets. For animals, sampling dates were available, but these may not correspond to the onset of clinical signs, due to the time possibly taken by farmers to report a suspected infection, and by state veterinarians to visit farms. However, this is unlikely to change the interpretation of our findings because the model accounting for such delays still explained the spatio-temporal pattern of human cases better than the other models tested.
Third, we modelled livestock movements during the 2018–19 epidemic based on data for 2007–14. However, given that the overall structure of the livestock movement network was sta-ble between 2007 and 2014 [11] and the relative importance of communes in terms of their numbers of livestock did not change between 2010 and 2015, the average network structure over the 2007–14 period was therefore likely to be a good approximation for the network struc-ture in 2018–19. Also, there has not been any particular event known to the authors which might have altered livestock movement patterns in 2018–19.
Fourth, we assumed that a commune remained infected throughout the epidemic once the first livestock case was reported, and the level of infectiousness of an infected commune did not vary over the study period, or if it did, it was similar, at a given time point, in all infected communes. Yet, viral circulation likely varied over time within a given commune, and also between communes, as a result, for instance, of variations in intra-commune movement pat-terns. To account for temporal variations in the rate of infection, we also considered time-dependent rates of infection. However, those models did not change the interpretation of the results, nor did they account for within-commune transmission dynamics. Thus, the availabil-ity of prevalence data in both livestock and humans could allow the modelling of RVF dynam-ics at a higher resolution. Finally, no entomological data were available to assess the potential role of mosquitoes in the 2018–19 RVF epidemic, and variations in RVFV vector abundance across the island. While livestock movements were shown to be associated with RVFV spread across Mayotte, vector transmission was also likely to have played a role in shaping the dissem-ination of the virus across the island, as discussed above in relation to the spatial proximity model. The availability of entomological data would allow us to compare the relative impor-tance of vectors and animal movements in the spatial dissemination of the virus.
In conclusion, our study shows that the livestock movement network and, potentially to a lesser extent, spatial proximity from communes with infected livestock influenced the temporal pattern of the 2018–19 RVF epidemic in livestock. Our study also shows the spatio-temporal association between human and livestock RVF epidemics, highlighting the need for One Health approaches in coordinating surveillance programs in both livestock and human populations.
Supporting information
S1 Text. Supplementary tables and figures.
(DOCX)
Acknowledgments
We thank CoopADEM, Food, Agriculture and Forestry Directorate (DAAF, Direction de l’Ali-mentation, de l’Agriculture et de la Forêt), and Mayotte human health authority (ARS, Agence Re´gionale de Sante´ Mayotte) for their contribution to the outbreak response.
Author Contributions
Conceptualization: Younjung Kim, Raphae¨lle Me´tras, Laure Dommergues, Laurent Filleul,
Hassani Youssouf, Marion Subiros, Guillaume Fournie´.
Data curation: Laure Dommergues, Chouanibou Youssouffi, Soihibou Combo, Gilles Le
God-ais, Laurent Filleul, Marion Subiros.
Formal analysis: Younjung Kim, Raphae¨lle Me´tras, Guillaume Fournie´. Funding acquisition: Dirk U. Pfeiffer.
Investigation: Laure Dommergues, Chouanibou Youssouffi, Soihibou Combo, Gilles Le
God-ais, Laurent Filleul, Hassani Youssouf, Marion Subiros.
Methodology: Younjung Kim, Raphae¨lle Me´tras, Guillaume Fournie´. Supervision: Raphae¨lle Me´tras, Dirk U. Pfeiffer, Guillaume Fournie´.
Validation: Younjung Kim, Raphae¨lle Me´tras, Catherine Cêtre-Sossah, Eric Cardinale, Lau-rent Filleul, Hassani Youssouf, Marion Subiros, Guillaume Fournie´.
Visualization: Younjung Kim, Raphae¨lle Me´tras.
Writing – original draft: Younjung Kim, Raphae¨lle Me´tras, Guillaume Fournie´.
Writing – review & editing: Raphae¨lle Me´tras, Laure Dommergues, Chouanibou Youssouffi,
Soihibou Combo, Gilles Le Godais, Dirk U. Pfeiffer, Catherine Cêtre-Sossah, Eric Cardi-nale, Laurent Filleul, Hassani Youssouf, Marion Subiros, Guillaume Fournie´.
References
1. Craft ME. Infectious disease transmission and contact networks in wildlife and livestock. Philos Trans R Soc Lond B Biol Sci. 2015; 370(1669).https://doi.org/10.1098/rstb.2014.0107PMID:25870393 2. Mansley LM, Dunlop PJ, Whiteside SM, Smith RGH. Early dissemination of foot-and-mouth disease
virus through sheep marketing in February 2001. Veterinary Record. 2003; 153(2):43–50.https://doi. org/10.1136/vr.153.2.43PMID:12885212
3. Gibbens JC, Wilesmith JW, Sharpe CE, Mansley LM, Michalopoulou E, Ryan JBM, et al. Descriptive epidemiology of the 2001 foot-and-mouth disease epidemic in Great Britain: the first five months. Veteri-nary Record. 2001; 149(24):729–43. PMID:11808655
4. Kao RR, Danon L, Green DM, Kiss IZ. Demographic structure and pathogen dynamics on the network of livestock movements in Great Britain. Proc Biol Sci. 2006; 273(1597):1999–2007.https://doi.org/10. 1098/rspb.2006.3505PMID:16846906
5. Danon L, Ford AP, House T, Jewell CP, Keeling MJ, Roberts GO, et al. Networks and the epidemiology of infectious disease. Interdiscip Perspect Infect Dis. 2011; 2011:284909.https://doi.org/10.1155/2011/ 284909PMID:21437001
6. Stark KD, Regula G, Hernandez J, Knopf L, Fuchs K, Morris RS, et al. Concepts for risk-based surveil-lance in the field of veterinary medicine and veterinary public health: review of current approaches. BMC Health Serv Res. 2006; 6:20.https://doi.org/10.1186/1472-6963-6-20PMID:16507106 7. LaBeaud AD, Muchiri EM, Ndzovu M, Mwanje MT, Muiruri S, Peters CJ, et al. Interepidemic Rift Valley
fever virus seropositivity, northeastern Kenya. Emerg Infect Dis. 2008; 14(8):1240–6.https://doi.org/10. 3201/eid1408.080082PMID:18680647
8. Metras R, Fournie G, Dommergues L, Camacho A, Cavalerie L, Merot P, et al. Drivers for Rift Valley fever emergence in Mayotte: A Bayesian modelling approach. PLoS Negl Trop Dis. 2017; 11(7): e0005767.https://doi.org/10.1371/journal.pntd.0005767PMID:28732006
9. Sissoko D, Giry C, Gabrie P, Tarantola A, Pettinelli F, Collet L, et al. Rift Valley fever, Mayotte, 2007– 2008. Emerg Infect Dis. 2009; 15(4):568–70.https://doi.org/10.3201/eid1504.081045PMID:19331733 10. Youssouf H, Subiros M, Dennetiere G, Collet L, Dommergues L, Pauvert A, et al. Rift Valley Fever
Out-break, Mayotte, France, 2018–2019. Emerg Infect Dis. 2020; 26(4):769–72.https://doi.org/10.3201/ eid2604.191147PMID:32186500
11. Kim Y, Dommergues L, M’Sa A B, Merot P, Cardinale E, Edmunds J, et al. Livestock trade network: potential for disease transmission and implications for risk-based surveillance on the island of Mayotte. Sci Rep. 2018; 8(1):11550.https://doi.org/10.1038/s41598-018-29999-yPMID:30069063
12. Niu T, Gaff HD, Papelis YE, Hartley DM. An epidemiological model of Rift Valley fever with spatial dynamics. Comput Math Methods Med. 2012; 2012:138757.https://doi.org/10.1155/2012/138757 PMID:22924058
13. Cavalerie L, Charron MV, Ezanno P, Dommergues L, Zumbo B, Cardinale E. A Stochastic Model to Study Rift Valley Fever Persistence with Different Seasonal Patterns of Vector Abundance: New Insights on the Endemicity in the Tropical Island of Mayotte. PLoS One. 2015; 10(7):e0130838.https:// doi.org/10.1371/journal.pone.0130838PMID:26147799
14. Sekamatte M, Riad MH, Tekleghiorghis T, Linthicum KJ, Britch SC, Richt JA, et al. Individual-based net-work model for Rift Valley fever in Kabale District, Uganda. PLoS One. 2019; 14(3):e0202721.https:// doi.org/10.1371/journal.pone.0202721PMID:30835724
15. Xue L, Scott HM, Cohnstaedt LW, Scoglio C. A network-based meta-population approach to model Rift Valley fever epidemics. J Theor Biol. 2012; 306:129–44.https://doi.org/10.1016/j.jtbi.2012.04.029 PMID:22564391
16. Nicolas G, Chevalier V, Tantely LM, Fontenille D, Durand B. A spatially explicit metapopulation model and cattle trade analysis suggests key determinants for the recurrent circulation of rift valley Fever virus
in a pilot area of madagascar highlands. PLoS Negl Trop Dis. 2014; 8(12):e3346.https://doi.org/10. 1371/journal.pntd.0003346PMID:25474116
17. Durand B, Lo Modou M, Tran A, Ba A, Sow F, Belkhiria J, et al. Rift Valley fever in northern Senegal: A modelling approach to analyse the processes underlying virus circulation recurrence. PLoS Negl Trop Dis. 2020; 14(6):e0008009.https://doi.org/10.1371/journal.pntd.0008009PMID:32479505
18. Metras R, Edmunds WJ, Youssouffi C, Dommergues L, Fournie G, Camacho A, et al. Estimation of Rift Valley fever virus spillover to humans during the Mayotte 2018–2019 epidemic. Proc Natl Acad Sci U S A. 2020; 117(39):24567–74.https://doi.org/10.1073/pnas.2004468117PMID:32929025
19. Nielsen SS, Alvarez J, Bicout DJ, Calistri P, Depner K, Drewe JA, et al. Rift Valley Fever–epidemiologi-cal update and risk of introduction into Europe. EFSA Journal. 2020; 18(3):e06041.https://doi.org/10. 2903/j.efsa.2020.6041PMID:33020705
20. Bird BH, Bawiec DA, Ksiazek TG, Shoemaker TR, Nichol ST. Highly sensitive and broadly reactive quantitative reverse transcription-PCR assay for high-throughput detection of Rift Valley fever virus. J Clin Microbiol. 2007; 45(11):3506–13.https://doi.org/10.1128/JCM.00936-07PMID:17804663 21. Direction Ge´ne´rale de l’Alimentation (DGAL). Services Veterinaires de Mayotte. 2019.
22. Direction de l’Alimentation, de l’Agriculture et de la Forêt. Agreste: la statistique agricole. L’essentiel du recensement agricole 2010. 2011.
23. Direction de l’Alimentation, de l’Agriculture et de la Forêt. Evolution des profils d’exploitationsàMayotte - 2ème partie de l’analyse des 600 enquêtes de 2015: Les e´levages de petits et gros ruminants se pro-fessionnalisent. 2016.
24. Wasserman S, Faust K. Social network analysis: methods and applications. Cambridge; New York: Cambridge University Press; 1994. xxxi, 825 p. p.
25. Lourenc¸o PM, Sousa CA, Seixas J, Lopes P, Novo MT, Almeida AP. Anopheles atroparvus density modeling using MODIS NDVI in a former malarious area in Portugal. J Vector Ecol. 2011; 36(2):279– 91.https://doi.org/10.1111/j.1948-7134.2011.00168.xPMID:22129399
26. Conseil De´partmental de Mayotte. The Pole´, a new amphidrome of the Maritime Transport Service (STM), inaugurated! 2016.
27. Talla C, Diallo D, Dia I, Ba Y, Ndione JA, Sall AA, et al. Statistical modeling of the abundance of vectors of West African Rift Valley fever in Barkedji, Senegal. PLoS One. 2014; 9(12):e114047.https://doi.org/ 10.1371/journal.pone.0114047PMID:25437856
28. Diallo D, Talla C, Ba Y, Dia I, Sall AA, Diallo M. Temporal distribution and spatial pattern of abundance of the Rift Valley fever and West Nile fever vectors in Barkedji, Senegal. J Vector Ecol. 2011; 36 (2):426–36.https://doi.org/10.1111/j.1948-7134.2011.00184.xPMID:22129415
29. World Organisation for Animal Health (OIE). Rift Valley fever. The OIE Technical Disease Cards. 2019. 30. Gilks WR, Richardson S, Spiegelhalter DJ. Markov chain Monte Carlo in practice. Boca Raton, Fla.:
Chapman & Hall; 1998. xvii, 486 p. p.
31. R Core Team. R: A Language and Environment for Statistical Computing. 2020. 32. Plummer M. JAGS Version 3.4.0 user manual. 2013.
33. Gelman A. Bayesian data analysis. 2nd ed. Boca Raton, Fla.: Chapman & Hall/CRC; 2004. xxv, 668 p. p.
34. Spiegelhalter DJ, Best NG, Carlin BP, Van Der Linde A. Bayesian measures of model complexity and fit. Journal of the Royal Statistical Society: Series B (Statistical Methodology). 2002; 64(4):583–639. 35. Metras R, Cavalerie L, Dommergues L, Merot P, Edmunds WJ, Keeling MJ, et al. The Epidemiology of
Rift Valley Fever in Mayotte: Insights and Perspectives from 11 Years of Data. PLoS Negl Trop Dis. 2016; 10(6):e0004783.https://doi.org/10.1371/journal.pntd.0004783PMID:27331402
36. Average Weather in Mamoudzou. [cited 23 December 2020]. In: Weather Spark [Internet]. Minneapolis: Cedar Lake Ventures, Inc. Available from: https://weatherspark.com/y/103645/Average-Weather-in-Mamoudzou-Mayotte-Year-Round.
37. Le Goff G, Goodman SM, Elguero E, Robert V (2014) Survey of the Mosquitoes (Diptera: Culicidae) of Mayotte. PLOS ONE 9(7): e100696.https://doi.org/10.1371/journal.pone.0100696PMID:25004163 38. FSA AHAW Panel (EFSA Panel on Animal Health and Welfare), Nielsen SS, Alvarez J, Bicout DJ,
Calistri P, Depner K, Drewe JA, Garin-Bastuji B, Gonzales Rojas JL, Schmidt CG, Michel V, Miranda Chueca MA´ , Roberts HC, Sihvonen LH, Stahl K, Velarde A, trop A, Winckler C, Cetre-Sossah C, Che-valier V, de Vos C, Gubbins S, Antoniou S-E, Broglia A, Dhollander S and Van der Stede Y, 2020. Sci-entific Opinion on the rift Valley Fever: risk of persistence, spread and impact in Mayotte (France). EFSA Journal 2020; 18(4):6093, 61 pp.
40. Lernout T, Cardinale E, Jego M, Despres P, Collet L, Zumbo B, et al. Rift valley fever in humans and ani-mals in Mayotte, an endemic situation? PLoS One. 2013; 8(9):e74192.https://doi.org/10.1371/journal. pone.0074192PMID:24098637
![Fig 1. Geographical location of Mayotte (A) and its communes (B). In Fig 1B, communes were classified into central (red) or outer (blue) communes based on their structural equivalence in the livestock movement network [11].](https://thumb-eu.123doks.com/thumbv2/123doknet/13803662.441275/4.918.275.862.118.482/geographical-location-mayotte-communes-classified-structural-equivalence-livestock.webp)