HAL Id: hal-00696819
https://hal.inria.fr/hal-00696819
Submitted on 14 May 2012
HAL is a multi-disciplinary open access
archive for the deposit and dissemination of
sci-entific research documents, whether they are
pub-lished or not. The documents may come from
teaching and research institutions in France or
abroad, or from public or private research centers.
L’archive ouverte pluridisciplinaire HAL, est
destinée au dépôt et à la diffusion de documents
scientifiques de niveau recherche, publiés ou non,
émanant des établissements d’enseignement et de
recherche français ou étrangers, des laboratoires
publics ou privés.
QuestMonitor: A Visualization Platform for Declarative
Network Protocols
Eric Bellemon, Vincent Dubosclard, Stéphane Grumbach, Kun Suo
To cite this version:
Eric Bellemon, Vincent Dubosclard, Stéphane Grumbach, Kun Suo. QuestMonitor: A Visualization
Platform for Declarative Network Protocols. WORLDCOMP 2011 : World Congress in Computer
Science, Computer Engineering, and Applied Computing, Jul 2011, Las Vegas, United States.
�hal-00696819�
QuestMonitor: A Visualization Platform
for Declarative Network Protocols
Eric Bellemon
1, Vincent Dubosclard
1, Stéphane Grumbach
1and Kun Suo
21
INRIA-LIAMA, Beijing, China
2CASIA-LIAMA, Beijing, China
Abstract— We present the QuestMonitor system, which
al-lows to visualize dynamic networks, and monitor the execu-tion of protocols written in a data centric and declarative language: Netlog. This language allows to write protocols, which are two orders of magnitude shorter than imperative programs. Nevertheless, their behavior is sometimes tricky to understand in dynamic networks. QuestMonitor, allows to monitor all the communication between the nodes, the evolution of the data stores on each node, as well as the execution of the declarative code. It also allows to color the virtual data structures, such as routes, backbones, etc. It allowed us to identify flaws in programs. Together with the code editing facility, it constitutes a good tool for rapid prototyping.
Keywords: distributed programming; data centric; declarative languages; network monitoring; visualization
1. Introduction
Distributed programming has tremendously gained in im-portance in recent years, with the wide development of net-works, which now become ubiquitous and support applica-tions in many domains; the emergence of large commodities for data storage and computation such as cloud computing; as well as, at the micro scale, the rise of multicore processors which, in an attempt to preserve Moore’s law, palliate the bound on clock speed, by augmenting the number of cores on chips and parallelizing the computation.
Distributed programming though is still a very complex task, which requires high programming skills, and whose correction is very difficult to guarantee. The need for high level programming abstraction for distributed applications is striking in all the above mentioned areas. Their success will indeed strongly depend upon the ability to program them efficiently and in a reliable manner.
Data centric programming languages constitute a very promising model for distributed applications. They are more declarative, so facilitate programming, they parallelize well, so facilitate the execution, they manipulate explicitly data structures, so facilitate verification of their properties.
0This work has been supported by the French Agence Nationale de la
Recherche, under grant ANR-09-BLAN-0131-01.
The use of rule-based languages, à la Datalog [1], [2], [3], [4], developeded in the field of databases in the 1980’s, for distributed applications, was initially proposed in UC Berkeley [5], [6], under the name "declarative networking". It was shown that such languages augmented with com-munication primitives, allowed to express comcom-munication protocols or P2P systems with code about two orders of magnitude shorter than imperative programs, and with rea-sonable execution models.
The data centric approach offers great advantages. It is easier to program, results in code which is two orders of magnitude shorter, much more declarative, so relieve the programmer from the intricacy of distributed programming. Moreover, it parallelizes well in general, as database lan-guages such as SQL. Nevertheless, the behavior of declar-ative programs over dynamic networks might be tricky to understand. The possibility to visualize their behavior in networks greatly help developing code, and might reveal flaws in programs.
We considered the rule-based language, Netlog [7], which extends Datalog with aggregation and non-deterministic con-structs as well as communication primitives, in the spirit of the declarative networking approach. It has a sound distributed fixpoint semantics, which takes explicitly into account the in-node behavior as well as the communication between nodes.
Netlog runs on the Netquest Virtual Machine, which is coupled with an embedded Data Management System, DMS, which stores all the data as well as the bytecode of the Netlog programs. The bytecode is obtained by a compilation from Netlog into an SQL dialect. The Virtual machine makes calls to the DMS to evaluate the bytecode of the Netlog programs, which result in updates of the database, and production of messages. The machine has been shown to be portable over small devices, as long as they support an embedded DMS [8].
Several network simulators are accessible in open source, giving access to various grain of analysis of the activity of the network such as NS, OMNET, or WSNet to name a few, but to the best of our knowledge non that can monitor the distributed execution of declarative code. QuestMonitor allows to monitor the execution of declarative programs in a distributed environment, which can be either a simulated network or a monitored system such as a testbed.
QuestMon-itor also includes a simple network simulator. The exchanged messages and the content of the database of each node can be displayed as well.
Networking protocols have constituted our first experi-mental area, with declarative design of basic services, which construct and maintain distributed data structures, such as spanning trees, shortest paths, dominating sets, etc. Many networking protocols have been designed, including various routing protocols, such as DSDV [9], OLSR [10], AODV [11], and VRR [12], as well as configuration and self-organization protocols, such as ASCNET [13] or FISCO [14]. QuestMonitor has been essential to understand the behavior of declarative code. In some cases it has allowed us to find classical flaws, such as the route flapping problem, or dependency on the order of messages. But more generally, it has helped understanding what procedural behavior could be associated to the declarative code.
The paper is organized as follows. In the next section, we present the Netlog language through simple examples. In Section 3, we describe the virtual machine. The Netlog editor and compiler is briefly described in Section 4, while the visualization platform is presented in Section 5. We illustrate the use of QuestMonitor on concrete applications in Section 6.
2. The Netlog language
Netlog programs consist of sets of recursive rules of the form head :- body, where the head is derived when the body is satisfied. The programs are installed on each node of a network, where they run concurrently. The computation is distributed and the nodes exchange information. The facts deduced from the rules can be either stored on the node on which the rules run, or sent to other nodes.
We present the language through some fundamental exam-ples of programs for network organization, routing, mobile servers and sensor network monitoring.
2.1 Network organization protocol
We consider the construction of a spanning tree. The results are distributed so that each node stores the knowledge of its parent in the tree.
Program Tree
l onST (self ) : −Root(self ). (1) l ST (@ ⋄ y, self ) : −Link(self, y); onST (y); ¬onST (self ). (2) l onST (self ) : −Link(self, y); onST (y); ¬onST (self ). (3)
The variable self is interpreted by the node address. The store/push operator, "l", in front of rules, determines where the results are assigned. The effect of "↓" is to store the results of the rule on the node where it runs; "↑", to push them to its neighbors; and "l", to both store and push them.
The location instruction "@" in the head of rules represents the destination. Rule (2) unicasts its results, using the location instruction "@", on the first variable of the head, instead of pushing them to all neighbors.
The negation is interpreted by local closed world assump-tion (a fact is not true on a node if it is not stored on that node). The choice operator⋄ chooses non-deterministically a parent among the possible choices.
Assume that Root(ρ) holds on a root node ρ exclusively. When a node α is on the spanning tree, it broadcasts onST(α) to its neighbors (rules 1 and 3). The fact ST (α, β) is stored exclusively on nodes α and β. It is deduced by node β and sent to node α, its parent, by rule (2).
2.2 Routing protocol
Program DSDV is a simplified version of the DSDV protocol [9] which constructs and maintains proactively all possible routes in adhoc networks. The routes are stored in relation Route with attributes destination, nextHop, nbHops and destinationSN , used for sequence numbers.
Each node creates a route to itself when the program starts with rule (4). Periodically, using the timer hello, each node broadcasts all its route information to its neighbors, rule (5), and increases the value of the destinationSN of the route to itself, using rule (6). The symbol “!” denotes the deletion of the facts used in the evaluation of the rules.
The route informations are sent using facts of the form RtInf o. A node updates its route table according to the route information received from its neighbors as follows.
(i) A new route is stored if there is no route to the same destination in the local route table, rule (7). The expression ¬Route(x, _, _, _) in the body of rule (7) means that there is no fact Route(x, a, b, c) for any value a, b, c.
(ii) The old route is deleted and replaced with a new one if the new route has a larger destination sequence number, rule (8), or the new route has the same sequence number as the old one but has a smaller number of hops, rule (9). Program DSDV
↓ Route(self, self, 0, 1) : −T imeEvent(′ini′). (4)
↑ RtInf o(self, x, n, s) : −T imeEvent(′hello′); (5)
Route(x, y, n, s).
↓ Route(self, self, 0, s) : −T imeEvent(′hello′); (6)
!Route(self, y, z, s′,0); s := s′+ 1.
↓ Route(x, ⋄y, n, s) : −RtInf o(y, x, n′, s); (7)
¬Route(x, _, _, _); n := n′+ 1.
↓ Route(x, ⋄y, n, s) : −RtInf o(y, x, n′, s); n:= n′+1; (8)
!Route(x, y′, n′′, s′); s′< s.
↓ Route(x, ⋄y, n, s) : −RtInf o(y, x, n′, s); n := n′+1; (9)
2.3 Mobile clients
The Mobile clients program allows a mobile client to always maintain a route to a server. This program is divided in three sub-programs: server, relay and client. Servers provide a service, relays maitain a route to the nearest server and clients need a route to a server. The route to the nearest server is stored in relation P rovider with attributes server, nextHop, nbHops and timeout used to delete expired entries.
Servers answer to a relay when receiving a request with rule (10). Each relay creates a route to the nearest server in the network with rule (11), (12) and (13). When the timer relay is fired, relays broadcast a request to find a server.
In clients node, when the timer route is fired, they broadcast a request for routes to all their neighbors with rule (15) if there is no existing route to a server. Answers are treated by rule (17). If the client knows a route to a server, it sends a request to the next hop to check the validity of the route (16). The reply of the next hop is treated by rule (18). The keyword time is the system time of the node. In rule (17) and (18), the timeout of the route to the server is set to the current time system plus nine seconds.
Program Mobile Clients - Server
↑ RelayRep(self, @x, self, 1) : −!RelayReq(x). (10)
Program Mobile Clients - Relay
↑ RelayReq(self ) : −!T imeEvent(′relay′); (11)
¬P rovider(_, _, _, _).
↑ RelayRep(x, @y, self, n) : −!RelayReq(y); (12) P rovider(x, _, n′, _); n := n′+ 1.
↓ P rovider(x, y, n, t) : −RelayRep(x, self, y, n); (13) ¬P rovider(_, _, _, _).
↑ ClientRep(x, self, @y, n) : −!ClientReq(y, _); (14) P rovider(x, _, n′, _); n := n′+ 1.
Program Mobile Clients - Client
↑ ClientReq(self, self ) : −!T imeEvent(′route′); (15)
¬P rovider(_, _, _, _).
↑ ClientReq(self, @x) : −!T imeEvent(′route′); (16)
P rovider(_, x, _, _).
↓ P rovider(x, y, n, t) : −!ClientRep(x, y, self, n); (17) ¬P rovider(_, _, _, _); t := time + 9. ↓ P rovider(x, y, n, t) : −!ClientRep(x, y, self, n); (18)
!P rovider(_, x, n, _); t := time + 9.
2.4 Sensor networks monitoring
The program is monitoring temperature on captors. Tem-perature of the nodes are stored in the relation T emTem-perature with attributes nodeId and temperature. If the temperature of a device is higher than a threshold, it sends a request
to all its neighbors to retrieve their temperatures (19). meta_threshold is a constant defined in the header of the program.
When a node receives a request, it sends its current temperature to the source of the request (20).
The node which receives the replies saves the temperature of its neighbor in temperature, rule (21). With the aggre-gation avg, it also computes the average of the temperature of all its neighbors with rule (22) and stores it in the relation T pAvg.
Program Sensor monitoring
↑ Req(self ) : −T emperature(self, t); (19) t > meta_threshold.
↑ Rep(self, @x, t) : −Req(x); T emperature(self, t). (20) ↓ T emperature(x, t) : −Rep(x, self, t); (21)
¬T emperature(x, _).
↓ T pAvg(x, avg[t]) : −T emperature(x, t). (22)
3. Netquest Virtual Machine
The Netquest Virtual Machine executes the Netlog byte-code and manipulates data and messages. It is working as a daemon in the device, and applications can use it to communicate with other devices on the network. The virtual machine is portable and can be installed in small devices with embedded DMS. A previous implementation was done in iMote sensors [8].
The Netquest Virtual Machine is composed of six com-ponents (Fig. 1):
• Device Wrapper for QuestMonitor: provides an
ab-straction layer of the network. It does the address translation between Netlog internal addresses and the network addresses. It also receives and sends data over the network.
• Data Management System (DMS): provides an access
to the data. This module evaluates the bytecode, manip-ulates data (insertion, update and deletion) and produces messages.
• Router: receives and sends Netquest messages through
the device wrapper. It chooses the best route to reach a destination. The strategy to select the route can be easily defined in Netlog.
• Engine: executes Netlog programs. When the node
receives a new message, the engine loads the rules matching the facts of the message and evaluates them through the DMS.
• Timer Manager (TM): manages time event of the
sys-tem. Netlog programs can create and manipulate timers. These timers are managed and fired by this module.
• Application API: this module is an interface between
the virtual machine and applications. An external ap-plication can use the Netlog Virtual Machine to send and receive messages over the network.
Fig. 1: Netquest Virtual Machine architecture
When a message is received by a device, the device wrapper transfers it to the router. The message is read by the router and the payload is sent to the engine if the device belongs to the destination. The engine loads rules from Netlog programs matching the facts contained in the payload and then evaluate these rules using the DMS. The DMS can update or delete data and create messages to be sent. These new messages are sent to the network through the device wrapper.
The Netlog Engine does not execute directly the bytecode. It orchestrates the tasks to be done to treat messages and facts. When receiving facts, a new round starts and a first stage is executed. In this stage, the engine loads and executes rules triggered by these facts. If there are derived facts produced by the engine, a new stage is executed recursively again with these new facts. A round is finished when there are no new derived facts. At the end of a round, produced messages are sent to other nodes in unicast or broadcast mode.
4. Netlog Editor and compiler
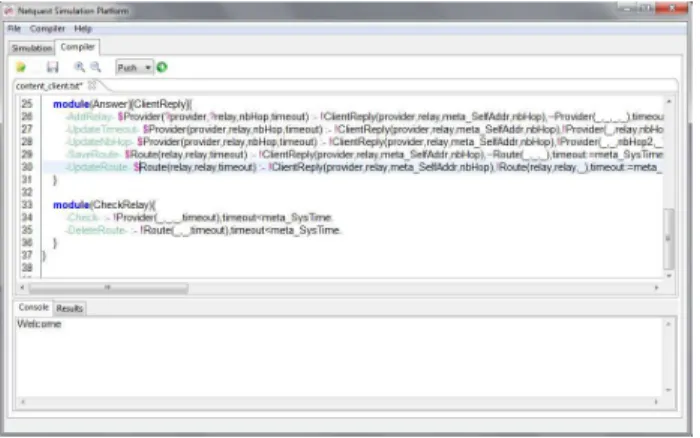
The code editor (Fig. 2) is an environment for helping developers to write Netlog programs, with standard func-tionalities such as syntax coloring and error detection, and which also ensures the compilation of Netlog.
Fig. 2: Code editor interface
The Netlog compiler is a multi-pass compiler which
compiles the Netlog code to an intermediate bytecode. This bytecode is then executed by the Netlog engine.
Fig. 3: Compiler architecture
The compilation is done in four steps (Fig. 3). First, the input program is parsed and transformed into an abstract syntax tree. Then the syntax tree is browsed by the semantic analysis module and an enhanced intermediate tree is built. After an intermediate code is generated and finally the output bytecode is generated depending upon the target engine.
The generated bytecode is a SQL dialect. A query is built for each operator (store, push and deletion) in a rule. Consider for instance the following rule which contains the three operators:
l Link(a, b) : −!Hello(b, @a); ¬Link(a, b). (23)
Rule 23 is evaluated when the engine receives a Hello message. It is translated into three SQL queries correspond-ing to each operator:
SELECT H e l l o . a , H e l l o . b FROM H e l l o
WHERE H e l l o . a = ’ m e t a _ s e l f A d d r ’ AND NOT EXISTS (
SELECT L i n k . a , L i n k . b FROM L i n k WHERE L i n k . a = H e l l o . a AND L i n k . b= H e l l o . b ) ; INSERT INTO L i n k SELECT H e l l o . a , H e l l o . b FROM H e l l o WHERE H e l l o . a = ’ m e t a _ s e l f A d d r ’ AND NOT EXISTS (
SELECT L i n k . a , L i n k . b FROM L i n k WHERE L i n k . a = H e l l o . a AND L i n k . b= H e l l o . b ) ; UPDATE H e l l o SET H e l l o . d e l e t e d =1 WHERE H e l l o . a = ’ m e t a _ s e l f A d d r ’ AND NOT EXISTS (
SELECT L i n k . a , L i n k . b FROM L i n k
WHERE L i n k . a = H e l l o . a AND L i n k . b= H e l l o . b ) ;
The first query is the result for the operator push, the second for the operator store and the third for the deletion. All the keyword beginning by meta_ are replaced by the engine during the evaluation of the rule. The negation of Link is translated with the sub-query into the section not exists.
5. Visualization Platform
The visualization platform (Fig. 4) allows to interact with a network on a 2D graphical interface. The objective is to monitor the behavior of protocols which have been written in Netlog. This network might be a simulated one or a monitored testbed. Currently, we made experiments only on simulated networks.
Fig. 4: QuestMonitor user interface QuestMonitor has three main components:
• The Network Editor, which allows to simulate a
net-work with various groups of nodes;
• The Network Monitor, which allows to visualize and
interact with the network at run time; and
• The Node Monitor, which allows to monitor the activity
of and interact with individual nodes.
The Network Editor allows to create groups of nodes, to display the status of the nodes in each group and to install Netlog programs on them. They can have different colors, radio range, and characteristics, such as mobile or fixed. The system creates the groups and display the nodes on the left part of the screen. Each node is listed and for each node one can see its identifier, address, position and radio range. In order to finalize the creation of a group, Netlog protocols have to be installed on the nodes. The system allows the possibility to install several protocols on a unique group of nodes.
The Network Monitor offers the view of the different groups of nodes represented by different shapes and different colors and the connections between them (if the nodes are located inside the radio range of another node). Each node is identified by a unique number. The Network Monitor also allows to interact with the network, and modify its con-figuration before starting the simulation, by moving nodes, changing their radio range, or deleting edges or nodes for instance. This part was implemented using Piccolo2d1which allows to create Zoomable User Interfaces (ZUIs). The user can smoothly zoom in or out in order to get more details or have a global overview of the network. Piccolo2d has also a hierarchical structure which permits to manipulate easily
1http://piccolo2d.org/
a group of identical objects: edges, messages, ranges, nodes identifiers and so on. The users can thus very easily display the layers they are interested in without being disturbed by too many information (especially for big networks).
The Node Monitor exhibits informations about the node selected by the user, displayed on the right part of the screen. It contains six tabs: Display itemSet, Programs, Messages, API, Coloration and Statistics. The "Display itemSet" tab allows the user to choose a table existing in the database of the node and to display the values of each attribute of this table. It is important to notice that the content is updated on the fly. For example, you can choose to display the content of the table "Route" to see all the routes contained on the selected node. The next tab simply displays which protocols are installed on the node with the possibility for the user to enable or disable them on this node. The tab "Messages" displays all the messages received or sent by the node. If you click on one message in particular, you can display its content. The tab "API" permits to modify the content of the database of the selected node by adding a tuple in one of the tables of the nodes, as an application would do, by updating some sensed data for instance. The last tab shows some basic statistics about the node such as the number of Select queries or Update queries done in the database of the node.
The "Coloration" is one of the fundamental functionalities of QuestMonitor. It allows the user to color nodes and edges according to different criteria and with four distinct levels: (i) local, (ii) recursive, (iii) path, or (iv) global. The user first selects a table and a least one of its attributes.
At the local level, the system checks in the selected table, if for one of the tuples, the selected attribute corresponds to one of the neighbors of the selected node and color the edge between the two.
At the recursive level, the user is asked to select two attributes. Then the system checks exactly as in the precedent case, if one of the neighbor satisfies the condition. If one neighbor satisfies the condition, then the link is colored. If this is not the case, it will check with the second selected attribute. If there is no result, then there will be no coloration. But if one neighbor matches the condition with the second attribute, then the system does the same operation again but this time starting from the matching neighbor of the selected node. This is repeated recursively until there is a match for the first attribute or there are no neighbors for the second attribute.
At the path level, the user is also required to select two attributes as well as a source and a destination nodes. The system tries to find a path from the source to the destination using the method described above.
At the global level, the algorithm is exactly the same as at the recursive level, except that the system performs the task not only for the selected node, but for all the nodes of the network.
6. Experiments with network protocols
We present below some simple examples to illustrate the use of the QuestMonitor system, and show it helps in the design of programs, based on the samples of declarative programs presented in Section 2.
6.1 Tree construction
The tree protocol defined in Program Tree can be easily experimentally checked with QuestMonitor. The program is creating a tree with node 0 as root. It should built a loop-free subnetwork. In the coloration tab, the tool can be configured to display the global tree of the root node by selecting the type global and the relation ST . When the simulation starts, we can immediately visualize the different steps of the creation of the tree and if there is any error. The final state of the execution of this program is in the Fig. 5. The tree is colored in blue with node 0 as root.
Fig. 5: Network with Tree protocol
6.2 DSDV Route
We can easily test and debug the implementation of the DSDV protocol defined in Program DSDV.
Fig. 6: Network with DSDV
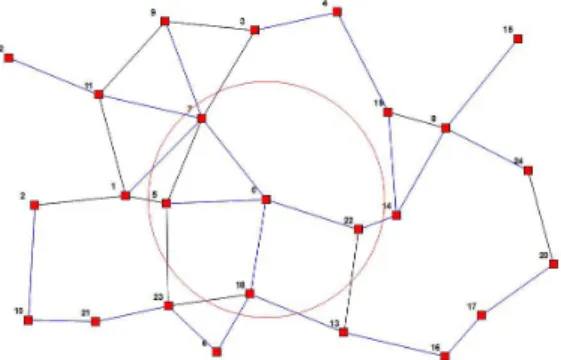
In Fig. 6, there is a network running the DSDV protocol with 12 nodes. QuestMonitor is configured to color in red the route between node 10 and 11 with the path mode of the coloration tab and the relation route selected. With this
tool, we could detect that our first implementation of DSDV had a problem because the routes were not stable.
The route from node 10 to 11 is flapping because there are three different routes with the same number of hops. Rule (8) updates the relation route when a new route is received with a higher sequence number. The node 10 has two neighbors: node 4 and node 9. The "Display itemSet" tab of QuestMonitor shows that node 9 knows a route to node 11 through node 6 with a number of hops of 4, and node 4 also knows a route to node 11 through node 3 with the same number of hops. In the "Messages" tab, the list of received messages of node 10 is displayed and it received messages RtInf o(4, 11, 4, 10) form node 4 then RtInf o(9, 11, 4, 12) form node 9 and RtInf o(4, 11, 4, 18) from node 4. Each time the node received a message RtInf o, rule 8 is applied and the route is updated because the sequence number is increasing.
Rule (8) can be fixed by adding the condition related to relation Route that the route is updated if the sequence number is higher and if the next hop is the same:
↓Route(x, ⋄y, n, s) : −RtInf o(y, x, n′, s); n := n′+1; (24)
!Route(x, y, n′′, s′); s′< s.
6.3 Mobile Client
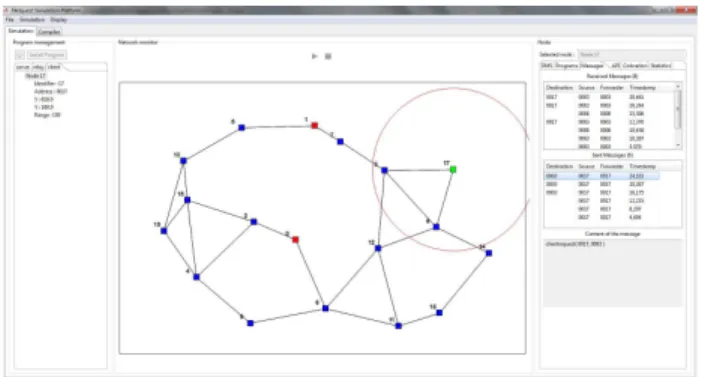
Protocol Mobile Client runs on the network of Fig. 7.
Fig. 7: Network with Mobile Client
The simulated network is composed of 2 servers (nodes 0 and 1), 15 relays (nodes 2-16) and 1 moving client (node 17). With this program, the client always has a route to the nearest server through relays.
With the tab coloration, by selecting the type recursive and the relation provider, QuestMonitor displays the route from the client to the nearest server in red. When the client is moving the coloration is updated on the fly to reflect the new values of the data (Fig. 8).
6.4 Sensor network monitoring
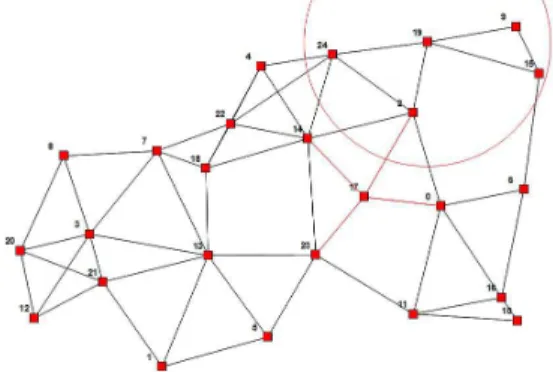
In this experiment, 25 nodes are executing the program sensor network monitoring (Fig. 9). For the simulation, each node generates a temperature every 15 seconds to simulate a captor. If the temperature is above a threshold, the node broadcasts a request for retrieving the temperature of all its neighbors. If the average of the temperature of the neighbors is higher than the threshold, all the edges of the node are colored.
Fig. 9: Network with Temperature alert program With QuestMonitor, the temperature and the average can be easily visualized. In the coloration tab, by selecting the type global, the edges of the nodes with an average higher than the threshold can be colored.
7. Conclusion
Data centric languages facilitate the writing of distributed programs, resulting in much shorter and more declarative code. Nevertheless, their behavior over dynamic networks is sometimes difficult to understand. The QuestMonitor system allows to visualize their execution over dynamic networks, and to monitor the communication as well as the evolution of the data stored on the nodes. It has helped prototyping protocols, and detect flaws in our programs. This was the case in particular for flapping routes in routing protocols, or errors due to protocols sensitive to the order of messages. It has been shown in addition, that the data centric approach facilitate as well the verification of the programs. Netlog protocols have been verified [15] using the Coq proof assistant. The next step will be to replace the homemade network simulator by a more powerful and efficient one (e.g.
ns-3) while keeping the existing functionalities (as real-time dynamic network simulation).
Acknowledgment
The authors are greatly indebted to Michel Bauderon for his seminal influence on this development. They would like to thank as well Ahmad Ahmad-Kassem, Christophe Bobineau, Christine Collet, Fuda Ma, and Stéphane Ubéda, for their suggestions on a previous version of the software.
References
[1] F. Bancilhon, “Naive evaluation of recursively defined relations,” pp. 165–178, 1986.
[2] F. Bancilhon, D. Maier, Y. Sagiv, and J. D. Ullman, “Magic sets and other strange ways to implement logic programs (extended abstract),” in PODS ’86: Proceedings of the fifth ACM SIGACT-SIGMOD
sym-posium on Principles of database systems. New York, NY, USA: ACM, 1986, pp. 1–15.
[3] L. Vieille, “Recursive axioms in deductive databases: The query/sub-query approach,” in Expert Database Conf., 1986, pp. 253–267. [4] R. Ramakrishnan and J. D. Ullman, “A survey of research on
deductive database systems,” Journal of Logic Programming, vol. 23, pp. 125–149, 1993.
[5] B. T. Loo, J. M. Hellerstein, I. Stoica, and R. Ramakrishnan, “Declar-ative routing: extensible routing with declar“Declar-ative queries.” in Proc.
ACM SIGCOMM ’05, 2005.
[6] B. T. Loo, T. Condie, M. N. Garofalakis, D. E. Gay, J. M. Hellerstein, P. Maniatis, R. Ramakrishnan, T. Roscoe, and I. Stoica, “Declarative networking: language, execution and optimization.” in Proc. ACM
SIGMOD’06, 2006.
[7] S. Grumbach and F. Wang, “Netlog, a rule-based language for distributed programming,” in PADL’10, Twelfth International
Sympo-sium on Practical Aspects of Declarative Languages, Madrid, Spain, january, 2010.
[8] M. Bauderon, S. Grumbach, D. Gu, X. Qi, W. Qu, K. Suo, and Y. Zhang, “Programming imote networks made easy,” in The Fourth
International Conference on Sensor Technologies and Applications. IEEE Computer Society, 2010, pp. 539–544.
[9] C. Perkins and P. Bhagwat, “Highly dynamic destination-sequenced distance-vector routing (dsdv) for mobile computers,” in ACM
SIG-COMM’94 Conference on Communications Architectures, Protocols and Applications, 1994, pp. 234–244.
[10] P. Jacquet, P. Muhlethaler, T. Clausen, A. Laouiti, A. Qayyum, and L. Viennot, “Optimized link state routing protocol for ad hoc networks,” in Multi Topic Conference, 2001. IEEE INMIC 2001.
Technology for the 21st Century. Proceedings. IEEE International, 2001, pp. 62–68.
[11] C. E. Perkins, “Ad-hoc on-demand distance vector routing,” in In
Proceedings of the 2nd IEEE Workshop on Mobile Computing Systems and Applications, 1999, pp. 90–100.
[12] M. Caesar, M. Castro, E. B. Nightingale, G. O’Shea, and A. Rowstron, “Virtual ring routing: network routing inspired by dhts,” SIGCOMM
Comput. Commun. Rev., vol. 36, pp. 351–362, 2006.
[13] A. Cerpa and D. Estrin, “Ascent: Adaptive self-configuring sensor network topologies,” SIGCOMM Comput. Commun. Rev., vol. 32, pp. 62–62, 2002.
[14] J.-L. Lu, F. Valois, D. Barthel, and M. Dohler, “Fisco: A fully integrated scheme of self-configuration and self-organization for wsn.” in IEEE/WCNC, 12007.
[15] Y. Deng, S. Grumbach, and J.-F. Monin, “A framework for verifying data-centric protocols,” in FORTE 2011: The 31th IFIP International
Conference on FORmal TEchniques for Networked and Distributed Systems, Reykjavik, Iceland, 2011.