HAL Id: hal-02916064
https://hal.archives-ouvertes.fr/hal-02916064
Submitted on 17 Aug 2020HAL is a multi-disciplinary open access archive for the deposit and dissemination of sci-entific research documents, whether they are pub-lished or not. The documents may come from teaching and research institutions in France or abroad, or from public or private research centers.
L’archive ouverte pluridisciplinaire HAL, est destinée au dépôt et à la diffusion de documents scientifiques de niveau recherche, publiés ou non, émanant des établissements d’enseignement et de recherche français ou étrangers, des laboratoires publics ou privés.
Synthesis, structural elucidation, spectroscopic,
Hirshfeld surface analysis and theoretical simulation of a
new adeninium orthoperiodate (1–) bis(hydrate)
organic–inorganic hybrid crystals
Rim Benali-Cherif, Radhwane Takouachet, Wahiba Falek, Nourredine
Benali-Cherif, Christian Jelsch, Hocine Merazig, Meriem Hafied, El-Eulmi
Bendeif, Naima Bouslah Mokhnachi, Kamel Taibi
To cite this version:
Rim Benali-Cherif, Radhwane Takouachet, Wahiba Falek, Nourredine Benali-Cherif, Christian Jelsch, et al.. Synthesis, structural elucidation, spectroscopic, Hirshfeld surface analysis and theoretical simulation of a new adeninium orthoperiodate (1–) bis(hydrate) organic–inorganic hybrid crystals. Journal of Molecular Structure, Elsevier, 2021, 1224, pp.129034. �10.1016/j.molstruc.2020.129034�. �hal-02916064�
Published in
Journal of Molecular Structure, 2020, 129034.
doi.org/10.1016/j.molstruc.2020.129034
Synthesis, structural elucidation, spectroscopic, Hirshfeld surface
analysis and theoretical simulation of a new adeninium
orthoperiodate (1−) bis(hydrate) organic–inorganic hybrid
crystals
Rim Benali-Cherif a,*, Radhwane Takouachet a, Wahiba Falek a, Nourredine Benali-Cherif b, Christian Jelschc, Hocine Merazig d, Meriem Hafied e, El-Eulmi Bendeif c, Naima Bouslah Mokhnachi f, Kamel Taibi g
a
Université Abbes Laghrour .40000, Khenchela. Algeria. e-mail: rym_46@hotmail.com
b
Académie Algérienne des Sciences et Technologie (AAST) Algiers. Algeria. c
Université de Lorraine, CNRS, CRM2, Nancy, France. d
Unité de Recherche de Chimie de l’Environnement et Moléculaire Structurale, Campus de Chaabat Ersas, Université des frères Mentouri-Constantine, 25000 Constantine, Algeria.
e
Department of medicine, Faculty of medical sciences, University Mustapha Benboulaid, Batna2,Algeria. f
University of Sciences and Technology, Houari Boumediene-Faculty of Chemistry, Laboratory of Macromolecular and Thio-organic Macromolecular Synthesis, Algiers, 16111, Algeria.
g
Département SDM, FGMGP/USTHB, 16311, Algérie. Abstract
One novel organic-inorganic hybrid supramolecular compound named Adeninium orthoperiodate (1−) bis(hydrate) (I) has been synthesized and characterized by FT-IR spectroscopy and single-crystal X-ray diffraction complemented with a quantum chemical study performed with DFT method at the B3LYP/3-21G level. The title compound crystallized in the monoclinic centrosymmetric P 21/n space group. In the molecular
arrangement, the different entities are held together through the interplay of intermolecular O···H—N/O and N–H···O hydrogen bonds, that found to be effective in stabilizing the three-dimensional crystal packing. The hydrogen bonds network of (I) contains an interesting cyclic homosynthon of (10) graph set notation involving the adeninium Hoogsteen sites (N6— H1N···N7). The role of such interactions is known to be predominant in the stabilization of the usual 1H,9H tautomer. The different intermolecular interactions of (I) were quantified and analysed using Hirshfeld surface analysis, enrichment ratio (E) and fingerprint plots. The obtained results indicate that the main contributions are ascribed to O···H and H···H interactions. Scanning electron microscopy (SEM) was used to provide an extremely enlarged image of the sample morphology of (I), as well as information on its chemical composition using an energy dispersive X-ray spectrometer (EDS) detector, which confirms that the compound was successfully synthesized. The complementary theoretical achievements were found in a good agreement with respect to the experimental data. Moreover, a natural bond orbital (NBO) analysis was performed to evaluate the nature of bonding and the strength of the intra and inter-molecular interactions. Furthermore, the calculations of HOMO and LUMO energies were carried out to investigate the charge transfer within the molecular
structure. The molecular electrostatic potential maps were used to detect the possible electrophilic and nucleophilic sites in (I).
Introduction
Organic-inorganic compounds have remarkable and considerable potential for scientific studies and technological applications, owing to their ability to combine useful properties of organic compounds (such as straightforward synthetic approach, structural diversity, easily tailored molecular structure and functional properties) and inorganic systems (such as chemical, thermal and mechanical stabilities) [1-4]. Organic-inorganic hybrid materials can generate new functionalities from this association [5,6], like magnetic, ferromagnetic and electric properties, semi conductivity and photoluminescence[7-11]. On the other hand, an important part of hybrid materials have been investigated and developed for non-linear optical (NLO) properties and applications [12-15]. Moreover, this category of compounds, has surprized the photovoltaic community with its remarkable performance and rapid progress in the past decade [16,17]. Recently, a rapid development of organic-inorganic hybrid materials based on DNA and RNA building blocks has been observed. Owing to the unique aromatic heterocyclic structure and flexible molecular tailor ability, adeninium derivatives have attracted many researchers to study their applications in functional materials, e.g., as an ideal bio-based platform candidate to replace petroleum-based aromatic/heterocyclic structures [18]. Furthermore, adenine can also be used as a novel hole-injection layer of OLEDs [19-21]. In addition, recent studies reveal the excellent performance of adeninium derivatives in medicine [22,23]. It has been shown that the abnormal variations of adenine concentration levels suggest likely deficiency and mutation in the immunity system and may indicate the presence of different diseases such as AIDS and cancers [24-26]. All these interesting properties and implications are closely related to the intermolecular interactions and more particularly to the charge transfer phenomenon that plays an essential role in the energetic processes of biological systems.
In this context, the development of adeninium based organic-inorganic hybrid materials continues to grow and a considerable number of research groups have gained great interest. A careful research on the Cambridge Structural Database (CSD, ConQuest Version 2.0.5, 2020) [27-29] for crystal structures containing adeninium cations results in 78 hits, 33 of them are charge transfer hybrid compounds. One notes that adenine offers five available protonation sites (Fig. 1a; basicity order N9 > N1 > N7 > N3 > N6-exocyclic) allowing a wide range of neutral tautomers and protonated forms. Adeninium cations can be either mono- or deprotonated and the bond lengths and angles are dependent on the degree of protonation [30
-31]. This canonical tautomeric form contains three basic N atoms. The most basic site is N1 (pKa = 4.2), which accepts the first proton. The second protonation occurs at N7 (pKa = -0.4) and the third one at N3 (pka = -4.2). In addition, our survey on the CSD reveals the presence of 58 adeninium cations monoprotonated at N1, 8 monoprotonated at N3 and 17 diprotonated at N1 and N7.
Among the interesting features found and discussed in adeninium based hybrid compounds is the existence of recurrent homo and heterosynthons in their three-dimensional hydrogen bonds network. Sridhar and co-workers [32], who studied adeninediium hemioxalate chloride, showed that the supramolecular hydrogen-bonded network of this compound exhibits cyclic heterosynthon of (8) hydrogen-bonding motif [33] resulting from N—H···O hydrogen bonds between the adeninium cation and the oxalate anion. Similar
findings were also reported in other adeninium carboxylate compounds [34,35]. In their work on bis adeninium dinitrate monohydrate, Hingerty et al [36] showed the existence of a cyclic homosynthon (10) motif.
Based on the above facts, we focus in the present work on a new adeninium-based hybrid compound: adeninium orthoperiodate (1−) bis (hydrate), C5H6N5. H4IO6. 2H2O (I), along with its X-ray crystal structure and spectroscopic measurements (FT-IR, SEM-EDS). Complementary density functional theory (DFT) calculations were performed and compared to the experimental results. The graph-set descriptors of the intra- and intermolecular hydrogen bonding interactions stabilizing (I) were also reported and discussed. The structural analysis was coupled with Hirshfeld surface analysis and the associated contacts enrichment ratio (E) to evaluate the contributions of different intermolecular interactions.
1. Experimental
1.1.Synthesis and crystallization
All chemicals (reagents and solvents) were used as purchased from Sigma-Aldrich without further purification. Single crystals of C5H6N5.H4IO6.2H2O were grown by the slow
evaporation solution growth technique at room temperature. Adenine (1 mmol) dissolved in water (30 ml) was slowly added under stirring to periodic acid (1.2 mmol) and mixed using a magnetic stirrer to ensure homogeneous concentration in the entire volume of the solution. Colorless transparent needles crystals started to form after a few weeks.
1.2.Single crystal X-ray diffraction and structure refinement details
The single crystal diffraction measurements of (I) were performed on a Bruker APEX II diffractometer equipped with a CCD area detector at 298 K with a graphite monochromatized MoKα radiation, λ = 0.71073 Å. Crystal data, data collection and structure refinement details of (I) are summarized in Table. 1. The structure has been solved by direct methods using the program SIR2014 [37] and was refined against F2 by weighted full-matrix least squares methods including all reflections with SHELXL-2018 program [38]. All calculations were carried out using WingX software package [39]. Structural representations were drawn using MERCURY [40]. All absorption corrections were performed with the REFDELF program [41]. All non-H atoms were refined anisotropically. The electron densities of the amine hydrogen atoms were clearly identified in the difference density Fourier maps and their atomic coordinates and isotropic displacement parameters were refined. However, H atoms of cation cycles and periodate acid were placed in the calculated positions. H atoms of water molecules were positioned by the Cal-OH software [42].
1.3. Computational methods
The calculations were carried out by means of the DFT theory [43] at the B3LYP/3-21G level. The geometrical parameters of (I) has been fully optimized, vibrational analysis was performed at each stationary point found, that confirm its identity as an energy minimum (number of imaginary frequencies = 0). The population analysis has also been performed by the natural bond orbital method (NBO) theory [44].Gaussian09 software [45] was used for all calculations.
1.4.IR measurement
Fourier-transform infrared (FT-IR) spectrum of the title compound was recorded at room temperature with a Perkin Elmer FTIR Spectrum Two, using attenuated total reflection (ATR) mode. The FT-IR spectrum was collected in the wavenumber range of 4000-400 cm-1 during 32 scans, with a resolution of 2 cm-1. The sample was mixed with KBr (spectroscopy grade), finely ground, and pressed into pellets.
1.5.Micrographs and X-ray microanalysis
The morphology of crystals was observed by a scanning electron microscope (SEM, JEOL 6360) operating at 30 kV, and equipped with an energy-dispersive X-ray microanalysis system (EDXMA, Inca Energy 200).
Table 1. Main crystallographic data and structure refinement details for (I). Crystal data
Empirical Formula Molecular weight (g/mol) Diffractometer, Radiation type T (K) Calculated density (Mg/m3) Crystal system Space group a (Å) b (Å) c (Å) (°) V (Å3) Z µ (mm-1) Crystal size (mm) Tmin, Tmax
No. of measured, independent and observed [I > 2(I)] reflections
R(int)a Refinement
R[F2> 2(F2)] b, wR(F2) c, S d No. of unique reflections No. of parameters Δρmax, Δρmin (e Å-3) C5 H14 I N5 O8 399.11 Bruker APEX-II CCD Mo K (=0.71073 Å) 298 2.169 Monoclinic P 21/n 12.7156(2) 5.1411(1) 18.7911(3) 95.778(1) 1222.17(4) 4 2.67 0.25 × 0.12 × 0.11 0.136, 0.766 10209, 9291, 8725 0.031 0.038, 0.108, 1.13 9291 176 1.25, −2.79 a
R(int) = Σ(Fo2 – <Fo2>)] /Σ(Fo2)
bR
1 = Σ||Fo|–|Fc|| /Σ|Fo|.
c
wR2 = {[Σw(Fo2–Fc2)2] /[Σw(Fo2)2]}1/2.
dGoodness-of-fit S = [Σw(Fo2 − Fc2)2/(n − p)]1/2, where n is the number of reflections and p the number
2. Results and discussion
3.1 Description of crystal structure
Adeninium orthoperiodate (1−) bis (hydrate) crystallizes in the P21/n centrosymmetric
space group belonging to monoclinic crystal system. Crystallographic data, measurements and refinement details for (I) are presented in Table 1. The bond lengths and angles are given in
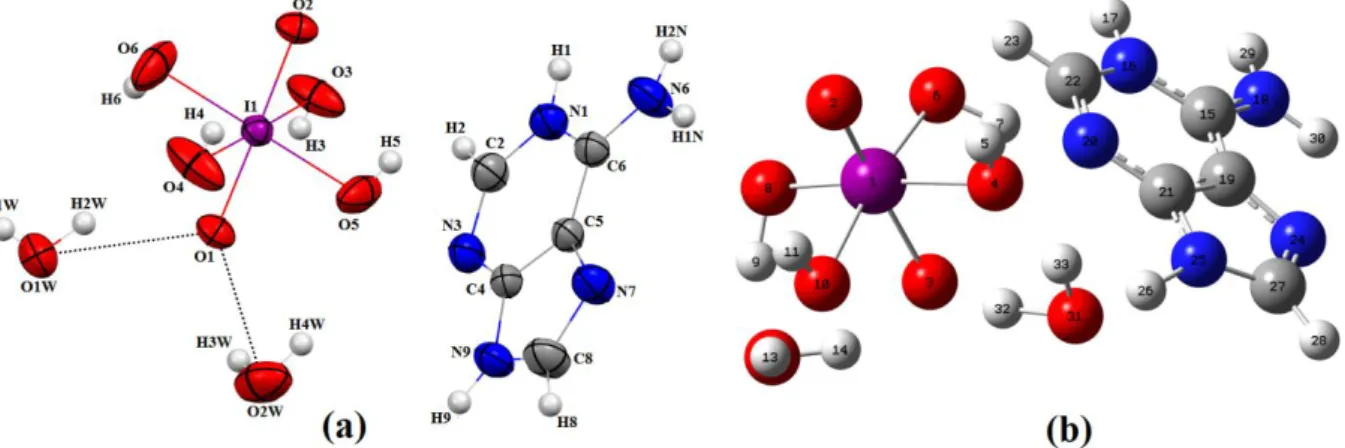
Table S1 whereas hydrogen bonding interactions that stabilize the crystal structure are listed in Table 2. The asymmetric unit of (I) consists of one protonated adeninium organic cation (C5H6N5+), one orthoperiodate (1−) anion (H4IO6)- and two water molecules as shown in Fig.
1. The adeninium cation in this compound is monoprotonated at N1 atom. This is reflected in enlargement of the C—N—C bond angle at the protonation site N1. The [C6—N1—C2 = 123.44(15) °] internal angles is significantly increased from the reported values of 119.8° for unprotonated adenine [46]. This protonation enlarges the C—N—C angle by +3.64° (see
Table S1). The cation adopts the most common 1H, 9H-adeninium tautomer [47-49]. The adenine base is nearly planar, with an r.m.s. deviation from the least-squares plane through the nine atoms of the base (C6/N1/C2/N3/C4–C5/N7/C8/N9) of 0.002 Å. The maximum deviations from this mean plane is 0.0221 (2) Å for atom N1. The six oxygen atoms of the orthoperiodate anion occupy the corners of a slightly distorted octahedron with iodine near the center. Four of the oxygen atoms are directly linked to the hydrogen atoms. For these four oxygen atoms the average distance to the central iodine atom is 1.9027(16) Å with I—O bond lengths ranging from 1.8947(17) to 1.9147(17) Å. For the two remaining oxygen atoms, the I—O1 and I—O2 distances are much shorter; 1.8104(12) and 1.8182(12) Å, respectively
Fig. 1. (a) View of the asymmetric unit of (I), showing the hydrogen-bonds between orthoperiodate (1−) acid and water molecules. Displacement ellipsoids are drawn at the 50% probability level. (b) Optimized structure of (I).
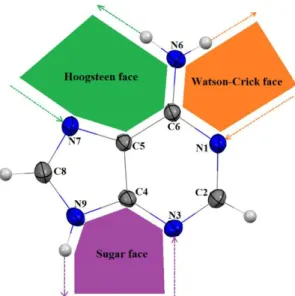
Adenine ensures crystal cohesion via its multiple functional groups. The external amine group and the two imidazole and pyrimidine rings of adenine have a strong property to build bridges via hydrogen bonds. The N atoms of Adenine molecule are assigned in Fig. 2 according to IUBMB nomenclature to facilitate the description of the structure analysis.
Fig. 2. Adenine structure showing the numbering scheme and the Watson–Crick, Hoogsteen and sugar faces.
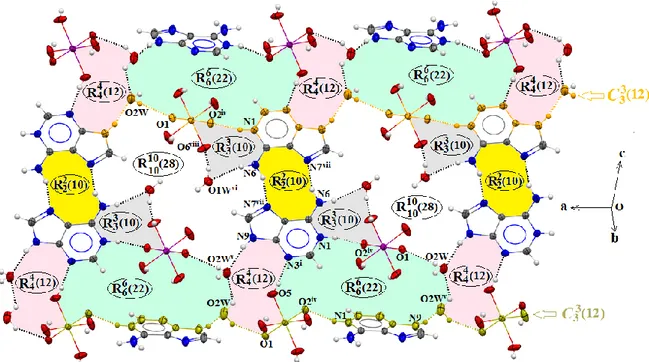
The crystal structure of (I) has an arrangement that can be described as being composed of planes constituted by adeninium cations, orthoperiodate anions and water molecules leading to the formation of parallel chains extended along the b-axis direction. It is interesting to note the presence of adeninium-adeninium self-association base pairs in the title compound. The formed cationic dimers are situated on the vertices and in the middle of the unit cell (Fig. 3b). Hydrated orthoperiodate anion are also forming chains along the b-axis. The crystal packing displays an alternating cationic and of anionic layers parallel to the plane formed by b and a+c directions (Fig. 3a). The orthoperiodate anions deploys also zigzag chains along the c-axis (Fig. 3a).
Water molecules play an important role in stabilizing the crystal packing, they contribute to bridge the two layers via O2W—H4W···O2W hydrogen bonds with H···O distance of 3.038 Å (Symmetry code: (ix) −x+3/2, y−½, −z+½). The combination of these interactions gives rise
to a chain described by the (2) graph set along the b-axis (Fig. 5).
Fig. 3. Projection of the (I) structure (a) along the crystallographic a-axis (For more clarity, the water molecules O1W are drawn in blue and O2W in yellow, the organic cations are
drawn in red and the anionic octahedra in purple) (b) along the b direction showing the formation of parallel layers. Dashed lines indicate intermolecular interactions.
From the variety of bidentate hydrogen-bonded base pairs which can be formed by adeninium cations, only one is observed in the structure of (I): a centrosymmetric trans Hoogsteen/Hoogsteen edge pair with two N6—H1N···N7 (Symmetry code: (vii) −x+1, −y, −z+1) interactions thereby generating a homosynthon (10) hydrogen-bonding motif [33] (Fig. 4). This homosynthon (10) motif that mimics the Hoogsteen pattern has been observed in similar adenine-based hybrid compounds formed with different oxoanions, namely; bis adeninium dinitrate monohydrate [36], adeninium perchlorate adenine dihydrate [50] and adeninium perchlorate [51]. Despite the fact that the adeninium-anion supramolecular heterosynthon motifs are one of the classic motifs frequently observed in similar structures [52], we however note their total absence in the title compounds. Moreover, it should be noted that the planar edge-to-edge Ade–Ade non-Watson–Crick base pairing in the trans-sugar/sugar homosynthon mode is not present in (I) although it is commonly observed in similar adeninium-based structures [53, 54].
Atom N1 and atom N6 from Watson–Crick edge are exposed to periodate anions via N1— H1···O2 (Symmetry code: (iv) −x+½, y+½, −z+½) hydrogen bonds and water molecules via N6—H2N···O1W (Symmetry code: (vi) x−½, −y+½, z+½) hydrogen bonds.On another side, atom N9 and atom N3 from the sugar edge are combined with periodate anions via O5— H5···N3 (Symmetry code: (i) x, y−1, z) hydrogen bonds and water molecules via N9— H9···O2W (Symmetry code: (v) −x+3/2, y+½) hydrogen bonds (Fig. 4). Furthermore,
adeninium cations, orthoperiodate anions and water molecules are interconnected to gives rise to twelve membered chains described by the (12) graph set motif along the a-axis (Fig. 4). In addition, the combination between these three entities by means of intermolecular interactions also produces four different graph-set motifs denoted (10), (12), (22) and
(28) which are clearly depicted in Fig. 4. All these motifs are positioned around the
symmetry inversion center located in the middle of the (10) motif formed by the adeninium-adeninium self-association base pairs (Fig. 4).
It is important to remark that the adeninium cations show aromatic stacking, essentially with the symmetry related molecules (1-x,1-y,1-z). There is also stacking between the adeninium and the NH2 part (atom N6) related by translation b (See Fig. 6b, Fig. S2). The distance between two adeninium moieties related by (1-x,1-y,1-z) inversion centre is d=3.440(16) Å. For the parallel displaced stacking (translation along short axis b=5.141 Å), the interplanar distance is 3.317(18) Å and the displacement is 3.93 Å.
Fig. 4. Fragment of the (I) structure showing the graph set resulting from the hydrogen bonding.
The crystal packing is also maintained by two strong O—H···O [O3—H3···O2= 2.616 (2) Å and O4—H4···O1= 2.621 (2) Å] hydrogen bonds established between anions leading to the formation of (8) ring motifs which run parallel to the b-axis (Fig. 5).Also, the combination between anions and water molecules via O6—H6···O1W and O1W—H1W···O6 hydrogen bonds gives rise to an five membered chains described by (5) graph set along the same direction (Fig. 5).
Fig. 5. Partial packing view of the title compound, showing the formation of (8) rings motifs through O—H···O hydrogen bonds established between anions and two infinite chains
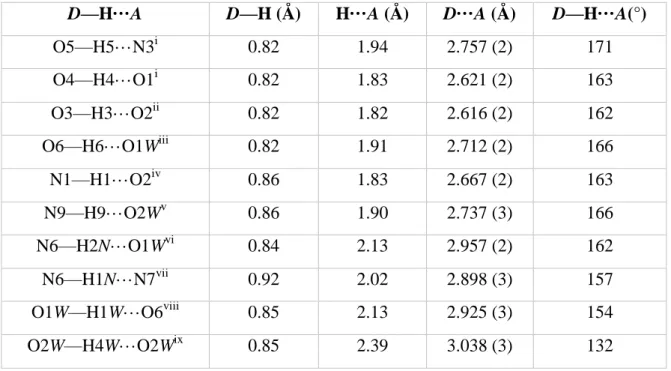
Table 2.Selected hydrogen bonds parameters (Å, °).
D—H···A D—H (Å) H···A (Å) D···A (Å) D—H···A(°)
O5—H5···N3i 0.82 1.94 2.757 (2) 171 O4—H4···O1i 0.82 1.83 2.621 (2) 163 O3—H3···O2ii 0.82 1.82 2.616 (2) 162 O6—H6···O1Wiii 0.82 1.91 2.712 (2) 166 N1—H1···O2iv 0.86 1.83 2.667 (2) 163 N9—H9···O2Wv 0.86 1.90 2.737 (3) 166 N6—H2N···O1Wvi 0.84 2.13 2.957 (2) 162 N6—H1N···N7vii 0.92 2.02 2.898 (3) 157 O1W—H1W···O6viii 0.85 2.13 2.925 (3) 154 O2W—H4W···O2Wix 0.85 2.39 3.038 (3) 132
Symmetry codes: (i) x, y−1, z; (ii) x, y+1, z; (iii) −x+1, −y+1, −z; (iv) −x+½, y+½, −z+½; (v) −x+3/2, y+½, −z+½; (vi) x−½, −y+½, z+½; (vii) −x+1, −y, −z+1; (viii) −x+1, −y, −z; (ix) −x+3/2, y−½, −z+½.
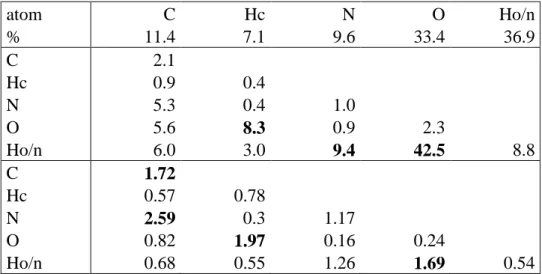
3.2. Hirshfeld surface analysis and contacts enrichment ratio
Analysis of intermolecular interactions using the Hirshfeld surface (HS) was undertaken to gain a better understanding of the three-dimensional crystal packing of (I). The Hirshfeld surface was computed with the MoProViewer software [55]. The decomposed two-dimensional fingerprint plots (Fig. 7) were calculated using Crystal Explorer 3.1 software [56]. The contact enrichment ratio Exy [57] between chemical species X and Y was obtained
by comparing the actual contacts Cxy in the crystal with those computed as if all types of contacts had the same probability to form. The chemical nature of contacts and their enrichment in the crystal structure are shown in Table 3. For both softwares, the Hirshfeld surface was computed on the asymmetric unit made of moieties in the crystal packing that are not in contact with each other in order to obtain an integral surface around each entity (anion, cation, water molecules).
The visualization of the Hirshfeld three-dimensional surface of compound (I) is shown in (Fig. S4). The deep red spots on the dnorm Hirshfeld surfaces indicate the close-contact
interactions, which are mainly responsible for the significant intermolecular O—H···O and N—H···O hydrogen bonds.
The Hirshfeld surface fingerprint plots of various intermolecular contacts generated for the adeninium cation and periodic acid are depicted separately in Fig. 7a and b. The decomposed
fingerprint plots include the reciprocal X···H contacts in which X atom is located inside (de <
di) the generated HS.
The contributions of H···H contacts to the total Hirshfeld surface for both the cation and anion moieties appear in the middle of the scattered points in the two-dimensional fingerprint maps. These contacts have an important contribution to the HS and represents 27.7% for adeninium cation and 18.6% for orthoperiodate anion. For the adeninium cation we observe the presence of the shortest H···H contacts in the packing, at ca 1.92 Å corresponding to the N6—H2N···H1W—O1W interaction. The conspicuous presence of strong O—H···O hydrogen bonds [O3—H3···O2 and O4—H4···O1] for the orthoperiodate anion, results in the occurrence of two long sharp spikes with a considerable contribution of H···O and O···H contacts corresponding to 65.8% of the total HS areas. The presence of this long spike is characteristic of strong hydrogen bonds as indicated by the shortest O···H contacts of 1.69 Å associated with the cation—anion N1—H1···O2 interactions. It is important to note that these interactions appear as a sharp spike in the upper part of the adeninium 2D fingerprint plots and represents 21.9% of the total HS areas.
The N···H/ H···N contacts of the adeninium cation, with a contribution of 25.1% appear as two sharp spikes, with the closest contacts of 1.783 Å. These contacts are assigned to the N3···H5—O5 interaction between the N3 atom of the pyrimidine moiety of adenine base and the H5 hydrogen of the orthoperiodate acid. From the 2D plots of the anions, we observe that the contribution of these contacts is less significant and it represents only 6.4%.
C···H/H···C is another significant interaction observed in the fingerprint plots of the adeninium cation. Moreover the C···N/N···C contacts reach 7.5% on the HS areas and correspond to aromatic stacking interactions.
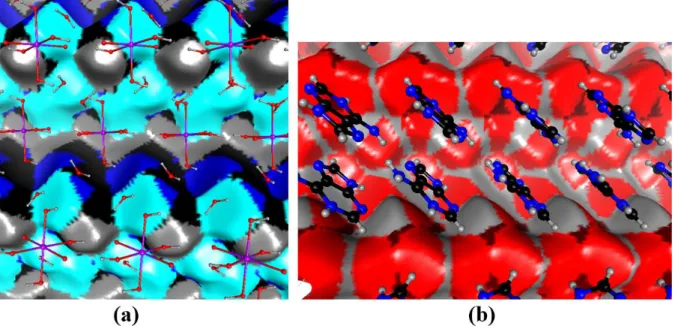
Fig. 6. View of Hirshfeld surface at the interface between the cation shell and the orthoperiodate/water shell. The view is a crystallographic Autostereogram [58]). The first shell of molecules in front of the surface is shown. The surface is coloured according to the atom type which is behind.
(a) red: oxygen, dark blue: nitrogen , light blue: Hn hydrogen, grey: Hc hydrogen. (b) red: oxygen, grey: Ho hydrogen
Fig. 7. 2D fingerprint plots of the HS (a) around the adeninium cation (b) around the periodate anion; the areas of different intermolecular contact types are clearly shown.
The intermolecular interactions in (I) were further evaluated by computing the enrichment ratios (E) in order to highlight which contacts are over-represented and are likely to represent energetically strong interactions and the driving force in crystal formation (Table 3). The polar atoms O and hydrogen Ho/n constitute 70.3 % of the Hirshfeld surface. More than half of the contact surface is constituted by the O···H/H···O contacts with the strong H-bonds O···Hn/o representing at 42% the most abundant contact type. Globally the polar contacts, involving only O and Ho/n, represent 53.6% of the surface. The N⋯C contacts represent less than 5.5% of the contact surface but are, by far, the most enriched at EN,C = 2.59, due to
extensive parallel displaced stacking between adeninium cations. The O⋯Hc weaker hydrogen bonds constitute the third largest interaction surface and have the second largest enrichment (E = 1.97). The Ho/n···O contacts show a high enrichment (E = 1.69), they corresponds to eight hydrogen bond (Table 2) and can be considered as one of the driving
force in the formation of the packing. The hydrophobic C···C contact are rare but quite enriched at EC,C = 1.72 due to stacking between the pyrimidine and imidazole moieties of the
cations (Fig. 6b).
Table 3. Statistical analysis of intermolecular contacts on the Hirshfeld surface. The second row shows the chemical content on the Hirshfeld surface. Cxy represent the actual contact
types and Exy their enrichment ratios. Reciprocal contacts (X···Y and Y···X) are merged. The
main contacts and the most enriched ones are highlighted in bold. The more hydrophobic Hc hydrogen atoms bound to carbon were distinguished from the polar H atoms bound to nitrogen or oxygen (Ho/n).
atom C Hc N O Ho/n % 11.4 7.1 9.6 33.4 36.9 C 2.1 Hc 0.9 0.4 N 5.3 0.4 1.0 O 5.6 8.3 0.9 2.3 Ho/n 6.0 3.0 9.4 42.5 8.8 C 1.72 Hc 0.57 0.78 N 2.59 0.3 1.17 O 0.82 1.97 0.16 0.24 Ho/n 0.68 0.55 1.26 1.69 0.54
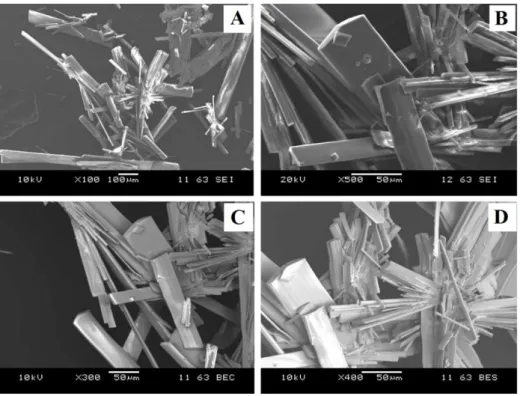
3.3. Energy dispersive X-ray spectroscopy (SEM/EDS)
SEM pictures (Fig. 8A and 8B) give topographic information on the sample. These pictures clearly show that the crystals have a needle shape. This morphology is compatible with the monoclinic structural description obtained from the single crystal diffraction experiment.
SEM pictures by back-scattered electrons (Fig. 8C and 8D) have good sensitivity to chemical homogeneity and chemical composition. One can clearly observe the homogeneous contrast of the analysed samples, which indicates that the synthesized compound is a single phase.
The EDX spectrum (Fig. 9) demonstrates that the new compound consists of Iodine (I), Oxygen (O), Nitrogen (N) and Carbon (C) at concentration levels of 6.83%, 17,25%, 30.03% and 45.88%, respectively. These results indicate that the adeninium orthoperiodate (1−) bis (hydrate) hybrid compound was successfully synthesized.
Fig. 8. SEM images of adeninium orthoperiodate (1−) bis (hydrate) compound. (A) and (B) by secondary electrons, (C) and (D) by back-scattered electrons
Fig. 9. Energy-dispersive X-ray spectrum (EDS) of adeninium orthoperiodate (1−) bis (hydrate) compound.
3.4. FTIR study
FTIR is a very powerful technique to detect the inter/intra-molecular interactions within crystal systems. It is very sensitive to the formation of hydrogen bonds that may stabilize the crystal structure. In such systems, the spectrum of the sample will reveal the appearance of new bands, displacement and / or enlargements of existing bands in comparison to non-developing hydrogen bond systems spectra. These differences will depend on the nature of intermolecular interactions, their number and their relative strengths.
In the 3700-2500 cm-1 region, the sample spectrum presents a wide band with a maximum at 3250 cm-1 and a shoulder at about 3462 cm-1. The width of this band as well as its non-symmetrical shape indicate the presence of different types of hydroxyl groups of both water molecules and orthoperiodate (1−) anion which can develop different forms of associations through hydrogen bond with the adeninium organic cation. Furthermore, the shoulder at 3462 cm-1 is assigned to the stretching vibration of the NH2 groups, while the bending mode of
these groups appeared at 1685 cm-1. It is well known that the amine groups of the adenine content are involved in different types of hydrogen bonding. The presence of the broad hydroxyl band prevents the observation of the displacement of the amine band resulting from these associations. Another band arising from the contribution of the scissor modes of the NH2 groups is situated at 1653 cm-1 while the contribution of the stretching vibration of
C=C groups was observed on the low-frequency side at 1608 cm-1. In the fingerprint region, a few small features appeared in the spectrum resulting from various in-plane bending modes.
The peaks observed from 1465 to 1169 cm−1 are related to the bending vibration of C−H groups.
Fig. 10. Experimental and theoretical FT-IR spectra of (I).
Table 4. Attribution of some principal bands observed on the FTIR spectrum. Observed Wavenumber (cm-1) Assignement FT-IR Exp FT-IR DFT
3522 3617.29 Antisymmetrical stretching mode of
NH2
3462 3517.68 Symmetrical stretching mode of
NH2
3123 2778.23 Stretching mode of (N9-H) groups
3080, 2990 3297.60 (C8-H stretching) 3243.47(C2-H2 stretching) Stretching mode of (C8-H) or (C2-H) groups 1685 1604.50 C=N stretching mode 1608 1423.60 C=C stretching mode
886 947.64 Out-of plane bending of (N9-H)
3.5. DFT quantum chemical calculations 3.5.1 Geometry optimization
The important calculated geometrical parameters including bond lengths and bond angles as compared with the experimental results have been compiled in Table 5. The bond lengths obtained from DFT calculations are slightly larger than the experimental values, while about the bond angles no specified trend was observed. The small differences between the calculated and observed geometrical parameters can be assigned to the fact that the theoretical calculations were carried out with isolated molecules in the gaseous phase whereas the experimental values were based on molecules in the solid state (crystalline state).
Table 5. Some bond lengths (Å) and bond angles (°) in the experimental (X-ray) and optimized structure (DFT) of (I) compound.
Bond lengths (Å) X-ray DFT Bond angles (°) X-ray DFT
C6—N6 C6—N1 N1—C2 N3—C2 N3—C4 C5—C4 C6—C5 C4—N9 N9—C8 N7—C8 I1—O1 I1—O2 I1—O5 I1—O4 I1—O3 I1—O6 1.318 (2) 1.363 (2) 1.353 (3) 1.302 (3) 1.352 (2) 1.383 (2) 1.404 (2) 1.356 (2) 1.354 (3) 1.320 (3) 1.8104 (12) 1.8182 (12) 1.8947 (17) 1.9008 (15) 1.9009 (15) 1.9147 (17) 1.342 1.379 1.395 1.304 1.368 1.424 1.398 1.359 1.372 1.334 1.9565 1.8662 1.9666 2.0517 1.9684 1.9447 N6—C6—N1 C2—N1—C6 N3—C2—N1 C2—N3—C4 N3—C4—C5 C4—C5—C6 N1—C6—C5 N9—C4—C5 C8—N9—C4 N7—C8—N9 C8—N7—C5 N7—C5—C4 120.24 (16) 123.44 (15) 125.16 (18) 112.74 (16) 126.56 (15) 118.16 (16) 113.87 (15) 106.01 (16) 106.43 (16) 113.67 (18) 103.49 (17) 110.40 (15) 121.74 122.35 123.06 113.01 125.33 119.76 114.43 106.68 106.22 114.18 102.62 109.71
3.5.2 Frontier molecular orbital analysis
The highest occupied molecular orbital (HOMO) and the lowest occupied molecular orbital (LUMO) for (I) are sketched in Fig. 11 and the calculated atomic charges are shown in
Fig. 12. The HOMO-LUMO analysis was performed to visualize frontier molecular orbitals as well as to examine the charge transfer within the studied compound. The LUMO represents the ability to accept an electron, while HOMO represents the ability to donate an electron. The difference of energy between HOMO and LUMO is called HOMO-LUMO energy gap, ΔEH-L.
The ability of charge transfer interactions within molecule can be explained by the HOMO-LUMO energy gap [59,60]. The small energy gap between HOMO and LUMO leads to
effective electronic charge transfer from donor groups to acceptor groups, making the molecule highly polarizable. If the molecules have a very large EHOMO-LUMO band gaps
should be less reactive than one having a smaller gap [61]. The HOMO is localized on the orthoperiodate anion and the two water molecules while LUMO is delocalized to adeninium cation; orthoperiodate anion and only one water molecule. The small LUMO‒HOMO energy gap (0.163 eV) indicates that the molecular structure of (I) may suggest a high chemical reactivity [62]and is very favourable for charge transfer.
Fig. 11. The frontier molecular orbitals of (I).
3.5.3. Natural bond orbital (NBO) analysis
NBO analysis stresses the role of intermolecular orbital interaction especially charge transfer within the studied compound. This is carried out by considering all possible interactions between filled donor and empty acceptor. NBOs and estimating their energetic importance by second-order perturbation theory. For each donor NBO (i) and acceptor NBO (j), the stabilization energy E(2) associated with electron delocalization between donor and acceptor is estimated as:
Fig. 12. The calculated atomic charges in (I).
In NBO analysis, a large E(2) value shows the intensive interaction between electron–donors and electron–acceptors and greater the extent of conjugation of the whole system.
From Table 6, the C22-N20 and C21-N25 bond are formed by sp1.00 hybrid orbital, constituting from 100% p orbital contribution. Consequently, the maximum occupancy values of interacting NBOs of (I) suggest that the p-character of the hybrid orbitals controls mainly the interacting NBOs.
It is clear from Table 7 that second-order perturbation theory analysis of Fock matrix in NBO basis, otherwise called stabilization energies or interaction energies of all interacting NBOs of (I) shows strong intramolecular interactions.
The important interaction in this molecule is the interaction LP(2)O12→σ*O8—H9 (91.03Kcal/mol) which is responsible for intermolecular hydrogen bonding between O12 and O8—H9 atoms. Also, the non-bonding interactions LP(2)O3→ LP*(1)H32 (222.76Kcal/mol) increase the stability of the molecular structure of (I).
The interaction LP(2)O4→σ*O31—H33 (41.73Kcal/mol) involves the intermolecular hydrogen bonding and bridged O4 and H33—O31atoms.
The other important interactions in (I) are: LP(1)N18→ σ*C15-N16 (89.28kcal/mol), and σC15—N16→σ*N20—C22 (24.90kcal/mol) which are related to the resonance in adeninium cation.
Table. 6. The main bond distances, occupancies and relative contribution (%) of hybrid atomic orbitals of optimized structure of (I).
Aims bond
Distances (Å) (bond order)
Occupancy (%) of atoms in bond Hybrid AO (%)
I1-O2 I1-O3 C15-N16 C15-N18 C22-N20 C21-N25 C27-N24 C27-N25 C27-H28 C19-C21 C19-N24 1.866(1.00) 1.956(1.00) 1.379(1.50) 1.342(1.50) 1.304(2.00) 1.349(1.50) 1.354(1.50) 1.392(1.00) 1.075(1.00) 1.424(1.50) 1.378(1.50) 1.917 1.908 1.986 1.992 1.870 1.793 1.987 1.985 1.988 1.977 1.977 47.87% I, 52.18%O 39.55% I, 60.45%O 37.89% C, 62.11%N 40.01%C, 59.99%N 40.01%C, 41.74%N 39.47%C, 60.53%N 39.42%C, 60.58%N 38.50%C, 61.50%N 62.19%C, 37.81%H 51.21%C19,48.79%C21 43.33%C, 56.67%N sp19.39 sp1.90 sp1.76 sp1.57 sp1.00 sp1.00 sp.1.93 sp2.08 sp1.66 sp1.99 sp2.22 s(19.94%) p(95.10%) d(0.00%) s(03.71%) p(99.25%) d(0.00%) s(36.24%) p(63.76%) d(0.00%) s(38.95%) p(61.05%) d(0.00%) s(00.00%) p(100.0%) d(0.00%) s(00.00%) p(100.0%) d(0.00%) s(34.12%) p(65.88%) d(0.00%) s(32.44%) p(67.56%) d(0.00%) s(37.57%) p(62.43%) d(0.00%) s(33.48%) p(66.52%) d(0.00%) s(33.48%) p(66.52%) d(0.00%)
Table. 7. Second order perturbation theory analysis of the Fock matrix in NBO basis of optimized structure of (I).
Donor (i) Type Acceptor (j) Type E*(2)a (Kcal/mol) E(j)-E(i)b (a.u) F(i,j)c (a.u.) O3 O3 O4 O12 N20 C15—N16 N18 LP(2) LP(2) Lp(2) LP(2) LP(1) σ LP(1) O12—H14 H32 O31—H33 O8—H9 O6—H7 N20—C22 C15—N16 σ* LP*(1) σ* σ* σ* σ* σ* 33.94 222.76 41.73 91.03 38.09 24.90 89.28 0.83 0.49 1.00 0.63 0.69 0.36 0.19 0.151 0.318 0.183 0.214 0.147 0.087 0.129
∗ Only interactions with highest energy (strongest stabilization) are listed. a E(2) means energy of hyper conjugative interaction (stabilization energy). b Energy difference between donor and acceptor i and j NBO orbitals. c F(i,j) is the Fock matrix element between i and j NBO orbitals.
3.5.4. Molecular electrostatic potential (MEP)
The complementarity of molecular electrostatic potentials (MEP) is believed to be one of the most important factors influencing how molecules interact with each other [63].Thus, investigating the MEP generated by the charge distribution in the space around a molecule is very constructive for the qualitative interpretation of the electrophilic and nucleophilic reactions for the study of hydrogen bonding interactions [64].
To predict the molecular reactive sites, the MEP map of the title compound has been calculated and is shown in Fig. 13. It is seen that the red color surface around orthoperiodate anion with negative MEP belong to high electron density and are related to electrophilic attacks. The blue color surface around adeninium cation corresponds to nucleophilic areas with lowest electron density.
Fig. 13. Molecular electrostatic potential (MEP) surface of (I).
4. Conclusion
In summary, we have described in this work the synthesis, experimental and theoretical characterization of a novel adeninium-based organic-inorganic hybrid compound, formulated as C5H6N5. H4IO6. 2 H2O (I). This compound crystallizes at room temperature in centrosymmetric monoclinic system with space group P 21/n. The atomic arrangement can be
described as an alternation of organic and inorganic layers which are parallel to the plane formed by directions b and a+c. The orthoperiodate anions deploys zigzag chains along the c-axis. The crystal packing of (I) is governed by intermolecular O···H—N/O and N–H···O H-bonding. Interestingly, the three-dimensional hydrogen bonds network of (I) presents a cyclic homosynthon (10) motifs generated by the adeninium-adeninium self-association base pairs. Furthermore, adeninium cations, orthoperiodate anions and water molecules are interconnected via (12) chains along the a-axis and by means of intermolecular interactions, producing four different cyclic motifs (10), (12), (22) and (28). In addition, one notes that the aromatic stacking generated by the adeninium cations contributes to the stabilization of the crystal packing.
We have shown that there are no adeninium-anion supramolecular heterosynthon motifs, neither adeninium–adeninium non-Watson–Crick base pairing even though they are commonly observed in similar adeninium-based structures. The Hirshfeld surface analysis, enrichment ratio (E) and fingerprint plots provide more detailed examination by displaying all the intermolecular interactions in the crystal. These analyses show that the main contributions to the Hirshfeld surfaces areas are provided by O···H interactions (65.8%) for orthoperiodate anions and H···H contacts (27.7%) for adeninium cations.
The FT-IR spectroscopy was used for the characterization of the synthesized compound and confirms the presence of organic and inorganic entities, while the chemical composition of (I) has been confirmed by semi-quantitative EDX analysis. The structural and vibrational spectra calculated by DFT/ B3LYP/3-21G method are consistent with the experimental data. The calculated energy gap of 0.163 eV indicates the chemical reactivity and kinetic stability of (I) as well as the charge transfer process taking place within its molecular structure. The complementary Molecular Electrostatic Potentials (MEP) evaluation of (I) showed that the negative potential area is concentrated around orthoperiodate anion while the positive potential region is mainly localized over the adeninium cation. NBO analysis confirms the existence of intra and inter-molecular hydrogen bonding interactions in (I).
Our study shows that (I) is very promising, therefore we plane to perform additional investigations to explore and try its potential usefulness and fruitful application in multiple fields.
Acknowledgements
R. Benali-Cherif is indebted to the Algerian Ministry of Research and University Abbes Laghrour- Khenchela for financial support. We are grateful for measurement time on the X-ray diffraction platform PMD²X of the Institut Jean Barriol.
Appendix A. Supplementary data
CCDC No. 1974604 for compound (I) contains the supplementary crystallographic data for this paper. The data can be obtained via www.ccdc.cam.ac.uk/datarequest/cif by e-mailing
data_request@ccdc.cam.ac.uk or by contacting the Cambridge Data Cente, 12 Union Road, Cambridge, CB2IEZ, UK.
Keywords: Adeninium hybrid compound; Aromatic stacking interactions; Cyclic homosynthon; Hirshfeld surface analysis; Theoretical calculations.
References.
[1] W. Cui, K. Wua, X. Liua, L. Wena, B. Ren, Thermochim. Acta 521 (2011) 80-83.
[2] A. Vishwakarma, P. Ghalsasi, A. Navamoney, Y. Lan, A. Powell, Polyhedron 30 (2011) 1565-1570.
[3] L. Dobrzycki, J. Mol. Struct. 921 (2009) 18-33.
[4] I. Chaabane, F. Hlel, K. Guidara, J. Alloys Compd. 461 (2008) 495-500.
[5] R. Takouachet, R. Benali-Cherif, E-E. Bendeif, N. Benali-Cherif, S. Pillet, D. Schaniel, Inorganica Chimica Acta. 446 (2016) 6–12.
[6] M. S. Lassoued, M. S.M. Abdelbaky, W. Ben Soltan, A. Lassoued, S. Ammar, A. Gadri, A. Ben Salah, S. García-Granda, J. Mol. Struct. 1158 (2018) 221-228
[7] A. Ben Ahmed, H. Feki, Y. Abid, Spectrochim. Acta A Mol. Biomol. Spectrosc. 133 (2014) 357–364.
[8] K. Karoui, A.B. Rhaiem, K. Guidara, Phys. B 407 (2012) 489–493.
[9] N. Karâa, B. Hamdi, A. Ben Salah, R. Zouari, J. Mol. Struct. 1049 (2013) 48-58.
[10] I. Dhouib, H. Feki, P. Guionneau, T. Mhiri, Z. Elaoud, Spectrochimacta A. 131 (2014) 274-281.
[11] A. Sakka, A. Jellali, B. Hamdi, M. S.M. Abdelbaky, H. Naïli, S. García-Granda, R. Zouari, J. Mol. Struct. 1198 (2019) 126867
[12] J. Dalal, N. Sinha, B. Kumar, Opt. Mater. 37 (2014) 457-463.
[13] H. Dammak, H. Feki, H. Boughzala, Y. Abid, Spectrochimica. A. Mol. Biomol. Spectrosc, 137 (2015) 1235-1245.
[14] N. Chihaoui, B. Hamdi, T. Dammak, R. Zouari, J. Mol. Struct. 1123 (2016) 144-152
[15] H. Athmani, C. Kijatkin, R. Cherif, S. Pillet, D. Schaniel, M. Imlau, N. Benali-Cherif, E-E. Bendeif, Acta Cryst. A75 (2019) 107-114.
[16] Q. Chen, N.D. Marco, Y. Yang, T.-B. Song, C.-C. Chen, H. Zhao, Z. Hong, H. Zhou, Y. Yang, Nano Today. 10 (2015) 355–396.
[17] Z-F. Chang, B. He, H. Wang, Y. Zong, X. Zhang, L. Huang, S. Zhang, Q. Zhong, Tetrahedron Letters, 60 (2019) 151125.
[18] J. Hu, Z. Wang, Z. Lu, C. Chen, M. Shi, J. Wang, E. Zhao. K. Zeng, G. Yang, Polymer. 119 (2017) 59-65
[19] E.F. Gomez, A.J. Steckl, ACS. Photonics. 2 (2015) 439-445.
[21] I. Burneo, K.C. Stylianou, S. Rodríguez-Hermida, J. Juanhuix, X. Fontrodona, I. Imaz, D. Maspoch, Cryst. Growth. Des. 15 (2015) 3182-3189
[22] L. Zhang, R. Li, P. Tong, G. Chen, Chem. J. Chin. U 26 (2005) 1437-1439.
[23] H. Oh, T. Li, Chem. Eur. J. 21 (2015) 17010-17015.
[24] S.S. Wallance, Free. Radic. Biol. Med. 33 (2002) 1-14
[25] F. Xiao, F. Zhao, J. Li, L. Liu, B. Zeng, Electrochimica. Acta. 53 (2008) 7781-7788.
[26] A.A. Ensafi, M.M. Abarghoui, B. Rezaei, Sens. Actuator B-Chem. 204 (2014) 528-535.
[27] F. H. Allen, Acta. Cryst. B58 (2002) 380-388.
[28] C. R. Groom, I. J. Bruno, M. P. Lightfoot & S. C. Ward, Acta. Cryst. B72 (2016) 171-179.
[29] C. H. Görbitz, Acta. Cryst. B 72 (2016) 167-168.
[30] B. E. Hingerty, J. R. Einstein. & C. H. Wei, Acta Cryst. B37 (1981) 140-147.
[31] V. Langer. & K. Huml, Acta Cryst. B34 (1978)1157-1163.
[32] B. Sridhar, K. Ravikumar, & B. Varghese, Acta Cryst. Sect. C65 (2009) 202-206.
[33] J. Bernstein, R. E. Davis, L. Shimoni & N-L. Chang, Angew. Chem. Int. Ed. 34 (1995) 1555-1573
[34] B. Sridhar, & K. Ravikumar, Acta Cryst. C63 (2007) o212–o214.
[35] Sridhar, B. & Ravikumar, K. (2007). Acta Cryst. C63, o415–o418.
[36] B. E. Hingerty, J. R. Einstein & C. H. Wei, Acta Cryst. B37 (1981) 140-147.
[37] M. C. Burla, R. Caliandro, B. Carrozzini, G. L. Cascarano, C. Cuocci, C. Giacovazzo, M. Mallamo, A. Mazzone and G. Polidori, J. Appl. Cryst. 48 (2015) 306-309.
[38] G.M. Sheldrick., Crystal structure refinement with SHELXL, Acta Cryst. C71 (2015) 3-8.
[39] L.J. Farrugia, J. Appl. Crystallogr. 45 (2012) 849-854.
[40] C. F. Macrae, I. Sovago, S. J. Cottrell, P. T. A. Galek, P. McCabe, E. Pidcock, M. Platings, G. P. Shields, J. S. Stevens, M. Towler and P. A. Wood, J. Appl. Cryst. 53 (2020) 226-235.
[42] M. Nardelli, J.Appl.Cryst. 32 (1999) 563-571.
[43] T. Ziegler, Chem. Rev. 91 (1991) 651-667.
[44] X. Shu-Hong, Z. Ming-yu, J. Chem. Phys. Lett. 421 (2006) 447.
[45] M.J. Frisch, G.W. Trucks, H.B. Schlegel, G.E. Scuseria, M.A. Robb, J.R. Cheeseman, G.Scalmani, V.Barone, B. Mennucci, G.A Petersson, H. Nakatsuji, M.Caricato, X. Li, H.P. Hratchian, F.A. Izmaylov, J. Bloino, G. Zheng, J. L. Sonnenberg, M.Hada, M. Ehara, K.Toyota, R. Fukuda, J. Hasegawa, M. Ishida, T. Nakajima, Y. Honda, O.Kitao, H. Nakai, T. Vreven, J. A. Montgomery, Jr, J. E Peralta, F. Ogliaro, M. Bearpark, J. J. Heyd, E. Brothers, K. N. Kudin, V. N. Staroverov, R. Kobayashi, J. Normand, K. Raghavachari, A. Rendell, J. C. Burant, S. S. Iyengar, J. Tomasi, M. Cossi, N. Rega, J. M. Millam, M. Klene, J. E. Knox, J. B, Cross, V. Bakken, C. Adamo, J. Jaramillo, R. Gomperts, R. E. Stratmann, O. Yazyev, A. J. Austin, R. Cammi, C. Pomelli, J. W. Ochterski, R. L. Martin, K. Morokuma, V. G. Zakrzewski, G. A, Voth, P. Salvador, J. J. Dannenberg, S. Dapprich, A. D, Daniels, Ö. Farkas, J. B. Foresman, J. V.Ortiz, Cioslowski J, and D. J. Fox, Gaussian 09, (2009), (Gaussian, Inc., Wallingford CT).
[46] D. Voet, & A. Rich, Prog. Nucleic Acid Res. Mol. Biol. 10 (1970) 183-265.
[47] P. Kumar, M. K. Cabaj, A. Pazio, P. M. Dominiak, IUCrJ. 5 (2018) 449-469
[48] M. Ayed, I. Mestiri, B. Ayed, A. Haddad, Journal of Molecular Structure. 1128 (2017) 368-377
[49] L. Bendjeddou, A. Cherouana, S. Dahaoui, N. Benali-Cherif, & C. Lecomte, Acta Cryst. E59 (2003) o649-o651.
[50] V. Zelenák, Z. Vargová and I. Císarová, Acta Cryst. E60 (2004) o742-o744
[51] H.-K. Fun, J. H. Goh, A. C. Maity and S. Goswami, Acta Cryst. E67 (2011) o427.
[52] M. Otręba, D. Budzikur, Ł. Górecki and K. A. Ślepokura, Acta Cryst. C74
(2018).571-583.
[53] V. Langer, K. Huml and J. Zachová, Acta Cryst. B35 (1979) 1148-1152.
[54] V. Langer, K. Huml and L. Lessinger, Acta Cryst. B34 (1978) 2229-2234.
[55] B. Guillot, E. Enrique, L. Huder, C. Jelsch, Acta Cryst. A70 (2014) C279.
[56] J. J. McKinnon, D. Jayatilaka, M. A. Spackman,.Towards quantitative analysis of intermolecular interactions with Hirshfeld surfaces. Chemical Communications, 37 (2007) 3814-3816.
[57] C. Jelsch, K. Ejsmont, & L. Huder. The enrichment ratio of atomic contacts in crystals, an indicator derived from the Hirshfeld surface analysis, IUCrJ. 1(2) (2014) 119-128.
[58] A. Katrusiak, Crystallographic autostereograms, J Mol Graph Model. 2001;19(3-4):363-7, 398.
[59] A.F. Jalbout, B. Trzaskowski, A.J. Hameed, J. Organomet. Chem. 691 (2006) 4589-4594.
[60] A.F. Jalbout, A.J. Hameed, B. Trzaskowski, J. Organomet. Chem. 692 (2007) 1039-1047.
[61] M.J. Frisch, G.W. Trucks, H.B. Schlegel, Gaussian 09, revision B.01, Gaussian inc., C.T.
Wallingford, 2009.
[62] R.M. Yosadara, J. Phys. Chem. A106 (2002) 11283-11308.
[63] P. Politzer, & J. S. Murray, Cryst. Growth Des. 15 (2015) 3767-3774.
Supplementary materials
Table S1. Selected geometric parameters (Å , °).
Bond lengths (Å) Bond angles (°)
I1—O1 I1—O2 I1—O5 I1—O4 I1—O3 I1—O6 C6—N6 C6—N1 C6—C5 N1—C2 C5—N7 C5—C4 N3—C2 N3—C4 C4—N9 N9—C8 N7—C8 1.8104 (12) 1.8182 (12) 1.8947 (17) 1.9008 (15) 1.9009 (15) 1.9147 (17) 1.318 (2) 1.363 (2) 1.404 (2) 1.353 (3) 1.380 (2) 1.383 (2) 1.302 (3) 1.352 (2) 1.356 (2) 1.354 (3) 1.320 (3) O1—I1—O5 O2—I1—O5 O1—I1—O4 O2—I1—O4 O1—I1—O3 O2—I1—O3 O1—I1—O6 O2—I1—O6 C2—N1—C6 N7—C5—C4 N7—C5—C6 C4—C5—C6 C2—N3—C4 N3—C4—N9 N3—C4—C5 N9—C4—C5 N3—C2—N1 C8—N7—C5 C8—N9—C4 88.83 (7) 92.39 (7) 87.75 (7) 92.49 (7) 92.17 (6) 87.56 (6) 91.49 (8) 87.30 (8) 123.44 (15) 110.40 (15) 131.44 (17) 118.16 (16) 112.74 (16) 127.43 (17) 126.56 (15) 106.01 (16) 125.16 (18) 103.49 (17) 106.43 (16)
Fig. S2. Autostereogram showing the aromatic stacking between adeninium moieties. The b-axis is horizontal.
Table S3. Characteristics of the Hirshfeld surface between the adeninium layer (vertical atom types) and the orthoperiodate/water layer (horizontal atom types). Iodine atom, which has a
small accessible surface (3.6%), is omitted.
% contacts enrichment atom Ho O Ho O 38.5 Hn 8.8 17.5 0.82 1.11 22.2 C 6.3 9.4 1.02 1.03 16.2 N 8.2 1.9 1.82 0.28 23.0 Hc 4.5 12.2 0.71 1.29 surface % 39 57.4
Fig. S4. Hirshfeld surface around the four moieties of the asymmetric unit, coloured according to