IX. AIR NAVIGATION *
Prof. L. J. Chu Prof. S. J. Mason
Prof. R. B. Adler S. J. Fricker
As pointed out in the Quarterly Progress Report, October 15, 1950, additional machine computations have been made for the cases E = 1. 0 and 0. 95 with no stack at the initial instant. The results of these computations have now been analyzed, and some further progress made in attempting to correlate the enroute deviation and stack delay.
The stack delay distributions given by the IBM data made it immediately obvious that, for a given total spread, the effect of the shape of the enroute deviation distribution was not very great. As a consequence, it was decided to condense the results by aver-aging the IBM stack delay probabilities for the three types of enroute deviation distri-bution, and thus present results for an "average" deviation curve having only the spread S as parameter. Additional curves, of the probability of a delay being equal to or
greater than a certain value K, P( T > K), plotted against spread S, were obtained from the averaged stack delay curves. The same information, for a spread S =
24, was also plotted as P(T > K) against K, for purposes of comparison with the Poisson values given in Chart 3, ref. 1 . For E = 0. 5 the IBM averaged curves and the Poisson curves are very similar, while for larger values of E the Poisson curves give progressively larger probabilities.
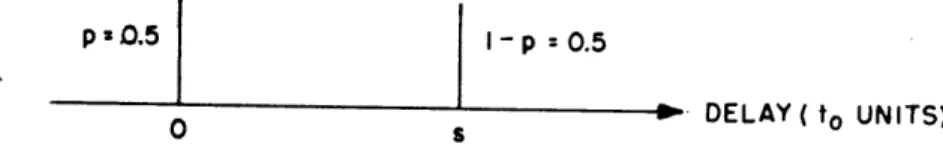
In the most pessimistic case, that of E = 1. 0 and initial saturation, it is possible to obtain a check on the IBM curves through the use of the symmetrical "two-point" deviation distribution. For this distribution, shown in Fig. IX-1, the aircraft may either arrive on time or be S units late. The probability P(T > K) is easily obtained theoretically in this case, and may be expressed in terms of the incomplete beta function.
p = 0.5 I - p = 0.5
0 s W1 DELAY( to UNITS)
Fig. IX-1 "Two-point" enroute deviation distribution.
Published tables of this function thus enable P( T > K) to be found for values of spread S up to approximately 90. The IBM curves of P(T > K) against K, for E = 1. 0 and initial saturation, check fairly well with the "two-point" curves, although these latter are pessimistic, as might be expected. This "two-point" distribution also makes it possible to estimate theoretically the effect of skewing the enroute deviation distribution, by allowing the probability of zero delay enroute to differ from that of delay S.
The work reported in this section is supported in part by the Air Navigation Develop-ment Board of the DepartDevelop-ment of Commerce.
-94-(IX. AIR NAVIGATION)
A more detailed investigation of the relationship between the shapes of the stack delay and enroute deviation distributions would of course be more satisfactory than the averaging method described above. Preliminary results had indicated that plots of the second moment about the mean of the stack delay distribution against the second moment about the mean of the enroute deviation distribution, for a given E, were independent of the precise form of the enroute deviation distribution. As more results were made
available, it became apparent that this was not the case, each distribution, box-car, triangular, and "gauss", giving a somewhat different curve. Fortunately another attack
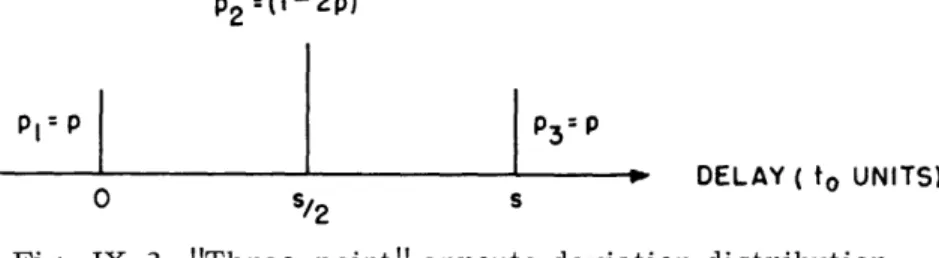
on the problem has been provided by theoretical consideration of the symmetrical "three-point" case, for E = 1.0 and initial saturation. "Three-point" refers to the enroute
deviation distribution shown in Fig. IX-2, with probabilities pi' p2, and p3 of being on
time, S/2 units late or S units late respectively. With this distribution it is possible to write down the probability of a stack delay of K units, P(T = K), and to obtain an
expression for the second moment about the mean of this distribution. For the sym-metrical case, shown in Fig. IX-2, with pl = p3 = p, it is possible to eliminate the
probability p from the expressions for the second moment about the mean of the stack P2 =(I-2p)
- DELAY ( to UNITS)
0 s/2 s
Fig. IX-2 "Three-point" enroute deviation distribution.
delay curve, L 2(T), and the second moment about the mean of the deviation distribution
4 2
(r). This yields a curve independent of p, relating 12(T) and42
(r), which thereforeholds for any symmetrical "three-point" deviation distribution, provided that E = 1.0 and the system is initially saturated. The IBM results for the nearest approximation to these conditions, namely E = 1.0 and initial saturation, but not a "three-point" deviation distribution, check fairly well with this theoretical curve. Main interest, however, would be centered on values of E < 1.0, with no initial stack, and although the theoretical curve mentioned above is not valid for these conditions, it has appeared worthwhile to replot the IBM data, with E < 1. 0 and no itiltial saturation, in the form which eliminates p from the theoretical calculations just described. The analysis of the results has not yet been completed.
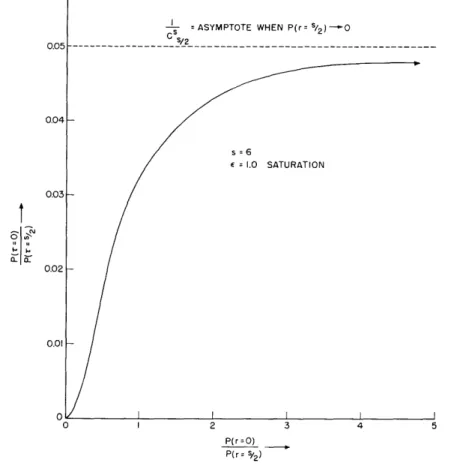
The "three-point" case has also provided some useful information regarding the effect on the stack delay distribution of the "peakedness" of the enroute deviation distri-bution. Figure IX-3 shows a plot of
P(T = 0) against
P(r = 0)
P(T =)
P(r
=)
-95-(IX. AIR NAVIGATION)
for S = 6, E = 1.0, and initial saturation, together with the asymptote of the curve as P(r = S/2) becomes zero. The effect on the stack delay curve is obviously greatest as the enroute deviation curve changes from a sharply peaked distribution to a box-car type distribution. After this, change in the enroute deviation distribution has progressively less effect. For moderately large values of S(>, 6), the stack delay distribution never-theless always remains quite highly peaked, as indicated by the asymptote in Fig. IX-3.
0.05 0.04 0.03 0.02 0.01 = ASYMPTOTE WHEN P(r= s/2) -0 CSs/2 s=6 1.0 O SATURATION I 0 I 2 3 4 5 P(r = O) P(r= s/2)
Fig. IX-3 Effect of "peakedness" of enroute deviation distribution on stack delay distribution.
A technical report is now being prepared which will cover the work done on the no control case. The new problem, with the modified scheduling procedure, mentioned in the Quarterly Progress Report of October 15, 1950, is now being handled by the machines, and results should soon be available.
Reference
1. Ministry of Civil Aviation, Operational Research Section, Notes and Data on Traffic Flow, 1950.