DYNAMICS OF IMPLEMENTATION OF MITIGATING
MEASURES TO REDUCE CO
2EMISSIONS FROM
COMMERCIAL AVIATION
Rahul Kar, Philippe A. Bonnefoy and R. John Hansman
This report is based on the S.M. Thesis of Rahul Kar submitted to the Engineering Systems Division in partial fulfillment of the requirements for the degree of
Master of Science in Technology and Policy at the Massachusetts Institute of Technology.
Report No. ICAT-2010-01 June 2010
MIT International Center for Air Transportation (ICAT) Department of Aeronautics & Astronautics
Massachusetts Institute of Technology Cambridge, MA 02139 USA
A
CKNOWLEDGEMENTS
This work was supported by the MIT/Masdar Institute of Science and Technology under grant number Mubadala Development Co. Agreement 12/1/06.
The authors wish to thank Simon Pickup, Director, Business Operations, Airbus Americas, for providing Airbus aircraft orders and deliveries data that was used to calibrate the Aircraft Diffusion Dynamic Model.
Dynamics of Implementation of Mitigating Measures to
Reduce CO
2Emissions from Commercial Aviation
by
Rahul Kar, Philippe A. Bonnefoy and Prof. R. John Hansman
A
BSTRACT
ncreasing demand for air transportation and growing environmental concerns motivate the need to implement measures to reduce CO2 emissions from aviation. Case studies
of historical changes in the aviation industry have shown that the implementation of changes generally followed S-curves with relatively long time–constants. This research analyzed the diffusion characteristics of a portfolio of CO2 emission mitigating measures
and their relative contribution to cumulative system wide improvements. A literature review identified 41 unique measures, including (1) technological improvements, (2) operational improvements, and (3) the use of alternative fuels. It was found that several operational changes can be implemented in the short term but are unlikely to significantly reduce CO2 emissions. Technology retrofits and some operational changes can be
implemented in the medium term. 2nd and 3rd generation biofuels can significantly reduce carbon emissions but are likely to have long diffusion times and may not be available in sufficient quantities to the aviation industry. Technology measures in the form of next generation aircraft have the highest CO2 reduction potential, but only in the long term due
to slow fleet turnover.
An Aircraft Diffusion Dynamic Model (ADDM) was developed using System Dynamics modeling techniques to understand how the fleet efficiency will be influenced by the entry of various generations of aircraft with different levels of emissions performance. The model was used to evaluate effects of several future potential scenarios on the US narrow body jet fleet as well as their sensitivity to S-curve parameters.
Results from the model showed that strategies that emphasize the early entry into service of available technology, as opposed to waiting and delaying entry for more fuel- efficient technology, have greater potential to improve fleet fuel-burn performance. Also, strategies that incentivize early retirement of older aircraft have marginal potential for reducing fuel burn.
Future demand scenarios showed that the infusion of fuel-efficient aircraft alone is unlikely to reduce emissions below 2006 levels. Instead, a portfolio of measures that also include demand reduction mechanisms, operational improvements, and adoption of alternative fuels will be required in order to limit the growth of CO2 emissions from
aviation.
T
ABLE OF
C
ONTENTS
ACKNOWLEDGEMENTS ...3 ABSTRACT ...5 TABLE OF CONTENTS ...7 LIST OF FIGURES ...10 LIST OF TABLES ...13ACRONYMS &ABBREVIATIONS ...14
1 INTRODUCTION ...16
1.1 MOTIVATION ...16
Challenge of Reducing Emissions while Meeting Growing Demand for Air Transportation ... 16
Emissions Reduction Goals & Challenges ... 18
Levers for Reducing Emissions ... 20
Challenges with the Implementation of Changes in the Air Transportation System ... 21
SUMMARY ...22
RESEARCH APPROACH ...23
2.1 HYPOTHESIS AND RESEARCH QUESTIONS ...23
2.2 RESEARCH APPROACH ...23
BACKGROUND ...25
3.1 AVIATION EMISSIONS AND THE ENVIRONMENT ...25
3.2 LITERATURE REVIEW ON REDUCING EMISSIONS FROM AVIATION ...27
Historical Trends ... 27
Future Trends ... 27
HISTORICAL EXAMPLES OF PAST CHANGES IN THE AVIATION INDUSTRY ...29
Methodology for Selecting Cases ... 29
4.1 PATTERNS OF AIRCRAFT TECHNOLOGY DIFFUSION ...30
Tech Case I: Diffusion of First Generation of Jet Aircraft in the 1960s and 1970s ... 30
Tech Case II: Regional Jets in the 1990s ... 32
Tech Case III: Blended Winglets ... 33
4.2 PATTERNS OF DIFFUSION OF OPERATIONAL PROCEDURES ...34
Ops Case I: E-Tickets ... 34
Ops Case II: Reduced Vertical Separation Minimum (RVSM) ... 35
Alt. Fuels Case I & II: Adoption of Ethanol in the US and Brazil ... 36
SUMMARY AND DISCUSSION OF KEY BARRIERS AND DRIVERS ...37
CONCEPTUAL DYNAMICS OF IMPLEMENTATION OF MITIGATING MEASURES ...41
5.1 LITERATURE REVIEW OF TECHNOLOGY DIFFUSION ...41
5.2 THE BASS DIFFUSION MODEL ...45
5.3 FRAMEWORKS FOR IDENTIFYING,CATEGORIZING AND EVALUATING MEASURES ....47
Framework 1: Systematic grouping of mitigating measures ... 47
Framework 2: The Bass Diffusion Model ... 47
IDENTIFICATION AND CATEGORIZATION OF MITIGATING MEASURES ...49
6.1 METHODOLOGY FOR IDENTIFICATION AND CATEGORIZATION OF MITIGATING MEASURES ...49
6.2 ESTIMATION OF THE DIFFUSION CHARACTERISTICS OF MITIGATING MEASURES...49
Estimation of the start time of diffusion ... 50
Assumptions for the diffusion time ... 50
Estimation of percentage of CO2 emission reduction potential ... 51
6.3 EVALUATION OF THE DIFFUSION CHARACTERISTICS OF MITIGATING MEASURES ....52
6.4 CUMULATIVE ESTIMATION OF THE POTENTIAL FOR CO2 EMISSIONS REDUCTION BY CATEGORY OF MEASURES ...58
MODELING THE DYNAMICS OF NEW AIRCRAFT DIFFUSION ...61
7.1 INTRODUCTION ...61
7.2 DESCRIPTION OF THE AIRCRAFT DIFFUSION DYNAMIC MODEL (ADDM) ...62
Architecture of the Aircraft Diffusion Dynamic Model ... 62
Description of the Components of the Aircraft Diffusion Dynamic Model ... 63
7.3 SCOPE OF THE AIRCRAFT DIFFUSION DYNAMIC MODEL:APPLICATION TO THE SINGLE AISLE AIRCRAFT CATEGORY ...68
7.4 ASSUMPTIONS FOR THE CALIBRATION OF THE AIRCRAFT DIFFUSION DYNAMIC MODEL ...69
7.5 CALIBRATION OF THE AIRCRAFT DIFFUSION DYNAMIC MODEL ...71
7.6 DEFINITION OF ASSUMPTIONS AND SCENARIOS ...75
7.1 SIMULATION RESULTS ...81
7.1 DISCUSSION AND IMPLICATIONS FOR AIRCRAFT MANUFACTURER STRATEGIES AND PUBLIC POLICY ...97
CONCLUSIONS ...102
APPENDIX A:LIST OF MITIGATING MEASURES ...109
APPENDIX B:REFERENCES FOR TABLE 5 ...111
L
IST OF
F
IGURES
Figure 1: Passenger traffic growth (RPK) worldwide from 1971 to 2007 ... 17
Figure 2: Historical evolution of fuel consumption in the United States ... 17
Figure 3: Long term targets for CO2 emissions from Aviation. ... 18
Figure 4: Diffusion of early jets into the airline fleet took 15 years ... 22
Figure 5: Schematic of the Research Approach ... 24
Figure 6: Schematic showing aviation‟s impact on the environment ... 25
Figure 7: Global Transportation‟s and Global Aviation‟s Contributions to Carbon Dioxide Emissions ... 26
Figure 8: Diffusion of Jet Aircraft into the U.S. Fleet ... 30
Figure 9: Historical evolution of regional jets registered in United States from 1993 to 2008 ... 32
Figure 10: Adoption of Blended Winglets ... 33
Figure 11: Historical adoption of e-tickets by IATA airlines ... 34
Figure 12: RVSM Implementation worldwide ... 35
Figure 13: Historical evolution of ethanol use in Brazil and the US ... 36
Figure 14: Technology life cycle as an S-curve ... 42
Figure 15: S-curve market segmentation ... 43
Figure 16: Conceptual representation of the Bass diffusion model ... 46
Figure 17: Distribution of Mitigating Measures based on Start Time and Diffusion Time ... 56
Figure 18: Estimated availability of component technologies for new aircraft designs (e.g. NASA N+1, N+2, N+3 programs) and their relative CO2 emissions reduction potential ... 57
Figure 19: Cumulative Potential Reductions in CO2 Emissions from 2006 to 2050 ... 60
Figure 20: Architecture of the Aircraft Diffusion Dynamic Model (ADDM) ... 62
Figure 21: Conceptual retirement curve ... 63
Figure 22: Aging chain structure ... 64
Figure 23: Fleet aging chain with fuel performance co-flow structure ... 65
Figure 25: Demand module ... 66
Figure 26: World Airline Fleet ... 69
Figure 27: Distribution of 2006 single aisle fleet by age ... 69
Figure 28: Passenger aircraft retirement curves... 71
Figure 29: Boeing and Airbus orders and deliveries ... 72
Figure 30: Boeing 737 family and Airbus 320 family orders and deliveries to U.S airlines ... 73
Figure 31: Model to estimate calibration constants – „order smooth‟ and „delay‟ ... 73
Figure 32: Results of calibrating the Aircraft Diffusion Dynamic Model with historical data using first order fits ... 74
Figure 33: Results of calibrating the Aircraft Diffusion Dynamic Model with historical data using third order fits ... 74
Figure 34: Historical evolution of single aisle aircraft fuel efficiency by entry into service dates and two technology improvement pathways (Inset – see Figure 35) ... 76
Figure 35: Aircraft technology improvement scenarios by generation of aircraft ... 78
Figure 36: Exponential demand growth scenarios in scheduled revenue passenger miles79 Figure 37: Retirement curve scenarios ... 79
Figure 38: Assumed variation of performance with entry into service dates for sensitivity analysis ... 80
Figure 39: Normalized fleet fuel consumption under „Early entry into service of technology‟ and „Delayed entry into service with more fuel-efficient technology‟ scenarios ... 82
Figure 40: Cumulative fleet fuel consumption under „Early entry into service of technology‟ and „Delayed entry into service with more fuel-efficient technology‟ scenarios ... 82
Figure 41: Normalized fleet consumption for 1, 3, 5% annual demand growth scenarios 83 Figure 42: Effect of annual demand growth rate on the diffusion of N50 and N70 aircraft 84 Figure 43: Normalized fuel intensity for 1%, 3% and 5% annual demand growth rate ... 85
Figure 44: Normalized fuel consumption for early, baseline and late retirement scenarios ... 86
Figure 46: Effect of retirement rates on the diffusion and retirement of the In-Production
fleet ... 87
Figure 47: Effect of airline industry cycle on normalized fleet fuel consumption ... 88
Figure 48: Airline industry cycle and fleet evolution ... 89
Figure 49: Airline industry cycle and fleet mix ... 90
Figure 50: Effect of entry dates for N50 and N70 aircraft on 2050 fleet fuel consumption for „Early entry into service of technology‟ scenario ... 93
Figure 51: Normalized fleet fuel consumption for minimum settings and baseline for „Early entry into service of technology‟ scenario ... 93
Figure 52: Effect of entry dates for N30 and N70 aircraft on 2050 fleet fuel consumption for „Delayed entry into service with more fuel-efficient technology‟ scenario ... 94
Figure 53: Normalized fleet fuel consumption for minimum settings and baseline for „Delayed entry into service with more fuel-efficient technology‟ scenario .. 95
Figure 54: Effect of entry dates for N50 and N70 aircraft on cumulative fleet fuel consumption until 2050 for „Early entry into service of technology‟ scenario ... 96
Figure 55: Effect of entry dates for N30 and N70 aircraft on cumulative fleet fuel consumption until 2050 for „Delayed entry into service with more fuel-efficient technology‟ scenario ... 96
L
IST OF
T
ABLES
Table 1: Summary of goals and forecasts from literature review ... 28
Table 2: List of case studies of past changes in the aviation industry ... 29
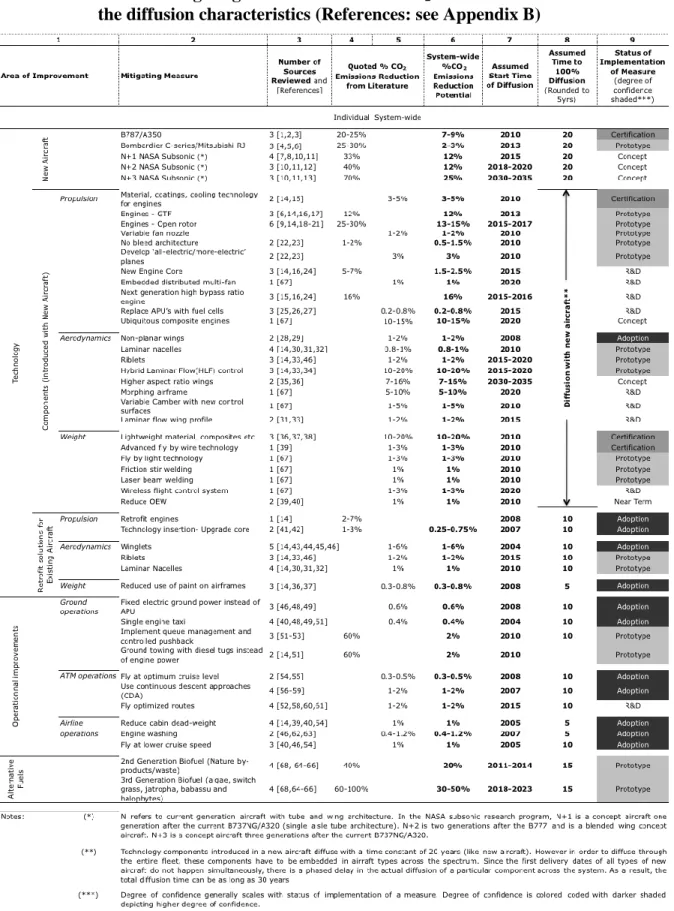
Table 3: Brief Description of Technology Measures ... 53
Table 4: Brief Description of Mitigating Measures; Technology (Retrofit), Operational Improvements and Alternative Fuels (cont.) ... 54
Table 5: Portfolio of mitigating measures to reduce CO2 emissions and estimates of the diffusion characteristics (References: see Appendix B) ... 54
Table 6: Average fuel efficiency... 70
Table 7: ICAO regression constants for retirement curve (ICAO 2007) ... 71
Table 8: Summary of technology mitigating measures ... 75
Table 9: Scenario Assumptions ... 77
A
CRONYMS
&
A
BBREVIATIONS
Acronyms Description ACI : Airport Council International
ADDM : Aircraft Diffusion Dynamic Model ASK : Available Seat Kilometer
ASM : Available Seat Mile ATA : Air Transport Association ATC : Air Traffic Control ATM : Air Traffic Management
BTS : Bureau of Transportation Statistics (United States) BCA : Boeing Commercial Aircraft
CDA : Continuous Descent Approach
DOT : Department of Transportation (United States) ESD : Engineering Systems Division (MIT) EIS : Entry Into Service
EU ETS : European Union Emissions Trading Scheme
ETOPS : Extended-range Twin-engine Operational Performance Standards FAA : Federal Aviation Administration
FT : Fischer Tropsch process
GAO : Government Accountability Office (United States) GDP : Gross Domestic Product
GHG : Green House Gas (es)
GIACC : Group on International Aviation and Climate Change GTF : Geared Turbo Fan
HLFC : Hybrid Laminar Flow Control HBPR : High By Pass Ratio Engines HRJ : Hydrogenated Renewable Jet
IATA : International Air Transport Association ICAO : International Civil Aviation Organization JPDO : Joint Planning and Development Office NAS : National Airspace System
NASA : National Aeronautics and Space Administration NB : Narrow Body (Jet)
NextGen : Next Generation Air Transportation System (U.S. Initiative) OEP : Operational Evolution Plan
PW : Pratt and Whitney RJ : Regional Jet
RPK : Revenue Passenger Kilometer
RVSM : Reduced Vertical Separation Minimum SD : System Dynamics
[Page Intentionally Left Blank]
1
I
NTRODUCTION
1.1
Motivation
Challenge of Reducing Emissions while Meeting Growing Demand for Air Transportation
Air transportation has been, and remains, a key enabler to economic growth and development by providing fast and reliable access to people and markets. Worldwide increase in economic activity during the last few decades has resulted in significant rise of demand for commercial aviation. As shown in Figure 1, the two largest markets in terms of passenger traffic, North America and Europe have grown at an average annual rate of 5.7% and 5.0% respectively over the last 20 years. Asia-Pacific has also exhibited significant growth at 8.8% average annual growth rate. This market is now reaching passenger traffic levels comparable to the European market. More recently, impressive growth of traffic has been observed in the Middle East that exhibited an average annual growth rate of 13% per year, between 2000 to 2007.
Disregarding the recent economic downturn in 2008 and 2009, the global aviation industry has grown between 4.5% and 5% annually since 19901. Numerous forecasts estimate that similar rates of growth are likely to prevail in the next decades (BCA 2008).
1Data source: International Civil Aviation Organization (ICAO), Civil Aviation Statistics of the World,
ICAO Statistical Yearbook, ICAO, Table 1-16 (1986 to1987), Table 1-13 (1998 to 1999), Annual Review of Civil Aviation 2001, 2002, 2003, ICAO Journal, vol. 57 No.6 2002, vol. 58, No. 6 2003, vol. 59, No. 6 2004, vol. 60, No. 6 2005, vol. 61 No. 6 2006 and International Air Transport Association (IATA) data for years 2005 to 2007.
Figure 1: Passenger traffic growth (RPK) worldwide from 1971 to 2007
Data sources: ICAO (1970-2000), IATA (2001, 2007)
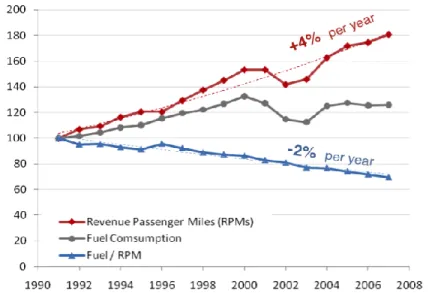
While demand was growing at a rate of approximately 4-5% every year, fuel efficiency improvements ranged from 1.2 to 2.2% annually (BTS 2008). This rate of improvement was not sufficient to compensate for demand growth and resulted in a net increase in fuel burn (Figure 2).
Figure 2: Historical evolution of fuel consumption in the United States
(Data sources: DOT BTS T2 U.S. Air Carrier Traffic and Capacity Statistics by Aircraft Type)
It is therefore expected that with growing demand and marginal improvements in fuel efficiency, aviation‟s contribution to anthropogenic greenhouse gas emissions will
increase in the future. The International Civil Aviation Organization (ICAO) recently forecast that global CO2 emissions from aviation would increase an additional 150%
above 2006 levels by 2036 (ICAO 2009). At this rate, emissions would quadruple by 2050.
Future increases in net emissions are likely to reinforce public and political pressure on the aviation sector to reduce its greenhouse gas emissions (IATA 2009a)(DECC 2009).
Emissions Reduction Goals & Challenges
In order to reduce the adverse effects on climate change from aviation induced emissions, governments and international agencies have set goals for future emissions reduction. Figure 3 shows long-term emission trends, forecasts and targets for the aviation industry. It should be noted that these targets are aspirational and non-binding.
Figure 3: Long term targets for CO2 emissions from Aviation.
Data sources: (IATA 2009b), (Flint 2009), (UKCCC 2009), (McCollum D. 2009) (FAA 2009)(ATA 2010)
Targets for the Industry:
Targets for 2020:
1. The International Airline Industry Association (IATA) aims at achieving carbon neutral growth of aviation in the medium term. It has set the following broad aspirational goals (endorsed by the ATA) for the aviation sector (IATA 2009b):
A cap on aviation CO2 emissions from 2020 (carbon-neutral growth)
An average improvement in fuel efficiency of 1.5% per year from 2009 to 2020
2. The International Civil Aviation Organization (ICAO) has adopted a target of a "global annual average fuel efficiency improvement of 2%" for the airline industry through 2020.
Targets for 2050:
1. IATA has a set a target reduction in CO2 emissions of 50% by 2050, relative to
2005 levels.
2. The ICAO has set "an aspirational global fuel efficiency improvement rate of 2% per annum in the long term from 2021 to 2050, calculated on the basis of volume of fuel used per RTK performed (Flint 2009).
3. A report by the UK Committee on Climate Change (UKCCC 2009) estimates fuel efficiency improvements of 0.8% under current technology trends and a subsequent reduction of carbon intensity of 30% by 2050.
Targets for Aviation Alternative Fuels:
Targets for 2020:
1. The IATA has set separate goals for alternative fuels – 10% usage by 2017 and assumes a 6% mix of second-generation biofuels (80% lower life cycle carbon intensity) by 2020.
Targets for 2050:
1. The UKCCC research claims that biofuels will only account for at most 10% of global aviation fuel consumption by 2050 because of land availability and sustainability issues.
Industry Forecasts:
Figure 3 shows these goals along with the emissions forecasts based on current trends and potential improvements. The contrast between the goals and the forecast (e.g. Pew Center for Global Climate Change estimates emissions increase by 300% by 2050) compared to ICAO goals of 60% reduction) highlights the challenges of meeting these goals.
The „wedge‟ between projected and aspirational emissions will most likely require the use of aggressive solutions to reduce aviation‟s emissions.
Levers for Reducing Emissions
From first principles, carbon dioxide (CO2) emissions are proportional to aircraft fuel
burn. For every kilogram of jet fuel burnt, 3.15 kg of CO2 are emitted. As shown in the
modified and expanded Breguet range equation (adapted from (Lee, et al. 2001), the fuel consumption of an aircraft is a function of its weight, engine efficiency (i.e. specific fuel consumption) and aerodynamic efficiency (i.e. lift-to-drag ratio) for a specified range and speed.
Equation 1 illustrates that there are several levers to reduce CO2 emissions assuming
constant demand1 by:
reducing CO2 content of fuel by adopting alternative fuels with lower
life-cycle carbon content per unit of fuel,
reducing Aircraft weight, through a reduction in empty weight and payload, improving Engine efficiency by reducing the specific fuel consumption, improving Aerodynamics by increasing the lift to drag ratio,
increasing Average Load Factor,
changing Fleet mix by using larger more fuel efficient aircraft changing Flight distance by modifying network topology,
changing Cruise speed by flying at speeds that minimize fuel burn (e.g. „Maximum Range Cruise‟ speed).
These levers can be grouped into 3 general areas of improvements, which will be used as reference for the remainder of this study:
(1) Technology (i.e. Aircraft weight, Engine efficiency, Aerodynamics)
(2) Operations (i.e. Aircraft weight, load factor, fleet mix, flight distance, speed) (3) The use of Alternative fuels (i.e. CO2 content of fuel)
Challenges with the Implementation of Changes in the Air Transportation System
The previous sections motivated the need for the aviation industry to make significant improvements in fleet wide fuel burn efficiency and reductions in net emissions. While mitigation measures may be available for reducing emissions, it is expected that actual benefits from these measures will not be instantaneous due to the long diffusion time into the system.
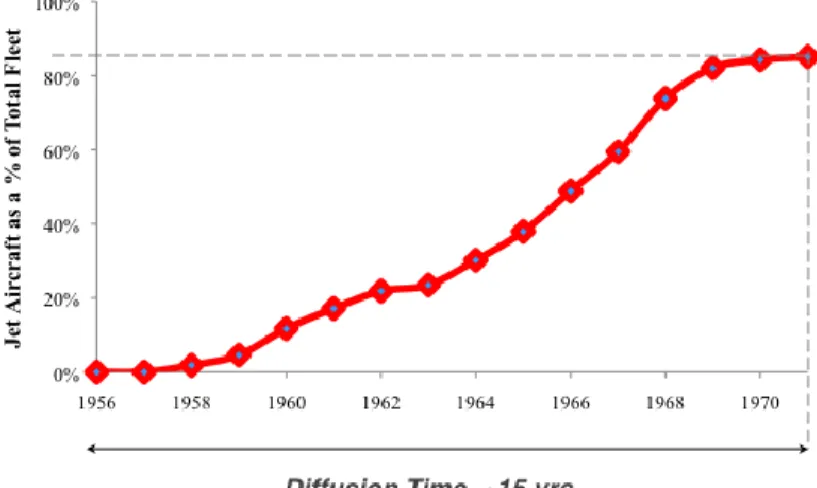
Figure 4 illustrates the diffusion of the first generation jet aircraft into the aviation industry in the 1960s and early 1970s. Even though the technology was disruptive in terms of its performance and capabilities compared to previous generations of products
1
This research excludes the discussion of mitigation of emissions through demand since to first order emissions scale with demand. In addition, some airline business practices were not included because they do not follow S-curve dynamics. This includes for example increasing aircraft load factor which also has limited potential for mitigation -at least in the United States. Load factors have been approaching high levels (i.e. 80%) in recent years.
(i.e. piston powered aircraft), it took 15 years for jet aircraft to account for 80% of the total aircraft fleet in the United States.
Figure 4: Diffusion of early jets into the airline fleet took 15 years
(Data source: ATA Annual Reports 1958-1980)
It is expected that mitigating measures to reduce emissions from aviation (e.g. technologies, operational improvements and alternative fuels) are also expected to follow S-curve type diffusion dynamics and that changes are not going to be instantaneous. Chapter 3 provides additional and more detailed cases supporting these expectations.
Summary
This chapter showed that rising demand for air transportation in the future and the slower rates of improvement in fuel efficiency would result in net increase in emissions and eventually pressure on the industry to reduce its carbon footprint. It is necessary to implement mitigating measures to meet the emissions reduction goals. The modified Breguet range equation has established three key areas of improvement - technology, operations and alternative fuels that can reduce carbon emissions. The adoption of mitigating measures within these three categories will most likely follow S-curve type adoption dynamics with benefits that will accrue over a long time period.
C
HAPTER
2
R
ESEARCH
A
PPROACH
2.1
Hypothesis and Research Questions
Changes and the diffusion of technology, procedures, and practices in the airline industry have generally followed S-curve type dynamics. This type of dynamic is characterized by, first, a slow growth rate, followed by a period of rapid diffusion and, finally, declining growth once a system saturation point is reached. It is expected that future mitigating measures that have the potential to reduce emissions from aviation are likely to exhibit similar dynamics and that the full benefits will only be realized over a long time horizon. Among the broad set of options to reduce CO2 emission, some may
provide significant benefits but require a very long time to diffuse. Others may provide short-term solutions but with very negligible impacts on the system.
This thesis aims at answering the following questions:
(1) What are the mitigating measures available to the aviation industry to reduce CO2 emissions?
(2) What are the measures that will have the highest impact toward reducing the carbon footprint of aviation in the short, medium and long term?
(3) What are the adoption dynamics of these mitigating measures?
(4) What are the tradeoffs between a) time of entry of mitigating measures, b) time of diffusion and c) potential for CO2 emission reduction?
2.2
Research Approach
This research follows a five-step process to identify and categorize mitigating measures and to investigate the dynamics that govern their implementation and diffusion (see Figure 5).
The research first reviews examples of past changes in the aviation industry to understand historical patterns of diffusion. Cases of technology adoption (e.g. introduction of early jet engines), operational changes (e.g. implementation of reduced
vertical separation minimum) and uptake of alternative fuels in the automobile industry (as a proxy for dynamics that may be encountered in the airline industry) are analyzed.
Second, a framework to characterize the mitigating measures is developed. This framework includes a) the modified Breguet range equation to identify the measures and b) the Bass Diffusion model to capture the key parameters that characterize the impacts of individual mitigating measures on emissions reduction; namely the development time (or start date of diffusion), the diffusion time constant and the CO2 reduction potential after
full adoption.
Third, a literature review is conducted using the framework to develop a broad portfolio in the three key areas of mitigating measures that the aviation industry can consider to reduce its carbon footprint.
Fourth, a bottom-up model is constructed based on the portfolio of measures to estimate the CO2 reduction from each of the three key areas of improvement –
technology, operations and alternative fuels.
Finally, a system dynamic model of aircraft fleet turnover is developed to study the diffusion of next generation of fuel-efficient aircraft into the industry. The model is used to conduct scenario analyses and trade-off studies that investigate the effects of future S-curve dynamics in terms of: (1) time of entry into service, (2) potential fuel efficiency improvements and (3) diffusion time on the fleet wide fuel burn performance.
C
HAPTER
3
B
ACKGROUND
3.1
Aviation Emissions and the Environment
Aircraft emit a wide variety of chemical species including greenhouse gases (Figure 6). Majority of these emissions occur in the upper troposphere and the lower stratosphere. (5 miles and upward). The effect of the specimens on radiative forcing (i.e. difference in incoming and outgoing energy in a given climate system) are expected to negatively affect the climate and the effect is approximately double (J. Lee 2005) that due to burning the same fuels at ground level.
Figure 6: Schematic showing aviation’s impact on the environment (Source: Lee et al, 2009)
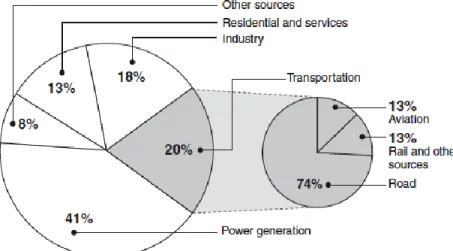
According to the Intergovernmental Panel on Climate Change (IPCC) Working Group Three (WGIII), aviation‟s contribution to total anthropogenic radiative forcing (RF) was 3% in 2005. Figure 7 puts this in perspective with emissions from other anthropogenic activities – power generation industry, road transportation, residential and commercial buildings that use fuel and power etc. The Environmental Protection Agency
(EPA 2009a) reported that all U.S. aviation (international and domestic commercial fuel, general and military aviation) was responsible for 3.4%1 of total U.S. CO2 emissions.
1
Figure 7: Global Transportation’s and Global Aviation’s Contributions to Carbon Dioxide Emissions
Source: (GAO 2009)
In December 2009, the EPA declared that increase in greenhouse gases (GHGs2) in the atmosphere was the primary driver of climate change (EPA 2009b). i.e. “threaten the public health and welfare of current and future generations”. The evidence of anthropogenic climate change is not limited to increase in average surface temperatures but “includes melting ice in the Arctic, melting glaciers around the world, increasing
ocean temperatures, rising sea levels, acidification of the oceans due to excess carbon dioxide, changing precipitation patterns, and changing patterns of ecosystems and wildlife”(EPA 2009b).
Aviation‟s contribution to the net climate change problem is not fully understood. For example, there are large uncertainties involved regarding the effects of contrails and aviation induced cloud formation (AIC) that can multiply the contribution of aviation to climate change (David S. Lee 2009). Sulfate aerosols on the other hand may have a cooling effect by reacting with methane and reducing the global warming potential of
1 As per the UNFCCC‟s reporting guidelines, international bunker fuels are reported seperately and not
included in the domestic greenhouse gas inventory
2
The EPA identifies carbon dioxide (CO2), methane (CH4), nitrous oxide (N2O), hydrofluorocarbons (HFCs), perfluorocarbons (PFCs), and sulfur hexafluoride (SF6) as GHGs. Source: EPA, Endangerment
and Cause or Contribute Findings for Greenhouse Gases under Section 202(a) of the Clean Air Act,
CH4. Never the less, the aviation industry is under political and public pressure to reduce
its emissions footprint.
3.2
Literature Review on Reducing Emissions from Aviation
Historical Trends
The aviation sector has consistently adopted fuel efficiency measures that have lowered system wide emissions by 70% since 1960 (Penner, et al. 1999). The trends reported in literature have come from engine and/or airframe improvements and the period has witnessed the introduction of several disruptive technologies – introduction of jet engines to replace piston engines, introduction of high by pass ratio turbofan jet engines, the introduction of large aircraft such as the Boeing 747 and the introduction of twin engine long range aircraft after ETOPS1. Lee (Lee, et al. 2001) and Peeters (Peeters P.M. 2005) have reported efficiency improvements of 64% and 55% over the same time period (1965-2000).
Future Trends
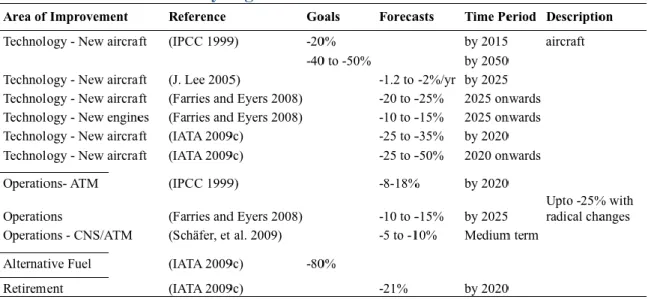
Table 1 summarizes the goals and forecasts for potential emissions reduction in the future. Literature sources consistently report maximum benefits (-20% to -50%) from technological improvements – new airframe and engines, in the long term. Operational improvements till 2020 are reported between -5 to -15% in the medium term.
Table 1: Summary of goals and forecasts from literature review
While IATA claims a 80% reduction from the adoption of alternative fuels, a report by The Pew Center (McCollum D. 2009) is circumspect about the impacts of alternative fuels in the short or medium term and finds that the only feasible options for “drop-in” replacements to petroleum-based jet fuels are hydroprocessed renewable jet fuel (HRJ) and Fischer-Tropsch (FT) fuels. While most literature sources comment on the possibility of increased aviation activity because of increased capacity from ATM improvements, no scientific study has been conducted to quantify such second-order feedbacks.
C
HAPTER
4
H
ISTORICAL EXAMPLES OF PAST CHANGES IN THE
AVIATION INDUSTRY
Historically, most transitions in the commercial aviation industry have exhibited S-curve dynamics with long time constants of diffusion. The implementation of mitigating measures to reduce the carbon footprint of aviation is also expected to show similar diffusion trends.
This chapter studies past diffusion trends of technological and operational changes within the aviation industry. In addition, it presents the case of diffusion of ethanol in the United States and Brazil. Large-scale transition to alternative fuels has been absent in the aviation industry and the study of adoption of an alternative fuel by the automobile industry can provide valuable insights into some of the dynamics that the aviation industry could experience.
Table 2 shows the list of cases that were studied to understand the patterns of diffusion in the industry.
Table 2: List of case studies of past changes in the aviation industry
Methodology for Selecting Cases
Cases were chosen within each of the three categories of improvements i.e. technology (new aircraft types and retrofit solutions), operations and alternative fuels.
Within the set of technology cases, the adoption of jet aircraft in the 1960s was chosen to represent a paradigm shift in aircraft technology in the industry. The case of regional jets was used to investigate the dynamics of diffusion of a more recent (1990s)
aircraft type. The adoption of blended winglets illustrates the case of a component technology that can diffuse with new aircraft and as a retrofit option.
Within the set of operational examples, the implementation of RVSM is illustrative of a system wide change. The implementation of e-tickets represents as a solution that improves the operational efficiency by reducing cost.
The case of adoption of ethanol in Brazil and in the US presents a comparison of two markets where diffusion of an alternative fuel followed different rates of uptake because of government policies.
For each case study, time series data of a representative metric was collected. For example, for early jet aircraft, the fraction of aircraft that were powered by jet engines as compared to the overall fleet was estimated from fleet data available from airline industry reports. Key enablers and barriers that influenced the rate of adoption of each measure were also evaluated for this study.
4.1
Patterns of Aircraft Technology Diffusion
Tech Case I: Diffusion of First Generation of Jet Aircraft in the 1960s and 1970s
The adoption of the first generation of jet aircraft demonstrated S-curve growth and despite their advantages took a long time to diffuse into the fleet. Figure 8 shows that it took 15 years to achieve approximately 80% fleet penetration by jet powered aircraft.
Figure 8: Diffusion of Jet Aircraft into the U.S. Fleet
The entry and adoption of jet aircraft in the late 1950s and early 1960s revolutionized air travel worldwide by making travel faster and safer (Smithsonian National Air and Space Museum 2010). Early stage development of jet engines was started to replace piston engine turboprops that were noisy and limited in speed (tip speed of the propellers reaching mach velocity)1. The capability of higher climb rates, and faster and high altitude cruising were attractive to the military, and jet engines were developed primarily to meet the requirements of the U.S. Air Force. The Pratt & Whitney JT3C turbojet engine that powered the first U.S. commercial airplane – the Boeing 707, was actually developed as the J57 to power the experimental B52 bomber for the U.S. Air Force2. The spillover benefits of jet engine development for military applications resulted in the technology becoming quickly available for commercial applications.
The early adoption of jet aircraft by airlines was slow because of large capital investments required to purchase new aircraft in a period of economic downturn (ATA 1960). Jet aircraft also consumed more fuel and had higher operating costs. Pan Am was the first adopter of jet aircraft in the U.S. and launched the Boeing 707-120 on a New York-London route in 1958. Pan Am exploited the first mover advantage to full potential by dominating the trans-Atlantic routes using the Boeing 707 fleet, subsequently influencing Boeing to build the longer range 707-320 in 1958 for non-stop flights3. Passenger preferences for faster travel combined with the possibility of long-haul flight made 11 airlines adopt the 707-320 within a year. Several key drivers influenced the adoption dynamic from this point onwards. In 1958, the U.S. Congress passed the Federal Aviation Act, which among other things reduced taxes on air transportation and aided in making jet travel popular amongst travelers. American Airlines introduced the 707 to operate between New York and Los Angeles in 1959 and started competition amongst domestic airlines in the transcontinental market. TWA and United Airlines quickly joined in the race by purchasing/leasing jet aircraft. Decline in airline ticket prices also contributed to increasing passenger preference for air travel (ATA 1965,1966). The
1http://www.centennialofflight.gov (accessed - Feb 18, 2010)
2 http://www.globalsecurity.org/military/systems/aircraft/systems/j57.htm (accessed - Feb 18, 2010) 3http://www.centennialofflight.gov (accessed - Feb 18, 2010)
growth in the cargo market and the expansion of the jet cargo fleet in the late 1960s (ATA 1967) added to the rapid growth of jet aircraft in the U.S Fleet.
Tech Case II: Regional Jets in the 1990s
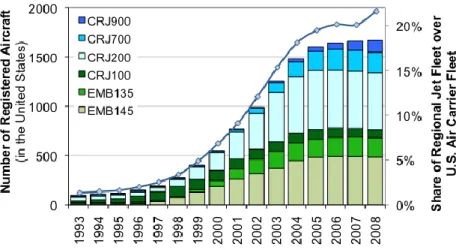
The dynamic of diffusion of regional jets (i.e. 50 to 90 seat jet powered aircraft) starting at the beginning of the 1990s also exhibited a S-curve dynamic. Figure 9 shows the historical evolution of the number of regional jets registered in the United States from 1993 to 2008.
Figure 9: Historical evolution of regional jets registered in United States from 1993 to 2008
(Data source: FAA Aircraft Registry Database)
During the 1990s, a very slow rate of growth of regional jets was observed starting with the introduction of the Bombardier CRJ100. Due to pilot scope clauses (A. H. Mozdzanowska 2003) and the improved performance of regional jets (i.e. range, speed, cabin noise) compared to turboprop aircraft, regional jets became increasingly attractive to airlines. This resulted in a rapid growth from 1998 to 2005. From 2006 onwards, the rate of diffusion into the system decreased since the airline organizational structure was changing (i.e. removal of pilot scope clauses) and the increasing cost of fuel was starting to have a significant impact on operating regional jets as compared to more fuel-efficient turboprops.
Tech Case III: Blended Winglets
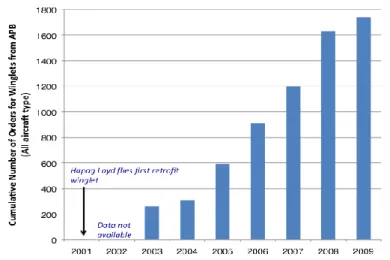
Blended winglets are wingtip devices that are an efficient way of introducing effective wingspan (increase aspect ratio) that reduces drag by limiting wingtip vortices. Figure 10 illustrates the cumulative number of orders (all aircraft types) placed with Aviation Partners (the sole supplier of winglets) and reflects the adoption of the technology by the industry.
Figure 10: Adoption of Blended Winglets
(Data source: Aviation Partners)
In 1999, Aviation Partners Boeing (APB) formed a joint venture to offer blended winglets to Boeing aircraft after receiving FAA approval in 1993. The first supplemental type certificate (necessary certification to retrofit blended winglets on existing aircraft) was awarded in 2001 for the 737-800 and South African and Hapag-Lloyd were the early adopters. Boeing also started offering factory-installed winglets. Adoption of the blended winglet was initially slow because supplemental type certification was required for each model of aircraft. Rapid diffusion started once significant fuel savings from using blended winglets were reported and airlines accepted winglets as a retrofit option to save on fuel costs. Diffusion of winglets followed two pathways – entry with new aircraft as OEM and entry as a retrofit option.
4.2
Patterns of Diffusion of Operational Procedures
Ops Case I: E-Tickets
An electronic ticket is used to represent the purchase of a seat on a passenger airline, usually through a website, by telephone, airline ticket offices or travel agencies. This form of airline ticket has rapidly replaced the old multi-layered paper tickets. The growth pattern in the use of electronic tickets has also exhibited S-curve dynamics as shown in Figure 11.
Figure 11: Historical adoption of e-tickets by IATA airlines
(Data sources: IATA and (Peter P. Belobaba 2009))
The transition from paper tickets to e-tickets was driven by two major dynamics – the reduced cost to airlines (e-tickets cost 10% the cost of a paper ticket) and the rapid growth of the Internet distribution channels (Peter P. Belobaba 2009). In the United States, Southwest and ValuJet were the first airlines to offer an e-ticket option in 1994. The initial adopters were shorter-haul and leisure travelers that had simple itineraries and were less likely to connect to other airlines and make changes to their tickets. Business travelers who had more flexible schedules were reluctant to adopt since an e-ticket issued by one airline was not accepted by another (i.e. lack of common IT communication infrastructure). In the late 1990s and early 2000s, once the IT barriers were removed, the increasing popularity of Internet based booking services resulted in rapid diffusion of e-tickets. Increased use of e-tickets allowed the passengers to gather more information online about ticket prices and gave them greater flexibility in travel planning. Passenger
acceptance reinforced quick adoption. A spillover benefit for the airlines was better revenue management – filling empty seats or „distressed inventory‟ tickets. Finally an IATA mandate, set for a complete phase out of paper tickets by 2008, led towards a full adoption of e-tickets.
Ops Case II: Reduced Vertical Separation Minimum (RVSM)
Aircraft are expected to maintain a minimum vertical separation to ensure safety. Historically, standard vertical separation was 1000 feet from the surface to FL290, 2000 feet from FL290 to FL410 and 4000 feet above this. This was because the accuracy of the pressure altimeter decreased with height. With improvement in altitude measurement instruments, it was found that the 2000 feet separation was overly cautious. The objective behind implementing Reduced Vertical Separation Minimum (RVSM) was to reduce vertical separation between flight levels 290 and 410 from 2000 ft to 1000 ft. This allowed the aircraft to fly optimum cruise levels, reducing fuel burn and increasing capacity. Figure 12 shows the historical evolution of cumulative area of coverage with Reduced Vertical Separation Minimum (RVSM) across the world.
Figure 12: RVSM Implementation worldwide
(Data: FAA 2007, ICAO 2008)
It took 11 years to achieve 67% RVSM worldwide coverage. The implementation and diffusion of RVSM was initially slow because of the high cost for upgrading aircraft
? ?
that were difficult to justify for 2-3% fuel savings (Mclaren 2005). The adoption was also slowed down due to barriers such as the development and deployment of new avionics to monitor aircraft separation and the design of accurate altitude indicators. In addition, there were safety concerns with aircraft wake vortices and interactions with other system components such as Traffic Collision Avoidance System (TCAS) which resulted in an increased frequency of alerts. This procedural change required the training of air traffic controllers and setting standards when transitioning airspaces to RVSM.
A key enabler to the implementation of RVSM over the North Atlantic Tracks (NAT) was the large trans-oceanic fleet that could be upgraded at a fast rate for which benefits could accrue rapidly.
4.3
Patterns of Diffusion of Alternative Fuels
Alt. Fuels Case I & II: Adoption of Ethanol in the US and Brazil
Alternative fuels hold the potential to reduce the carbon footprint of aviation, mostly because of their reduced life-cycle (i.e. well-to-wake) carbon content. The adoption dynamics of ethanol in the automotive industry in the United States and Brazil were investigated to gain insights into the drivers and constraints of transitioning away from petroleum-based jet fuels used in the airline industry. Figure 13 shows the trend of ethanol production in the United States and Brazil from 1975 to 2004. It took approximately 11 and 26 years for Brazil and the United States respectively to reach similar levels of ethanol production.
Figure 13: Historical evolution of ethanol use in Brazil and the US
These cases illustrate the effect of countries infrastructure and capabilities, regulations and incentives on the time of diffusion:
In Brazil, the ethanol industry is more than 30 years old and had been stimulated with the launch of the 1975 National Alcohol Program that guaranteed low-interest loans to construct distilleries, guaranteed purchase of ethanol by the state owned oil companies and incentivizing flex-fuel vehicles. In 1977, the government also mandated a 20% mix of ethanol with gasoline. This led to the rapid development and diffusion of the ethanol industry.
In the United States, ethanol is distilled from corn which is less efficient than producing it from sugarcane (compared to Brazil). Ethanol production competes with food and fodder use of corn, and has been the source of controversy. In the United States, the buildup of production capabilities was significantly slower despite a federal subsidy of 40 to 60 cents per gallon since 1978. Distribution of biofuels to end-use markets have been hampered by several factors – limited rail and truck capacity, location of all distilleries near the Midwest (to reduce raw material transportation costs) which is far from major biofuel consumption centers (East and West coasts), limited number of fueling stations and the general murky regulatory environment that surrounds use and distribution at retail centers1. The uptake of ethanol as a flex fuel in the US has therefore not been at par with that in Brazil.
Summary and Discussion of Key Barriers and Drivers
The examples discussed in this chapter have illustrated the patterns of change in the aviation industry and the long time constants of diffusion associated with every change. They also indicate that S-curves are one way of modeling the diffusion modes for the industry. Every case has unique dynamics – driven by sets of barriers, enablers and adopters. Several key barriers and dynamics were observed that have the potential to delay the implementation of CO2 emission reduction measures through the following
mechanisms.
a) Barriers
Cost of adoption
High capital costs or the need for expensive upgrades/retrofits can delay the rate of adoption of measures significantly – particularly in cases where the benefits are uncertain. In the case of RVSM for example, high costs for instrumentation upgrades and design costs were a barrier to implementation. Similarly, adoption of early generation jet aircraft by airlines was delayed because of extremely high capital costs. High costs of equipment also lead to slow fleet turnover – airlines utilize aircraft for a long period of time. Entry of new and efficient aircraft is blocked.
Coordination and standards setting
Approval processes that require coordination amongst stakeholders and require setting standards can delay implementation of changes. The approval of RVSM across airspaces required coordination amongst stakeholders involved in the process, civil aviation authorities, air navigation service providers, air traffic controllers, pilots and air navigation engineers/technicians. Safety concerns increased the implementation time. The diffusion of e-tickets was initially slow because of the lack of coordination amongst different airlines – a ticket issued by one airline was not accepted by another that led to poor passenger service quality. Certification
There are stringent certification requirements by the civil aviation authorities (FAA) before any system change is implemented to ensure public safety. To meet the safety standards, stakeholders have to undergo certification tests – like the type certification for new aircraft. Winglets, for example, have to be certified for each aircraft model and this adds on to the time to full adoption in the fleet.
Requirement for equipage
The need to equip aircraft, air traffic control stations or ground infrastructure with instruments to achieve operational capabilities can delay the implementation process. This was illustrated in the case of RVSM where upgrades to the TCAS system and deployment of accurate altitude indicators preceded the approval of the operational change.
Production capability build-up
Technology and alternative fuel solutions generally require the development of production capabilities, which is not instantaneous due to the need for infrastructure build-up. Comparison of the adoption of ethanol in the US and Brazil show that the lack of infrastructure for distribution of the biofuel to end-use markets hampered the uptake by the consumers in the US.
Maintenance cycles (window of opportunity for retrofits)
Most of the aircraft retrofit measures are performed during aircraft maintenance visit (i.e. D-checks), which happens approximately every 5 years. As a result, it may take several years before an aircraft becomes available for a retrofit. Winglets diffuse into the aircraft fleet through new aircraft as well as through retrofits. It will take at least 5 years before there is a window of opportunity to retrofit all aircraft in an airline fleet to achieve fuel efficiency improvements.
b) Drivers
Technology spillover
The commercial aircraft industry has derived spillover benefits from other sectors. The evolution of the jet aircraft has been brought about by the research and development conducted by the military. The adoption of E-tickets was accelerated because of the existence of a well-established information technology infrastructure that Internet distribution channels could take advantage of.
Passenger preference
Passenger preference plays a significant role in the rate of adoption of changes in the air transportation system. One of the primary factors behind the transition to a „jet age‟ is the preference for passengers for faster modes of travel (ATA 1965,1966). Increased use of e-tickets allowed passengers greater flexibility to plan their travel and reinforced quick adoption.
Policies and mandates
Transitions in the air transportation system can be significantly accelerated through policies and mandates. The IATA mandate in 2004 that demanded a complete phase out of paper tickets by 2008 was instrumental in the moving towards a fully e-ticket based reservation system. The National Alchohol Policy enacted in Brazil and a
guaranteed market stimulated ethanol as an alternative automobile fuel. Pilot scope clauses led to the development of regional jets.
c) Distribution of costs and benefits across stakeholders
Marais and Weigel (Marais and Weigel 2006) showed that while the overall cost benefit analysis for a transition may be favorable, individual stakeholders may not derive equal value from the transition. Stakeholders that are asked to bear a larger share of the costs while reaping little benefit can be reluctant to cooperate with the transition effort. Push back from stakeholders tends to be acute when changes exhibit asymmetrical costs and benefits (A. Mozdzanowska 2008).
C
HAPTER
5
C
ONCEPTUAL
D
YNAMICS OF
I
MPLEMENTATION OF
M
ITIGATING
M
EASURES
5.1
Literature Review of Technology Diffusion
The implementation of a new technology or a procedure generally follows an S-curve over time (Geroski 2000). In the consumer electronics industry for example, there is a development phase during which a measure is being developed, evaluated and certified. The diffusion phase begins with a phase of slow adoption driven by early adopters (first movers or innovators). Then, reinforcing dynamics accelerate the adoption process to a phase of maximum diffusion when most of the barriers are overcome and the measure is generally accepted. This phase is followed by slower adoption by laggards and exhibits diminishing returns.
There are two types of technology evolution. First and the most common transition is one of sustained development with incremental improvements in performance (Henderson and Kim 1990). The second type is that of a disruptive technology (Christensen, 1997) that requires altering the current mode of behavior of the services enabled by the innovation (Moore 1999).
Adoption of new technology or operational measures in air transportation, through all phases of the life-cycle, is determined by how the transition can be used to create, capture and deliver value to stakeholders (Campos 2008). An S-curve model can be used to describe the path followed by technology development, showing the relationship between levels of improvement in performance over time (see Figure 14). The returns to improvements diminish as technology limits are reached (Utterback, 1994). At this point disruptive new technology can enter the system. At first, transitioning into a new technology may appear less efficient and more costly than the current technology. However, after a period of maturation, the new technology can outperform the current one (Foster, 1986).
Figure 14: Technology life cycle as an S-curve
Source: (R. Henderson 2005)
Technology diffusion in air transport can also be analyzed using Roger‟s market segmentation dynamics, where adopters are classified into: innovators, early adopters, early majority, late majority and laggards (Campos 2008). There are very few adopters under the category of innovators but their endorsement is fundamental to reassure stakeholders that the technology is viable (Campos 2008). Early adopters buy into a technology only to seek specific benefits from it. Approximately one third of the adopters belong to the third category i.e. the early majority. Members in this segment will follow a wait and see strategy and evaluate how a technology is beneficial to others before deciding to adopt it. A strong baseline of proven benefits and the infrastructure to support the technology are necessary to encourage this group to invest (Campos 2008). Another third of the adopters falls under the fourth group - the late majority. They will wait until the technology becomes an established standard and will try to maintain the status quo unless change is necessary. The technology laggards represent the last segment. Stakeholders in this category are not interested in adopting a new technology if given the choice. This group is generally not particularly worth pursuing with targeted incentives (Moore 1999).
Figure 15: S-curve market segmentation
Source: (Everett 1983)
Another framework for investigating the diffusion of innovations is to derive a list of factors that can be expected to influence adoption and diffusion dynamics (Hall and Khan 2003). The factors can be classified into four main groups of factors that affect:
(1) benefits achieved (2) the costs of adoption
(3) industry or regulatory environment and (4) uncertainty and information problems.
These factors contribute directly to the speed of diffusion (Hall and Khan 2003) Benefit received from the new technology
The improvement of the new technology over the existing technology is the most critical determinant of benefits. When a new technology is introduced, the relative advantage is often relatively small but increases with learning and when adapted to different environments to attract a different set of adopters (Rosenberg 1972). This implies that the benefits increase over time and diffusion often appears delayed because learning increases the size of the adopting population. Network effects where the consumer and the firms benefit from the fact that other consumers and firms have also chosen the same technology play a critical role in the speed of adoption as well. (Hall and Khan 2003) classify this effect into two groups – direct and indirect benefits. Direct benefits allow the adopter to communicate/operate with other adopters using the same technology whereas indirect benefits lead to a particular standard being used by greater
number of adopters and therefore survive. Standard setting accelerates adoption in multiple ways – ease of communication and consumer learning being foremost (Hall and Khan 2003).
Costs of adopting the new technology
The second main class of factors affecting the decision to adopt new technology is those related to its cost. This includes not only the price of acquisition, but more importantly the cost of the complementary investment and learning required to make use of the technology. Such investment may include training of operators and the purchase of necessary capital equipment (whose diffusion is therefore affected by the same factors). Firm investment in new technologies is also sensitive to financial factors. The decision to adopt new technology is fundamentally an investment decision made in an uncertain environment, and therefore relationship between sources of finance and choice of investment strategy has a role to play (Hall and Khan 2003). In hazardous market conditions when liquidity is a concern, firms may be extremely risk averse, thereby restricting adoption of new technologies by limiting investment.
Market size, industry environment and market structure
Large dominant firms can spread the costs of adoption over more units, but also may not feel the pressure to reduce costs that leads to investment in new technologies. Along with market size and structure, the general regulatory environment will have an influence, tending to slow the rate of adoption in some areas due to the relative sluggishness of regulatory change and increasing it in others due to the role of the regulator in mandating a particular technical standard. As an example of accelerating the adoption, Mowery (Mowery and Rosenberg 1981) described the extent to which airline regulation by the Civil Aeronautics Board in the United States was responsible for promoting the adoption of new innovation in airframes and jet engines, in its role as standard setter and coordinator for the industry.
Information and uncertainty
The choice to adopt a new technology requires knowledge that it exists and some information about its suitability to the potential adopter‟s situation. Therefore an
important determinant of diffusion is information about the new technology and
experience. Upfront costs and long time lags to recover benefits and uncertainty surrounding them will often slow diffusion (Hall and Khan 2003)
5.2
The Bass Diffusion Model
The Bass Diffusion model (Bass 2004) is a conceptual representation that captures diffusion dynamics that result in S-curves. This model allows for asymmetric S-curve growth between the early adoption period and the later imitation period and is therefore more applicable to growth dynamics (i.e. “first mover advantage”) seen in the aviation industry. The model states that the ratio of the fraction of the adopters to the fraction of those who are still to adopt is a linear function of the cumulative number of adopters. This is mathematically represented as:
1
2
Equation 2 where,
3 f(t) is the adopting fraction i.e. fraction of the potential market that adopts at time „t‟ 4 F(t) is the adopter fraction, i.e the fraction of the potential market that has adopted up
to time „t‟
A(t) is the cumulative number of adopters till time „t‟
5 „p‟ is the innovation coefficient and accounts for the early adoption dynamics
6 „q‟ is the imitation coefficient and accounts for new adoption influenced by older adopters
7 „M‟ is the total number of potential adopters or market size
8 Figure 16 illustrates the different stages of implementation of a technology using the Bass diffusion model. (τ1) denotes the development phase after which the technology
technology has gone through the innovation, R&D, prototype testing and certification process. From that point onwards, adoption is driven by early movers and then by imitators (see Bass diffusion equation).
9
Figure 16: Conceptual representation of the Bass diffusion model
The total time to full adoption is called the Diffusion Time (τ2). For the purpose of
this study, the total period of development (τ1) and diffusion (τ2) is referred to as the
implementation period. Figure 16 shows rate of adoption by innovation and imitation (i.e. left ordinate axis). The cumulative number of adoptions as a fraction of the total possible adoptions is plotted along the right ordinate axis. The overall dynamic can be completely represented using three parameters: (1) the development time (or start date of diffusion), (2) the diffusion time and (3) the full adoption potential (scales to total number of adopters).
5.3
Frameworks for Identifying, Categorizing and Evaluating
Measures
Framework 1: Systematic grouping of mitigating measures
Section 1.1 (
Equation 1) introduced the modified Breguet range equation to decompose the total CO2
emissions from the aviation industry. The equation is used as the first framework for identifying the different levers for emissions abatement. The main categories are:
1. New Technologies: Entry with new aircraft models a. Propulsion improvements
b. Aerodynamic improvement c. Weight reduction
d. Retrofit existing aircraft 2. Operational improvements
a. Ground operations
b. Air Traffic Management (ATM) operations c. Airline operations
3. Alternative Fuels
Framework 2: The Bass Diffusion Model
Section 5.2 introduced the bass diffusion model as one way of conceptualizing the S-shaped growth that has been observed in past changes in the aviation industry. It lays the framework for determining the implementation characteristic of each mitigating measure based on three parameters: 1) Start Time of Diffusion (i.e. Entry Into Service) 2)
Diffusion Time (i.e. time constant from first entry into service to market saturation) 3)Potential for CO2 reduction (when full adoption is achieved).
Using the two frameworks, each mitigating measure can be identified as belonging to one of the three key areas of improvement and their impact on reducing system-wide carbon emissions can be evaluated based on the three parameters that define the implementation of characteristic of the measure.
C
HAPTER
6
I
DENTIFICATION AND
C
ATEGORIZATION OF
M
ITIGATING
M
EASURES
A broad range of technological and operational measures and fuel alternatives are available to the aviation industry to reduce its carbon emissions. Each measure, have unique development times, diffusion time constants and the potential to reduce emissions.
This chapter develops a portfolio of technology and operational measures, and alternative fuels that are currently available or anticipated in the future. Measures are categorized and analyzed using the frameworks developed in Section 4.3.
6.1
Methodology for Identification and Categorization of Mitigating
Measures
The first step to develop the portfolio of measures was to conduct a literature survey of journals, conference papers and presentations, annual reports, websites, press releases etc. The review identified 95 mitigating measures. The list is shown in Appendix A: List of Mitigating Measures.
The second step was a filtering and aggregation process that led to the construction of a portfolio of 41 unique measures. Technologies or concepts that have not reached maturity were filtered out. The set of measures was further synthesized by aggregating measures that were achieving similar goals (e.g. carrying less food and water, switching to electronic flight bags, reducing duty free goods were all aggregated into a single empty and payload weight reduction measure).
6.2
Estimation of the Diffusion Characteristics of Mitigating
Measures
The discussion on S-curve type implementation showed three key parameters that defined the dynamics of the process. The parameters are re-defined for the purpose of this analysis and to better suit the aviation industry.