Dynamics of Associative Polymer Networks
Irina Mahmad Rasid
M.Eng. Materials Science and Engineering, Imperial College London, 2015
Submitted to the Department of Materials Science and Engineering in partial fulfillment of the requirements for the degree of
Doctor of Philosophy
at the
Massachusetts Institute of Technology
February 2021
© 2020 Massachusetts Institute of Technology. All rights reserved.
Signature of Author:____________________________________________________________________ Department of Materials Science and Engineering
October 30, 2020 Certified by:__________________________________________________________________________
Niels Holten-Andersen Lecturer in Materials Science and Engineering Thesis Supervisor Certified by:__________________________________________________________________________
Bradley D. Olsen Professor of Chemical Engineering Thesis Supervisor Accepted by: __________________________________________________________________________ Frances M. Ross Ellen Swallow Richards Professor in Materials Science and Engineering Chair, Departmental Committee on Graduate Studies
3
Dynamics of Associative Polymer Networks
Irina Mahmad RasidSubmitted to the Department of Materials Science and Engineering on October 30, 2020 in partial fulfillment of the requirements of the degree of
Doctor of Philosophy in Polymers and Soft Matter
Abstract
Associative polymer networks are a versatile class of materials as demonstrated by their use in a wide variety of applications including biomaterials, viscosity modifiers and underwater adhesives. The viscoelastic and transport properties displayed by these associative networks can be tuned by careful design of the polymers that make up the network, as well as the transient interactions between them. Thus, elucidating the relationship between the molecular level details and the observed macroscopic properties is of high importance to further advance our understanding of associative networks. However, the complex dynamics displayed by these materials over a wide range of length and time scales present a significant challenge in studying this relation. This thesis aims to provide insights into the molecular origin of the dynamics of associative polymer networks.
The first part of this thesis investigates the molecular origin of shear thinning in associative networks through the design of a model associative polymer and a custom-built set-up referred to as “rheo-fluorescence” to quantify force-induced bond dissociation under shear flow. Comparison to existing models in transient network theory then demonstrate that retraction of dangling chains alone is insufficient to account for shear thinning in the model associative polymer network. Additional modes are likely contributing to the observed shear thinning behavior.
The second part of this thesis focuses on the effect of sticker density, sticker clustering and entanglements on the dynamics of the associative networks through combined studies of self-diffusion performed using forced Rayleigh scattering (FRS) and rheology. All three studies were performed using well-defined polymers with the same chemical composition such that the observed effects are solely due to the changes in sticker density, clustering and entanglements introduced during synthesis. The combined FRS and rheology studies on the effect of sticker density using a set of random copolymers revealed apparent superdiffusive scaling for chains with up to 15 stickers. This finding demonstrates that molecular hopping and thus, deviation from predictions of mean-field models persists to a higher limit than expected. To study the effect of sticker clustering, a polymer with clustered stickers was synthesized such that the molecular weight and sticker density were comparable to the random copolymers. It is demonstrated that the network topology is significantly altered by sticker clustering as evidenced by the opposite trends observed in the FRS and rheology measurements. Finally, the onset of entanglements was examined by performing FRS and rheology measurements on a high molecular polymer, prepared at concentrations that span the unentangled to the weakly entangled regime. A clear transition seen in the self-diffusion measurements demonstrates the advantage of FRS to study the transition regimes where other techniques like rheology only show subtle changes.
Thesis advisors: Niels Holten-Andersen, Lecturer, Materials Science and Engineering, and Bradley Olsen, Professor of Chemical Engineering
5
Table of Contents
List of Figures ... 7 List of Tables ... 14 Chapter 1. Introduction... 15 1.1 Motivation ... 151.2 Types of associative networks ... 17
1.3 Transient Network Theory ... 18
1.4 Models for Linear Associative Polymers with Stickers distributed along the chain .... 21
1.5 Self-Diffusion of Associative Networks ... 24
1.5.1 Past studies of self-diffusion in associative networks... 25
1.5.2 Advantages of Forced Rayleigh Scattering (FRS) ... 26
1.6 Thesis aims and overview ... 32
1.7 References ... 33
Chapter 2. Methods ... 37
2.1 General approach to polymerizations ... 37
2.2 Materials synthesis ... 39
2.2.1 Synthesis of poly(N,N – dimethylacrylamide) with pendant terpyridine side groups 39 2.2.2 Synthesis of poly(N,N – dimethylacrylamide) with pendant histidine side groups 49 2.3 Steady-shear experiments with the rheo-fluorescence set-up ... 72
2.3.1 Rheo-fluorescence design ... 72
2.3.2 Execution of steady-shear experiments with simultaneous fluorescence measurements ... 81
2.4 Forced Rayleigh scattering ... 84
2.4.1 Sample preparation for self-diffusion measurements ... 85
2.4.2 Potential issues and troubleshooting approaches ... 86
2.5 Linear rheology experiments ... 91
2.6 Gel permeation chromatography... 93
2.7 Liquid chromatography – Mass Spectrometry ... 94
2.8 Proton NMR ... 94
2.9 References ... 94
Chapter 3. Understanding the molecular origin of shear thinning in associative polymers through quantification of bond dissociation under shear ... 96
3.1 Abstract ... 96
3.2 Introduction ... 96
3.3 Materials and methods ... 98
3.3.1 Materials ... 98
3.3.2 Characterizations... 98
3.4 Results and discussion ... 105
3.5 Conclusions ... 113
6
Chapter 4. Anomalous Diffusion in Associative Networks of High Sticker-Density Polymers 116
4.1 Abstract ... 116
4.2 Introduction ... 117
4.3 Experimental section ... 121
4.4 Results and Discussion ... 123
4.5 Conclusion ... 145
4.6 References ... 147
Chapter 5. Effect of sticker clustering on the dynamics of associative networks ... 150
5.1 Abstract ... 150
5.2 Introduction ... 151
5.3 Methods... 155
5.4 Results and Discussion ... 162
5.5 Conclusions ... 178
5.6 References ... 179
Chapter 6. Self-Diffusion in a Weakly Entangled Associative Network ... 181
6.1 Abstract ... 181
6.2 Introduction ... 182
6.3 Experimental Methods ... 185
6.4 Results and Discussion ... 190
6.5 Conclusion ... 205 6.6 References ... 206 Chapter 7. Conclusions ... 210 7.1 Summary ... 210 7.2 Outlook ... 214 7.3 References ... 216 Appendix A ... 217
Appendix B: Supporting information for Chapter 3 ... 228
Appendix C: Supporting information for Chapter 4 ... 251
Appendix D: Supporting information for Chapter 5 ... 272
7
List of Figures
Figure 1-1. Examples of metal-coordinate complexes showing (A) the mono, bis and tris
complexes for catechol, and bis complex for (B) histidine and (C) terpyridine. Reproduced with permission from PNAS25, American Chemical Society26 and American Physical Society32. ... 18
Figure 1-2. Effect of increasing concentration (in terms of volume fraction of polymers) on the
network structure of linear polymers with the stickers dispersed evenly along the backbone. .... 21
Figure 1-3. Plot of mean squared displacement (MSD) of the center of mass as a function of time
from Brownian dynamics simulations of linear molecules with four stickers evenly spaced along the chain. The diffusivity of the chain, Dchain is smaller than the diffusivity of the segment between stickers, Dseg due to the hindrance induced by the stickers. The two Fickian diffusion regimes are separated by a subdiffusive regime. Simulation data courtesy of Ameya Rao. ... 25
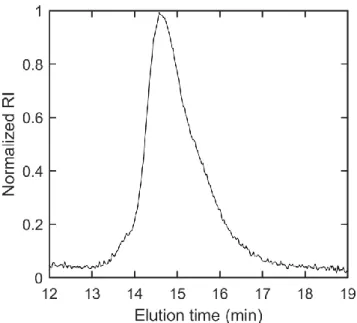
Figure 1-4. Plot of the characteristic time 𝜏 as a function of the squared grating spacing, 𝑑2 showing superdiffusive scaling with 𝜏~𝑑2(0.05) for lengths scales below 𝑑2 ~ 200 μm2, that transitioned to Fickian scaling with 𝜏~𝑑2 above 𝑑2 ~ 200 μm2. Data was taken for linear PDMA with pendant histidine groups, crosslinked with Ni2+. ... 27
Figure 1-5. BD simulation of FRS experiments of linear molecules with four stickers show the
origin of the superdiffusive scaling in FRS measurements. (A) Mean-square displacement of the center of mass as a function of time. (B) Characteristic time, 𝜏 as a function of the domain length, 𝑑24𝜋2. (C) Time evolution of the one-dimensional non-Gaussian parameter 𝛼 = 𝑥43𝑥22 − 1. (D) Probability distribution of the motion of the center of mass at several time points, which are highlighted as dashed lines in (A), (B) and (C). Note the log-linear scale to show the long tail of the bimodal probability distribution. Data of FRS simulations courtesy of Ameya Rao. ... 29
Figure 1-6. In the two-state model13, the width and slope of the superdiffusive scaling are dictated by the parameters of the model, with DM and DA representing the diffusivity of each mode and kon and koff as the rate of interconversion between states. The slope is related to the width of the superdiffusive scaling regime and is a measure of the separation of diffusivity of the two modes. ... 31
Figure 2-1. Flowmeter (part number: 4112K95, McMaster-Carr) used to control flow rate during
N2 purging prior to polymerizations. The knob is adjusted to obtain a flow rate of 280 cm3 min-1, which for this model corresponds to 50 mm on the scale. ... 37
Figure 2-2. Heat block with 20 mL airfree vial and 100 mL round bottom flask... 38 Figure 2-3. TLC plate developed with 10% methanol in DCM. Lane 1:
4′-chloro-2,2′:6′,2′′-terpyridine (RF = 0.9), lane 2: cospot, lane 3: crude reaction product (RF = 0.1). Spots were visualized using a UV lamp. Ninhydrin stain was used to confirm the presence of amine group for spot at RF 0.1 (not shown in image). ... 40
Figure 2-4. 1H NMR characterization of 4'-(3-hydroxypropoxy)-2,2':6',2''-terpyridine (CDCl3, 300 MHz). ... 41
Figure 2-5. TLC plate developed with ethyl acetate. Ratio of methacryloyl chloride to precursor I
for lane 1 = 1:1, lane 2 = 1.25:1, lane 3 = 2:1. Spots were visualized using a UV lamp. Ninhydrin stain was used to confirm the presence of amine group for spot at RF = 0. At 1:1 the reaction did not go to completion as indicated by the presence of unreacted precursor I at RF = 0 and at 2:1, an impurity is seen at RF = 0.7. ... 43
Figure 2-6. Chromatogram from purification of TpyMA using silica flash chromatography with a
gradient of 75% hexane:25% ethyl acetate to 100% ethyl acetate. Some impurities are seen eluting before the product (large green peak). ... 43
8
Figure 2-7. 1H NMR characterization of N-(3-([2,2':6',2''-terpyridin]-4'-yloxy)propylmethacryl-amide (CDCl3, 300 MHz). ... 44
Figure 2-8. 1H NMR characterization of EMP (CDCl3, 300 MHz). ... 46
Figure 2-9. 1H NMR characterization of P(DMA-co-TpyMA) ((CD3)2SO, 300 MHz). ... 48
Figure 2-10. GPC characterization of poly(N,N – dimethylacrylamide) with pendant terpyridine
side groups using DMF with 10% triethylamine and 10% pyridine as the mobile phase. The molecular weight of the polymer was 17.4 kg mol-1 with a dispersity of 1.08. ... 49
Figure 2-11. Chromatogram from purification of HisMA using silica flash chromatography with
0−10% MeOH in DCM as eluents. Some impurities are seen eluting before the product (large yellow peak). ... 51
Figure 2-12. 1H NMR characterization of HisMA (CDCl3, 300 MHz). ... 51
Figure 2-13. Chromatogram from purification of EMP dimer using silica flash chromatography
with hexanes and ethyl acetate (70:30 to 40:60) as eluents. Some impurities are seen eluting before the product (large blue peak). ... 52
Figure 2-14. 1H NMR characterization of PDMA polymers with protected histidine side groups (CDCl3, 400 MHz). Peaks assigned b and g in the spectrum are used for calculating the monomer ratio in the polymers. Data shown for PDHM15. ... 55
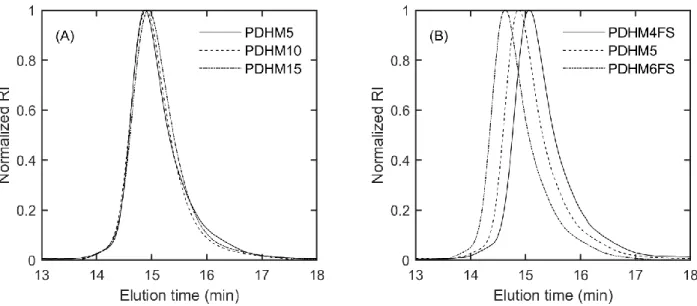
Figure 2-15. DMF GPC characterization of all polymers prior to deprotection. All samples were
prepared at 10 mg/mL in DMF with 0.02 M LiBr. All polymers have dispersity below 1.05. .... 56
Figure 2-16. 1H NMR characterization of PDMA polymers with protected histidine side groups (CDCl3, 400 MHz). Peaks assigned b and c in the spectrum are used for calculating the monomer ratio in the polymers. Data shown for PDHM15. ... 59
Figure 2-17. DMF GPC characterization of the midblock, sampled before the addition of HisMA
(Mw = 15.9 kg mol-1, Ɖ = 1.06) and the final polymer prior to deprotection (Mw = 29.5 kg mol-1,
Ɖ = 1.03). All samples were prepared at 10 mg/mL in DMF with 0.02 M LiBr. ... 60
Figure 2-18. DMF GPC characterization of all polymers prior to deprotection. All samples were
prepared at 10 mg/mL in DMF with 0.02 M LiBr. All polymers have dispersity of 1.1 or below. ... 62
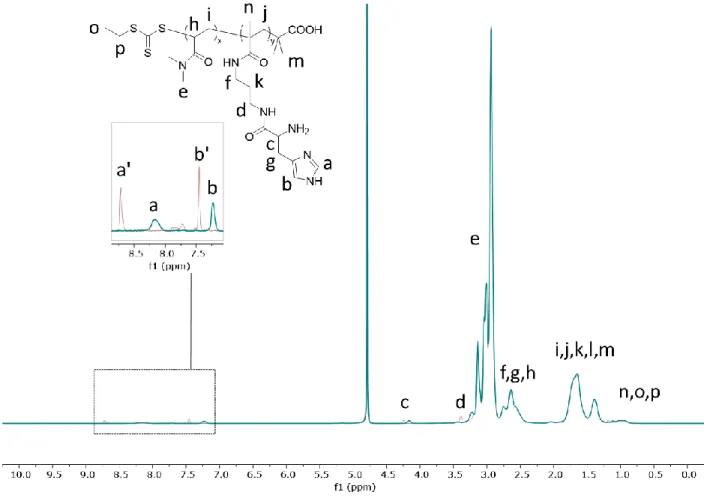
Figure 2-19. 1H NMR characterization of PDMA polymers with deprotected histidine side groups (D2O, 400 MHz). Peaks assigned a’ and b’ in the spectrum corresponds to histidine-TFA salt while peaks assigned a and b corresponds to free histidine. Data shown for the PDHM5 polymer. ... 65
Figure 2-20. 1H NMR characterization of PDMA polymers with histidine side groups, after deprotection (D2O, 400 MHz). The position of peaks a and b shift slightly due to hydrogen bonding with residual TFA in the polymer. Data shown for PDHM5, PDHM10 and PDHM15. ... 66
Figure 2-21. After deprotection and removal of residual TFA by filtration with water, ~15 mg of
the polymers [PDHM4FS (15.0 mg), PDHM5 (15.1 mg), PDHM6FS (15.5 mg), PDHM10 (15.1 mg) and PDHM15 (15.0 mg)] were dissolved in 1 mL of 0.1 M KCl. To each solution, the appropriate amount of Ni2+ was added such that the ratio of His:Ni2+ was 2:1. The pH values were then recorded as aliquots of 0.1 M KOH were added. ... 67
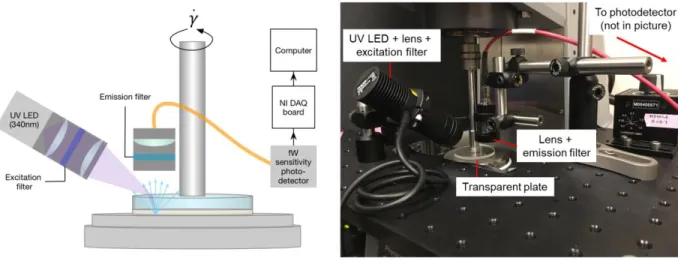
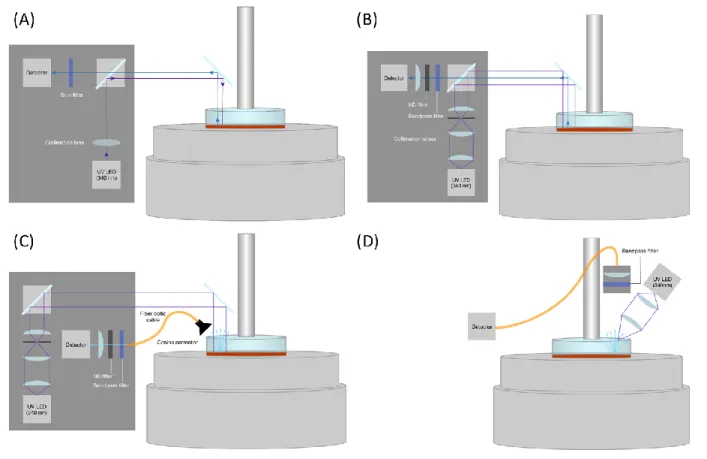
Figure 2-22. Schematic and photo of the rheo-fluorescence set-up showing the position of the
excitation source and collection lens, relative to the transparent upper plate. ... 73
Figure 2-23. Schematics of the initial designs tested for the rheo-fluorescence set-up. ... 76 Figure 2-24. (a) The calibration curve for calculating the fraction of dissociated bond from the
measured photodetector output, obtained using standard solutions of known concentrations of terpyridine, at a gap height of 0.3 mm. (b) The fluorescence of the standard solutions was also
9
measured on a fluorimeter, which supports the linear relation between the measured signal and the concentration. ... 77
Figure 2-25. (A) The breadboard before it was cut. (B) Drawing of the dimensions that was cut
using the waterjet cutter. (C-D) Side and top view of the elevated breadboard showing its position on the bench and relative to the MCR301 rheometer. ... 78
Figure 2-26. (A) The transparent plate with the D-PP10 plate glued to the sapphire window. (B)
The plates are then attached to the shaft for disposable geometries. The plates shown here were made of quartz. (C) Sapphire was chosen for the plate material due to the autofluorescence of quartz seen as blue specks under illumination with the UV LED. ... 79
Figure 2-27. The (A) top5 and (B) back6 view of the LED controller (LEDD1B, from Thorlabs). ... 80
Figure 2-28. The background photodetector output while the plate is stationary with the LED
operated on (A) continuous wave (CW) or (B) trigger (TRIG) mode. ... 81
Figure 2-29. Plot of stress vs strain for a range of shear rates (Wi = 0.48 – 14.9). Data shown for
the P(DMA-co-TpyMA)-Ni gel at 10% (w/v), at 80 °C. ... 82
Figure 2-30. (A-G) Typical raw data for a set of start-up to steady shear experiment at 80˚C, for
shear rates Wi = 0.48 – 14.9. The blue dots are data points collected from the photodetector output as intensity, in units of Volts. The red lines are smoothing spline fits applied to filter out the inherent noise from the photodetector. ... 83
Figure 2-31. (A-C) Decay curves showing a decay-grow-decay type response. All three curves
were acquired for the same sample and under identical conditions, but at different positions. Data shown for PDHM10-100k gel at 15% (w/v), ), with 𝜃 = 15° and at 35 °C. ... 86
Figure 2-32. Plot of 𝜏2 vs 𝑑2 for samples prepared with ONS-labelled polymers for gels with concentration of 15 – 25% (w/v). Data collected at 25 °C... 87
Figure 2-33. Plot of 𝜏 vs 𝑑2 for samples prepared with filtered and unfiltered ONS-labelled polymers. Data shown for PDHM4FS gel with concentration of 20% (w/v) and at 25 °C. ... 89
Figure 2-34. Plot of 𝜏 vs 𝑑2 for samples prepared with fluorescein-labelled and ONS-labelled polymers for self-diffusion measurement of PDHM polymers. Data shown for PDHM5 gel with concentration of 25% (w/v) and at 35 °C. ... 90
Figure 2-35. Plot of intensity vs time for the same sample where the writing time was decreased
from (A) 750 ms to (B) 250 ms. All other conditions were identical. Data shown for PDHM7-100k gel with concentration of 15% (w/v), with 𝜃 = 2° and at 35 °C. ... 91
Figure 2-36. Example data of frequency sweeps obtained using (A) a 10 mm diameter plate and
(B) a 25 mm diameter plate. The upturn and downturn for ω = 10 – 100 rad s-1 is eliminated by the use of a larger plate. Data obtained for PDHM4FS at 20% (w/v), and with γ = 1%. ... 92
Figure 2-37. Example data for (A) amplitude sweeps (ω = 10 rad s-1) and (B) frequency sweeps, with γ = 1%, which was determined to be within the linear viscoelastic regime based on the amplitude sweep. Data obtained for PDHM7-100k at 50% (w/v). Experiment performed at 25 °C. ... 93
Figure 3-1. Reaction scheme for the synthesis of the terpyridine-functionalized monomer (II) and
P(DMA-co-TpyMA), where x = 148 and y = 7 as determined by 1H NMR. ... 101
Figure 3-2. (a) Schematic of the rheo-fluorescence setup showing the position of the excitation
source and collection lens, relative to the transparent upper plate. (b) The photo shows the rheo-fluorescence setup, with the optical elements mounted on a raised breadboard. ... 103
10
Figure 3-3. (a) The calibration curve for calculating the fraction of dissociated bond from the
measured photodetector output, obtained using standard solutions of known concentrations of terpyridine, at a gap height of 0.3 mm. (b) The fluorescence of the standard solutions was also measured on a fluorimeter, which supports the linear relation between the measured signal and the concentration. ... 104
Figure 3-4. (a) The proposed network structure of the gel consists of inter (bridging) and intra
(loop) chain bonds, along with dissociated (dangling) bonds. Dangling chains may exist as both terminal chains or larger dangling segments between two physical junctions. The large circles denote the pervaded volume of the chains, which are overlapping, while the small gray circles indicate the pervaded volume for strand between stickers. (b) The bonds are bis complexes of terpyridine with nickel that form through a reversible reaction with rate constants, kd and ka. .. 105 Figure 3-5. Typical result from startup to steady shear experiments showing the change in the
fraction of dissociated bonds fd and dimensionless stress 𝜎 as a function of strain for two shear rates: (a) Wi = 0.96 and (b) Wi = 8.65, where Wi = 𝛾𝜏𝑟. The fd are smoothing spline fits applied to filter out the inherent noise from the photodetector. ... 107
Figure 3-6. (a)–(c) Best fits for the VM, TE, and Sing model obtained using least-squares fit by
treating the parameters of the models as fitting parameters for data obtained at 70, 75, and 80 °C, respectively. (d)–(f) The corresponding η calculated for VM, TE, and Sing models, using the same fitting parameters, compared to data obtained at 70, 75, and 80 °C. ... 108
Figure 3-7. Normalized stress relaxation following a small step strain (strain = 1%) at 70, 75, and
80 °C for the terpy-acrylamide gel. The dotted lines are fits to a phenomenological Kohlrausch-Williams-Watts (KWW) function. ... 109
Figure 3-8. Effect of temperature on Keq (red diamonds) and fit parameters p0 and q0 (black symbols). ... 113
Figure 4-1. (A) Linear copolymers of N,N-dimethyl-acrylamide and a histidine-functionalized
monomer were synthesized by varying the monomer feed ratio to achieve average sticker densities,
S, of 5, 10 and 15 stickers per chain. The degree of polymerization (N = x + y) in all cases is N~250
such that the average sticker spacing l = N/S for each polymer decreases with increasing sticker density. (B) Upon addition of Ni2+ ions, a purely associative network is formed with Ni-histidine bis-complexes as the primary crosslinks (proposed structure is shown on the right). Chain highlighted in red schematically represents a polymer chain labelled with a single fluorescein molecule. (C) Forced Rayleigh scattering forms one-dimensional concentration grating in the gel within the region of constructive interference where the photochromic dyes are irreversibly isomerized. ... 120
Figure 4-2. An example showing the decay in intensity over time (red dots). (A) (i and ii) The fit
to a single stretched exponential function (eq 4-2) gave a reasonable fit, but the residuals indicate a contribution from a second exponential term. (B) (i and ii) The fit to a sum of two stretched exponential function (eq 4-3) resulted in smaller residuals that do not show a time-dependence. Data acquired for PDHM15 25% (w/v) at 𝜃 = 2° (𝑑2 = 195.5 μm2) and temperature of 35 °C. ... 124
Figure 4-3. (A-C) The plot of 𝜏1 and 𝜏2 from the fits to eq 4-3, compared to 𝜏 from the fit to eq 4-2, (D-F) A2/A1 from the fit to a sum of two exponential fits and (G-I) the β exponent from the single exponential fit, for PDHM5, PDHM10 and PDHM15 at 25% (w/v), respectively, as a function of 𝑑2, the square of the characteristic spacing in the holographic grating defined by eq
4-11
1. Error bars represent standard error of measurements performed in triplicate. Error bars for filled symbols are smaller than the symbols. ... 126
Figure 4-4. Plot of 𝜏 vs 𝑑2 for (A) PDHM5, (B) PDHM10 and (C) PDHM15 at 15%, 20%, 25% and 30% (w/v), measured at 35 °C. The molecular weight was held constant, while the sticker density was increased. The dashed lines are fits to the two-state model. Error bars represent standard error of measurements performed in triplicate. ... 129
Figure 4-5. Effect of sticker density on (A) the effective diffusivity in the large-length-scale
Fickian regime, 𝐷𝑀, 𝑒𝑓𝑓 (B) the molecular dissociation rate 𝑘𝑜𝑓𝑓, and (C) 𝛾𝐾𝑒𝑞. The parameters were obtained by fitting the analytical solution of the two-state model to the experimentally derived relation 𝜏 vs 𝑑2 for gels at various concentrations. Error bars represent 95% confidence intervals from fits to the two-state model. ... 131
Figure 4-6. Diffusion data plotted in reduced parameter space. The dashed lines are fits to the
two-state model. The black dashed line shows the case where 𝛾𝐾𝑒𝑞 = 1. Increasing the gel concentration and sticker density leads to a narrower range of 𝑑2 spacing over which the apparent superdiffusive scaling is observed. The extent of the superdiffusive regime spans orders of magnitude even for the polymers with the highest sticker density. ... 136
Figure 4-7. The zero-shear viscosity, η, as measured from frequency sweeps at 35 °C, as a function
of the volume fraction of polymer, φ. ... 138
Figure 4-8. The probability distribution of sticker density for random copolymers is expected to
follow a Poisson distribution34, centered around the mean value of the sticker density, S. ... 141
Figure 4-9. (A) The linear copolymers, of N,N-dimethyl-acrylamide and a histidine-functionalized
monomer with fixed sticker spacing were synthesized by varying the ratio of EMP to the total monomer concentration to achieve average sticker densities, S of 4 and 6 stickers per chain. The sticker spacing, l~50, such that the degree of polymerization, N=lS is different for each polymer. (B) The schematic shows the proposed walking distance for polymers with (i) fixed N and (ii) fixed l. ... 142
Figure 4-10. Plot of 𝜏 vs 𝑑2 for (A) PDHM4FS, (B) PDHM5 and (C) PDHM6FS at 20%, 25% and 30% (w/v), measured at 35 °C. The sticker spacing was held constant, while the sticker density was increased. The dashed lines are fits to the two-state model. Error bars represent standard error of measurements performed in triplicate. ... 144
Figure 4-11. Effect of sticker density on (A) the effective diffusivity in the large-length-scale
Fickian regime, 𝐷M, eff (B) the molecular dissociation rate, koff and (C) γKeq. The parameters were obtained by fitting the analytical solution of the two-state model to the experimentally derived relation 𝜏 vs 𝑑2 for gels at various concentrations. Error bars represent 95% confidence intervals from fits to the two-state model. ... 144
Figure 4-12. Diffusion data for polymers with fixed l plotted in reduced parameter space. The
dashed lines are fits to the two-state model. ... 145
Figure 5-1. (A) (A) Copolymers of N, N-dimethylacrylamide and a histidine-functionalized
monomer have the histidine clustered at the ends (PDHMc8) and distributed along the backbone (PDHM5 and PDHM10). The numbers denote the average number of histidines per chain, S. The number of repeat units, N was approximately 250 for all the polymers, with the midblock on the PDHMc8 polymer consisting of 160 repeat units. (B) On addition of Ni2+ the histidine forms a bis-complex (proposed structure shown in inset). The proposed network structure for each type of copolymer includes interchain, intrachain and dissociated bonds. ... 154
12
Figure 5-2. Plot of bTG’ (filled symbols) and bTG” (unfilled symbols) vs aTω for (A) PDHMc8, (B) PDHM5 and (C) PDHM10 at 25% (w/v), measured at 5 – 35 °C. All data sets are master curves constructed by time-temperature superposition referenced to 35 °C. Data for PDHM5 and PDHM10 at 35 °C previously reported in ref. 3. ... 165
Figure 5-3. (A) Plot of the plateau modulus, Gp as function of the average spacing between stickers, l. For the clustered copolymer, lmid = 160 is the average number of repeat units in the midblock and lend = 14 is the average spacing between stickers in the end blocks. The black line is the calculated Gp based on eq. 4. (B) Clustering strength (from the low-q feature in SANS data) for each polymer. The clustering strength is defined as the first term in eq. 5 with q = 0.04 nm-1. ... 166
Figure 5-4. Scattered intensity from SANS experiments for PDHMc8, PDHM5 and PDHM10 at
25% (w/v), measured at 25 °C. The red lines are fits to a correlation length model. The dashed lines are fits to the last two terms in in eq. 5 only. The clustering strength is defined as the first term in eq. 5 with q = 0.04 nm-1 (shown by double arrow for PDHM5). The spectra haven been shifted vertically for clarity. ... 168
Figure 5-5. Network relaxation time τ from frequency sweeps at varying temperatures for gels at
25% (w/v). The black dashed lines are fits to an Arrhenius law. The histidine-Ni complex dissociation time, τd, (measured in dilute solution)20 is included for comparison. ... 170
Figure 5-6. Proposed mechanism for stress relaxation for the gels. (A) For PDHMc8, stress
relaxation requires cooperative dissociation of the stickers on one chain end to move to a new cluster. . The reduced volume a sticker can explore as S is increased for the random copolymers (B) PDHM5 and (C) PDHM10 leads to renormalization of the bond lifetime. ... 171
Figure 5-7. Plot of 𝜏 vs d2 for PDHMc8, PDHM5 and PDHM10 measured at 35 °C. (B) PDHM5 and (C) PDHMc8 measured at 15 – 35 °C. All gels prepared at a concentration of 25% (w/v). The dashed lines are fits to the two-state model5. Error bars represent one standard deviation of measurements performed in triplicate. Note that the data shown for PDHM5 and PDHM10 at 35 °C was reported in an earlier publication3, while remaining data for PDHM5 was newly measured on the same polymers that were previously synthesized in ref 3. ... 172
Figure 5-8. Effect of temperature on (A) the effective diffusivity in the large-length-scale Fickian
regime, DM,eff and (B) γKeq. The parameters were obtained by fitting the analytical solution of the two-state model to the experimentally derived relation 𝜏 vs d2 for gels at temperatures. Error bars represent 95% confidence intervals from fits to the two-state model. ... 173
Figure 5-9. (A) Schematic showing the additional types of defects that can be present in the
clustered polymer network. The restriction imposed by the proximity of the stickers to its neighbor can also create more defects such as intrachain bonds and dissociated bonds than found in the random copolymers. (B) The distribution of number of stickers / chain end estimated by a Poisson distribution. 40 ... 176
Figure 6-1. The model associative network is a hydrogel prepared with a linear copolymer of
N,N-dimethylacrylamide and a histidine-functionalized monomer such that metal-coordinate crosslinks are formed upon addition of Ni2+ ions. ... 185
Figure 6-2. Plot of 𝜏 vs 𝑑2 for PDHM7-100k at 1.1 – 3.1 𝜙𝑒 (which corresponds to 10 – 28% (v/v)), measured at 35 °C. The dashed lines are fits to the two-state model while the solid line is a linear regression to determine the diffusivity of the sample at 3.1 𝜙𝑒. Error bars represent standard error of measurements that were performed in triplicates. ... 191
Figure 6-3. Effect of concentration on (A) the effective diffusivity in the large length-scale Fickian
13
(unfilled circle) and (B) 𝛾𝐾𝑒𝑞. The parameters were obtained by fitting the analytical solution of the two-state model to the experimentally derived relation 𝜏 vs 𝑑2 for gels at 1.1 – 2.5 𝜙𝑒. .... 193
Figure 6-4. Plot of G’ and G” vs ω for PDHM7-100k gels for concentrations ranging from 0.6 –
4.8 φ/φe. All data collected at 35 °C. Filled symbols correspond to concentrations investigated with FRS and unfilled symbols were omitted since the time scales were not experimentally accessible. ... 197
Figure 6-5. Plot of the zero shear viscosity, η0 as a function of concentration, 𝜙/𝜙𝑒 for PDHM7-100k measured at 35 °C. Dashed lines show power law fit for concentrations that are above the entanglement concentration (𝜙 > 𝜙𝑒). ... 198
Figure 6-6. Plot of G’ (filled symbols) and G” (unfilled symbols) vs ω for (A) PDMA-100k (B)
PDHM7-100k (C) PDHM10-100k and (D) PDHM15-100k all prepared at 4.8 𝜙𝑒. Experiments were performed at 5 – 55 °C and TTS was used to plot G’ and G’’ vs ωaT, with Tref = 35 °C. The dashed red lines are fits to the sticky double reptation model. ... 200
Figure 6-7. Plot of the high-frequency plateau modulus, Gp as a function of concentration, 𝜙/𝜙𝑒 for PDHM7-100k measured at 35 °C. ... 202
Figure 6-8. Plot of τ as a function of concentration, 𝜙/𝜙𝑒, with 𝜏 = 1𝜔𝑐 from frequency sweep measurements and 𝜏 = 𝑅𝑔2𝐷𝑀, 𝐸𝑓𝑓 from self-diffusion measurements... 205
14
List of Tables
Table 1-1. Concentration regimes predicted by the sticky Rouse and sticky reptation theories.
Adapted from ref 45. ... 22
Table 2-1. The mass and volume of reactants used for the synthesis of PDMA polymers with
pendant histidine side groups. ... 54
Table 2-2. The weight-average molar mass, Mw, and dispersity, Ɖ, of each polymer determined by DMF GPC as polymerized, calculated mole percent histidine (from 1H NMR), average number of stickers per chain, S, average degree of polymerization, N, and average spacing between stickers, l. ... 54
Table 2-3. The mass and volume of reactants used for the synthesis of high molecular weight
PDMA polymers with pendant histidine side groups. ... 61
Table 2-4. The weight-average molar mass, Mw, and dispersity, Ɖ, of each polymer determined by DMF GPC as polymerized, calculated mole percent histidine (from 1H NMR), average number of stickers per chain, S, average degree of polymerization, N, and average spacing between stickers, l. ... 62
Table 2-5. Part numbers for rheo-fluorescence set-up. ... 73 Table 3-1. 𝜏𝑟 extracted from fitting the stress relaxation data to a phenomenological Kohlrausch-Williams-Watts (KWW) function. ... 109
Table 3-2. The probability rate of bond dissociation and association for a range of models.a .. 112
Table 4-1. The properties of the linear copolymers of N,N-dimethyl-acrylamide and a
histidine-functionalized monomer synthesized by RAFT polymerization. a ... 121
Table 4-2. The concentration of gels investigated in this work in terms of 𝜙/𝜙𝑠, where 𝜙𝑠 is the concentration for overlap of the strand between stickers... 128
Table 4-3. The ratio of the fraction of free stickers, [𝑓]𝑆[𝑓]5, as estimated from eq 4-8 and from the ratio of 𝐷M, eff, s. ... 140
Table 5-1. Comparison of the properties and critical concentrations for the random (PDHM5 and
PDHM10) and clustered (PDHMc8) copolymersa. ... 164
Table 6-1. The values of Gp, ns, ne, τs and τrep for PDMA-100k, PDHM7-100k, PDHM10-100k and PDHM15-100k, at T = 35 °C. a ... 203
15
Chapter 1. Introduction
1.1 Motivation
Associative polymer networks are ubiquitous in synthetic and natural materials since their tunable dynamics offer control over desirable properties such as toughness, stress relaxation, shear thinning and self-healing. 1-6 The associative groups (stickers) display internal energy on the order of 1 – 10 kBT , such that the associative bonds break and reform and thus appears reversible at the
time scales of our observation.7 The incorporation of stickers into the backbone of polymer chains results in a complex interplay between the sticker and chain dynamics such that understanding the physics across a wide range of length scales and time scales presents a significant challenge. However, it is this very feature of associative networks that enables the materials’ behavior to be finely tuned to achieve the desired properties by adjusting the polymer concentration, number of stickers per chain and many other important parameters.8
In natural materials, the mussel byssus thread is one example where the presence of stickers in the form of metal coordinating ligands provides the thread with enhanced toughness and self-healing properties. When the byssus threads experience large strains (> 10 – 15%), the threads initially stretch elastically before reaching a yield point where the metal coordination bonds break, thereby acting as sacrificial bonds that enhance toughness of the byssus by dissipating energy. Upon removal of the applied load, the damaged threads are able to regain their initial stiffness after a period which presumably corresponds to the time scales of reformation of the network formed by metal coordination bonds. Thus, metal coordination bonds play a key role in enhancing the durability of the mussel byssus threads9; a property that is important for the mussels to remain
16
attached to coastal rocks under the turbulent conditions of high velocity waves breaking onto the rocks.10
In synthetic materials, certain applications require the design of materials that possess a complex combination of properties. In the case of injectable hydrogels for use in biomedical applications, the hydrogels must first undergo shear thinning while they are extruded through the needle.11 In associative networks, the stress applied by the syringe induces the dissociation of the transient bonds resulting in shear thinning. Once extruded, the hydrogel network must then reform its structure within a desired timeframe, a goal which is easily achievable in associative networks since the re-formation of the bonds typically occur within seconds and can be further tuned as needed.12 Unlike permanently crosslinked networks, associative networks do not require potentially toxic initiators to induce the formation of crosslinks. 11
Both the natural and synthetic example presented above demonstrate the importance of understanding the associative network’s response in the linear and nonlinear deformation regimes to effectively design materials that can meet the demands of these applications. The development of models and theories over the last 3-4 decades has substantially improved our understanding of the dynamics of associative networks and their relation to the mechanical and transport properties of these materials; however, quantitative predictions of experimental results remain elusive. Further refinement of the theories and models is needed, but a primary challenge remains in correlating the macroscopic properties of the associative networks with their underlying molecular mechanisms via direct experimental observations.
17
1.2 Types of associative networks
Many classes of associative networks have been studied to date, ranging from protein hydrogels to polymer melts incorporating transient bonding groups in the backbone.13-14 The wide variety of options is reflected in the choice of using protein vs synthetic polymer, presence of a solvent (gel vs melt state)15, chain architecture (linear vs star polymers)16-17, binding chemistries, and position of the stickers on the chain (randomly distributed along backbone vs at chain ends). 18-19
Some common associative binding interactions include ionic bonding (specifically ionomers)19-22, hydrogen bonding18, 23-24 and metal-coordination25-27. Associative networks formed using ionomers are known to form ionic aggregates19, while associative networks formed with strong hydrogen-bonding groups are prone to crystallize, in both cases complicating the characterization of the resulting micro-phase separated networks 28-29. In contrast, metal-coordination bonds have the advantage of typically being well-defined with regards to their association state. Depending on the combination of coordinating ligand (L) and metal ion (M), the complexes formed are usually either mono, bis or tris complexes (corresponding to L:M of 1:1, 2:1 and 3:1 respectively, see Figure 1-1).25-26 The equilibrium constants of different complex formations have been well-characterized, along with the effect of temperature, pH and metal ion concentration such that the junction functionality and lifetime of the bond can be easily tuned.26, 30 In the study of the dynamic properties of associative networks, this is highly advantageous as adjustments of the time scales associated with the model system are often necessary to ensure they are experimentally accessible.
18
Additionally, the macroscopic properties of associative networks are strongly affected by other factors such as network topology and chain architecture.8, 31 Therefore, the use of stickers with well-defined characteristics is desirable to limit the ambiguities arising from difficulty in characterizing the nature of the crosslinks formed by the stickers.
Figure 1-1. Examples of metal-coordinate complexes showing (A) the mono, bis and tris
complexes for catechol, and bis complex for (B) histidine and (C) terpyridine. Reproduced with permission from PNAS25, American Chemical Society26 and American Physical Society32.
1.3 Transient Network Theory
Under large deformation, associative networks can undergo Newtonian flow, shear thinning or shear thickening, depending on the rate of deformation and the type of associative network used.31, 33-35 These properties are particularly important for applications where the material
19
is expected to undergo a large deformation either in use or during processing.11 Thus, the design of associative networks for certain applications requires the study of their nonlinear properties in addition to their properties under equilibrium conditions.
Transient network theory is the state-of-the-art method for understanding the nonlinear mechanical response of associative networks. It originated from the work of Green and Tobolsky published in 1946, which attributed stress relaxation in rubbers to the relaxation of physical entanglements.1 Tanaka and Edwards then adapted the ideas for associative networks by introducing a bond dissociation rate that depends on the chains’ end-to-end distance.2 At equilibrium, the chains exist either as bridging chains (interchain bonds) or dangling chains (one end attached to a crosslink and one free). Under large deformation, the bridging chains are stretched to the point where force-induced bond dissociation occurs to form dangling chains. These dangling chains then retract to their equilibrium configuration to relax stress in the network, resulting in shear thinning. Thus, shear thinning in their model is accompanied by a large increase in the fraction of dangling chains. Their model, however, assumes that the fraction of intrachain bonds that form loops remain constant at all times, and thus fails to capture the effect of polymer concentration on linear and nonlinear rheological properties. 31 Experimental and theoretical work since then have shown that loops are important to fully capture the mechanical response of associative networks. 31, 36
To account for the effect of polymer concentration on rheological properties, Annable et
al.31 considered the more complex topology that can exist, especially at low polymer concentrations. Beyond single chain bridges, dangling and looped chains, they proposed that the network structure would additionally include superbridges and superloops such that heterogeneity
20
of the network is more pronounced at low concentrations. Their theory and simulations agreed closely with the effect of concentration on network mechanics observed in experiments, thereby demonstrating the importance of changes in network topology with increasing polymer concentration. However, the complex nature of the model prevents the development of a closed form solution suitable for analytical or numerical evaluation. 33
Beyond linear telechelic chains with a single sticker at each chain end, Sing et al.37 have also studied networks formed from chains with multiple stickers on each end, separated by a non-associative midblock. Their model shows that incorporating multiple stickers such that dissociation occurs in stages can lead to improved toughness in associative networks. Several experimental works have been done to study networks formed from chains with multiple stickers on each end; however, only qualitative agreement with theoretical predictions has been found so far. 18-19 This is in part due to the complex topologies that can form in multi-sticker polymer networks, which results in a variation of reported trends of rheological properties such as relaxation times and network stiffness.18-19 Thus, further characterization of these multi-sticker networks is needed using complementary techniques that are more sensitive to the network topology.
The development of transient network theory over the last few decades has qualitatively captured many features of the response of associative networks such as shear thinning and shear thickening 33, 36, 38-41, and has brought us closer to arriving at quantitative predictions.33 However most investigations so far have focused on searching for unique rheological signals as evidence for one model or the other 33, 42. Complementary studies targeting molecular level details such as bond states and network topology are needed to direct further improvements in the formulation of transient network theory.
21
1.4 Models for Linear Associative Polymers with Stickers distributed along the chain
The presence of multiple stickers distributed along the chain results in many more states that the chains can exist in, and the main theoretical framework for understanding the effect of this chain architecture was proposed by Rubinstein, Semenov, Colby and Leibler in the form of the sticky Rouse and sticky reptation models. 8, 43-44 The two theories use scaling analysis to outline the effect of stickers on polymer dynamics by building on the classical Rouse and reptation theory for non-associative polymers. By considering the volume occupied by each chain and the degree of overlap of the chains at various concentrations, they derived scaling laws for the terminal relaxation time, viscosity and diffusivity as a function of concentration, number of stickers and the spacing between stickers. Their model predicts that several scaling regimes should exist as a function of polymer concentration due to factors such as the conversion of intrachain to interchain bonds and the presence of entanglements (Figure 1-2). These scaling regimes are summarized in Table 1-1.
Figure 1-2. Effect of increasing concentration (in terms of volume fraction of polymers) on the
22
Table 1-1. Concentration regimes predicted by the sticky Rouse and sticky reptation theories.
Adapted from ref 45.
Concentration range* Description
Sticky Rouse model for overlapping but unentangled chains
𝜙 < 𝜙𝑟𝑒𝑛
Unrenormalized bond lifetime; transfer of intra- to intermolecular association
𝜙𝑟𝑒𝑛 < 𝜙 < 𝜙𝑠
Renormalized bond lifetime; transfer of intra- to intermolecular association
𝜙𝑠 < 𝜙 < 𝜙𝑒 Renormalized bond lifetime; mostly intermolecular association
Sticky Rouse model for overlapping and entangled chains
𝜙𝑒 < 𝜙 < 𝜙𝑟𝑒𝑛 Unrenormalized bond lifetime; transfer of intra- to intermolecular association
𝜙𝑟𝑒𝑛 < 𝜙 < 𝜙𝑠 Renormalized bond lifetime; transfer of intra- to intermolecular association
𝜙𝑠 < 𝜙 < 𝜙𝑙𝑒 Renormalized bond lifetime; mostly intermolecular association 𝜙𝑙𝑒 < 𝜙 < 1 Renormalized bond lifetime; entangled strands between stickers
*𝜙 is concentration in volume fraction, 𝜙𝑟𝑒𝑛 is the concentration above which bond lifetimes are renormalized, 𝜙𝑠 is the concentration above which the strand between stickers overlap, 𝜙𝑒 is the concentration for entanglements and 𝜙𝑙𝑒 is the concentration above which the strand between stickers are entangled.
There are several key predictions of the two models. For associative networks in the unentangled regime, the sticky Rouse model predicts strong scaling of the properties with concentration due to the conversion of intrachain to interchain bonds. Once most of the stickers are participating in either intrachain or interchain bonds, the time scale for bond exchange increases because the stickers have to return to the same partner multiple times before successfully switching to a new partner. For associative networks in the entangled regime, the sticky reptation
23
model predicts a significant jump in the viscosity and terminal relaxation time since the chains are now restricted to lateral motion within the tube defined by the entanglements. However, while some qualitative agreement with these predictions was found, quantitative agreement has been rare. 18, 45-46 In part, this is due to the fact that the experimentally accessible concentration ranges are typically too narrow to clearly separate the multiple scaling regimes predicted by both theories.
To date, the scaling relationships in sticky Rouse and sticky reptation theory offer substantial insights into the changes that occur within the network structure as a function of concentration number of stickers and the spacing between stickers. However, in the development of these models, several assumptions were made that limits the applicability of the two models. This includes the assumption that the chains contain a large number of stickers per chain and have high degree of polymerization between the stickers, which is difficult to achieve experimentally.8, 44, 47 While the models offer a method to estimate key parameters such as the fraction of intrachain bonds in the network, the estimates are difficult to verify and are more likely to deviate for chains with few stickers and low degree of polymerization between stickers. The mean-field approach taken by these models may not apply to a large number of studies that do not meet these assumptions.
Additionally, the sticky reptation model considers chains that are strongly entangled with ~100 entanglements per chain.43 Since the sticky Rouse model only considers concentrations well below the entanglement concentration, gels that are prepared in the concentration regime of 2 – 10 entanglements per chain were not considered between the two models. Newer models have now built on the sticky reptation model to account for effects such as contour length fluctuation and constraint release.22, 48 These effects were shown to broaden out the relaxation processes which
24
may obscure the signatures of entanglements in viscoelastic measurements, which is already expected to be subtle for weakly entangled polymers. 22, 48 However, these new models still considered reptation as one of the relaxation modes, and it is unclear if they are able to truly bridge the gap since reptation has been shown to only be important for chains with more than ~10 entanglements per chain for non-associative polymers. 49 Deciphering the subtle changes presents a substantial challenge and as such this transition regime is still poorly understood.
1.5 Self-Diffusion of Associative Networks
Due to the reversible nature of their crosslinks, the chains of associative polymers are able to diffuse through the network. As initially proposed by Baxandall, the presence of the stickers results in hindered Fickian diffusion where the diffusivity of the entire chain is reduced by a factor of the number of stickers on the chain.3 The segments between the stickers do not sense the presence of the stickers and thus undergo Fickian diffusion with the expected dynamics of Rouse/Zimm modes. The transition between the two Fickian diffusion regimes is seen as a subdiffusive regime over length scales that are on the order of the radius of gyration of the polymer (Figure 1-3). 50
Since the viscoelastic properties and self-diffusion are both governed by the same underlying process of bond dissociation and re-association, a successful theory for associative networks must capture the observations of both measurements.3, 51 Despite this, most studies of associative networks focus on characterizing their linear viscoelastic response, with only a handful of studies performed on self-diffusion13, 23, 45, 52-54. It should be noted that the techniques employed in these studies can only access length scales that correspond to several times the radius of gyration of the polymers (highlighted by the red box in Figure 1-3).
25
Figure 1-3. Plot of mean squared displacement (MSD) of the center of mass as a function of time
from Brownian dynamics simulations of linear molecules with four stickers evenly spaced along the chain. The diffusivity of the chain, Dchain is smaller than the diffusivity of the segment between stickers, Dseg due to the hindrance induced by the stickers. The two Fickian diffusion regimes are separated by a subdiffusive regime. Simulation data courtesy of Ameya Rao.
1.5.1 Past studies of self-diffusion in associative networks
Self-diffusion refers to the measurement of the diffusive motion of the associative polymer chains through the bulk associative network formed by these chains. The techniques used for self-diffusion in associative networks thus far have been pulsed field gradient nuclear magnetic resonance (PFG-NMR)55-56, fluorescence recovery after photobleaching (FRAP)23, 45 and forced Rayleigh scattering (FRS)13, 17, 52. These techniques differ in the length scales that are probed which determines the range of experimentally accessible diffusivities. The range of accessible diffusivities is typically above 10-14 m2 s-1 for PFG-NMR, 10-9 – 10-18 m2 s-1 for FRAP and 10-10 – 10-20 m2 s-1 for FRS. 57-58 Since diffusivities of associative networks have been shown to be as
26
low as 10-16 m2 s-1, the range covered by PFG-NMR would have been insufficient for these studies. 13 While FRAP is capable of measuring diffusivities in a similar range to FRS, its limitation arises from the fact that the length scale probed using FRAP is limited to the spot size generated during the measurements, which is typically around 5 μm.23 At such large length scales, these measurements would require data acquisition over several hours to measure diffusivities close to 10-18 m2 s-1 and thus would only be possible for samples that are stable over that period.23 FRS measurements can be performed over length scales spanning 0.5 – 50 μm such that the experiment times are significantly reduced.13 Additionally, this feature of FRS makes it more sensitive to self-diffusion behavior which may have a length scale dependence.
1.5.2 Advantages of Forced Rayleigh Scattering (FRS)
The studies of self-diffusion using FRS have uncovered a phenomenon that has not been reported previously in associative networks. For diffusion studies over length scales that corresponded to 101 – 104 times Rg, superdiffusive scaling was observed for the smaller range of experimentally accessible length scales that then transition to Fickian scaling at larger length scales first reported in the work of Tang et al. in 2015 (see Figure 1-4 for sample data).13
While FRS has been used to study self-diffusion in polymers since 1981, all the reported data since then have shown only Fickian scaling, until the work of Tang et al. in 2015.13, 59-60 In past reports where a deviation from Fickian scaling was observed, this was attributed to the behavior of the dye and not the dynamics of the polymers itself.60 Previous measurements of FRS have been limited to a small range of d spacings in the range of d2 = 0.1 – 5 μm2; this limitation is likely due to the sample’s dynamics that complicates the measurements rather than an instrument limitation. For a subset of associative networks, the relatively slow time scale of the gel relaxation
27
reduces the effect of fluctuations such that significantly longer experiments can be performed. This widens the range of accessible time scales significantly, allowing for a much wider range of d2 = 0.1 – 3000 μm2 spanning four decades of d2 (square of the diffractive grating spacings) to be explored in experiments. This was crucial for the study on the origin of superdiffusive scaling in FRS since the reliability of the measurements over several decades allowed for the measurement of both the superdiffusive and Fickian scaling regimes, which enabled further analysis to be performed. Thus, for associative networks that fall in this category where the self-diffusion can be measured across a wide span of length scales, FRS is uniquely suited to probe the self-diffusion in these networks and uncover further details of its dynamics.
Figure 1-4. Plot of the characteristic time 〈𝜏〉 as a function of the squared grating spacing, 𝑑2 showing superdiffusive scaling with 〈𝜏〉~𝑑2(0.05) for lengths scales below 𝑑2 ~ 200 μm2, that transitioned to Fickian scaling with 〈𝜏〉~𝑑2 above 𝑑2 ~ 200 μm2. Data was taken for linear PDMA with pendant histidine groups, crosslinked with Ni2+.
28
The work of Ramirez et al. has elucidated the origin of this unexpected observation of superdiffusive scaling in FRS measurements using Brownian dynamics (BD) simulation. Figure 1-5 (A) shows that over length scales that are accessible in FRS (shaded red), the mean squared displacement (MSD) of the center of mass of the chains show only Fickian diffusion. However, the plot of the characteristic time, 〈𝜏〉 as a function of the domain length, 𝑑2⁄4𝜋2 as measured in FRS shows superdiffusive scaling at the smaller range of length scales that transitions to Fickian scaling at larger length scales (Figure 1-5 (B)). The origin of this discrepancy can be seen from the time evolution of the non-Gaussian parameter and the probability distribution of the motion of the center of mass (Figure 1-5 (C and D)). Figure 1-5 (C) shows that the apparent superdiffusive scaling is seen when the non-Gaussian parameter is greater than is greater than 1. Figure 1-5 (D) shows that for times when the distribution is non-Gaussian, a bimodal distribution is seen in the probability distribution of the center of mass of the chains. This bimodal distribution consists of a central Gaussian distribution with small variance (slow but frequent diffusive event) and a long tail (fast but rare diffusive event). Note that the probability distribution function was plotted on a log-linear scale to show the long tail in the distribution. Superdiffusive scaling in FRS is seen over length scales where a bimodal distribution (from combination of slow, but frequent and a fast, but rare diffusion modes) develops because FRS experiments sample a moment of the distribution that is more sensitive to the spread in diffusivities than the average. 50 Thus, the origin of the superdiffusive scaling in FRS is different from the physics behind the observation of superdiffusion where the MSD increases with time and ballistic motion occurs for exponents of x = 2 or greater for MSD ~ tx. Note that while this observation shows superficial similarities to reports of “Fickian, but non-Gaussian” diffusion for other physicochemical systems such as supercooled liquids, the origin of the bimodal distribution is distinct for each system. 61-62 Despite
29
the distinct origin for its occurrence, studies of Fickian but non-Gaussian diffusion in various systems have led to further insights into the dynamics of these systems and can potentially reveal unexpected dynamics of associative networks.62
Figure 1-5. BD simulation of FRS experiments of linear molecules with four stickers show the
origin of the superdiffusive scaling in FRS measurements. (A) Mean-square displacement of the center of mass as a function of time. (B) Characteristic time, 〈𝜏〉 as a function of the domain length, 𝑑2⁄4𝜋2. (C) Time evolution of the one-dimensional non-Gaussian parameter 𝛼 = 〈𝑥4〉 3〈𝑥⁄ 2〉2− 1. (D) Probability distribution of the motion of the center of mass at several time points, which are highlighted as dashed lines in (A), (B) and (C). Note the log-linear scale to show the long tail of the bimodal probability distribution. Data of FRS simulations courtesy of Ameya Rao.
30
In addition to demonstrating the origin of the superdiffusive scaling, the BD simulations performed by Ramirez et al. also provides a molecular explanation for the slow and fast diffusion modes that leads to the bimodal distribution.50 They proposed a molecular model for diffusion where diffusion can occur through walking (with diffusivity Dwalk) and hopping (with diffusivity
Dhop) such that the effective diffusivity (Dchain in Figure 1-5 (D)) has contributions from both modes. The hopping mode refers to chains that dissociates all interchain bonds to diffuse by random walk, while the walking mode refers to all other diffusion modes where at least one of the stickers remains attached to the network. In FRS, the dye-labelled polymers diffuse independently in parallel such that the total flux is given by the sum of the flux over all the diffusing species. The total flux is then the sum of the product of the individual diffusivity and concentration gradient imposed during the measurement. Thus, the effective diffusivity is given by a weighted average of the diffusing species. Note that the slope and extent of the superdiffusive scaling regime are dictated by the interplay between the walking and hopping modes – a result that was also demonstrated by the two-state model of Tang et al. (Figure 1-6).13 Based on this result, superdiffusive scaling is expected to be less prevalent for associative networks where hopping is unlikely – one example would be chains with many stickers such that the probability of dissociating all its stickers is low. In these cases, the predicted results of the mean-field models such as sticky Rouse should be recovered. The simulation results of Ramirez et al. showed good agreement with the FRS data on star polymers studied by Tang et al..52 Note that the two-state model does not define the physical “states” of the two diffusion modes and thus is unable to provide molecular insights. However, it is this very feature of the model that allows it to quantitatively fit the data for a wide variety of associative networks without further modification, enabling quantitative comparison of the superdiffusive scaling seen in these networks.
31
Figure 1-6. In the two-state model13, the width and slope of the superdiffusive scaling are dictated by the parameters of the model, with DM and DA representing the diffusivity of each mode and kon and koff as the rate of interconversion between states. The slope is related to the width of the superdiffusive scaling regime and is a measure of the separation of diffusivity of the two modes.
The combination of experimental and theoretical work of Tang et al.13, 52 and Ramirez et
al.50 have uncovered a potential source of deviations from the predictions of the mean-field sticky Rouse model for unentangled associative networks. It highlights the importance of considering molecular level details, especially for associative networks that do not meet the strict assumptions of the sticky Rouse and sticky reptation models. However, further work must be done to validate and further refine the molecular model and extend it to other chain architectures.
32
1.6 Thesis aims and overview
This thesis aims to provide insights into the dynamics of associative networks using experimental techniques that are sensitive to molecular level events occurring within the network under linear and nonlinear deformation. The remainder of this thesis is organized as follows. Chapter 2 details the synthesis of the model associative polymers used in this thesis and the experimental methods used for their characterization. Chapter 3 describes the quantitative measurement of force-induced bond dissociation using a metal-coordinate gel specifically designed such that its bond state is coupled to its fluorescence. A custom-built design enables simultaneous measurement of the steady-shear response along with the fluorescence of the gel in a method referred to as “rheo-fluorescence”. Chapters 4 – 6 focus on the use of FRS as a complementary technique to rheology to study the effect of sticker density, sticker clustering and the presence of entanglements on the dynamics of associative networks. The studies in chapter 4 – 6 were performed using well-defined polymers with the same chemical composition such that the observed effects were solely due to changes in sticker density, clustering and entanglements introduced during synthesis. Chapter 4 demonstrates the effect of sticker density on self-diffusion of random copolymers with up to 15 stickers per chain. The origin of the superdiffusive scaling observed for copolymers of high sticker density is discussed. Chapter 5 details the effect of sticker clustering on the dynamics of associative networks. Quantitative comparison between the clustered copolymer and the random copolymers described in Chapter 4 are discussed with regards to the altered network topology. Chapter 6 focuses on the properties of the associative networks in the regime spanning the unentangled to the weakly entangled regime. Discussion in this chapter covers quantitative comparison between the entangled associative networks in this study and the unentangled associative networks from chapter 4 and the advantage of FRS for studying the
33
transition regime. Chapter 7 summarizes the thesis and presents direction for future work in understanding the molecular origin of the dynamics of associative networks.
1.7 References
1. Green, M. S.; Tobolsky, A. V., A New Approach to the Theory of Relaxing Polymeric Media.
The Journal of Chemical Physics 1946, 14 (2), 80-92.
2. Tanaka, F.; Edwards, S., Viscoelastic properties of physically crosslinked networks. 1. Transient network theory. Macromolecules 1992, 25 (5), 1516-1523.
3. Baxandall, L., Dynamics of reversibly crosslinked chains. Macromolecules 1989, 22 (4), 1982-1988.
4. Weng, G.; Thanneeru, S.; He, J., Dynamic Coordination of Eu-Iminodiacetate to Control Fluorochromic Response of Polymer Hydrogels to Multistimuli. Adv Mater 2018.
5. Tee, B. C.; Wang, C.; Allen, R.; Bao, Z., An electrically and mechanically self-healing composite with pressure-and flexion-sensitive properties for electronic skin applications.
Nature nanotechnology 2012, 7 (12), 825.
6. Holten-Andersen, N.; Lee, B. P.; Messersmith, P. B.; Waite, J. H.; Lee, K. Y. C., Mussel-Inspired Self-Healing Hydrogels. Biophys J 2010, 98 (3), 604a-604a.
7. Zhang, Z.; Chen, Q.; Colby, R. H., Dynamics of associative polymers. Soft Matter 2018, 14 (16), 2961-2977.
8. Rubinstein, M.; Semenov, A. N., Dynamics of entangled solutions of associating polymers.
Macromolecules 2001, 34 (4), 1058-1068.
9. Zechel, S.; Hager, M. D.; Priemel, T.; Harrington, M. J., Healing through Histidine: Bioinspired Pathways to Self-Healing Polymers via Imidazole(-)Metal Coordination.
Biomimetics (Basel) 2019, 4 (1).
10. Carrington, E.; Moeser, G. M.; Thompson, S. B.; Coutts, L. C.; Craig, C. A., Mussel attachment on rocky shores: the effect of flow on byssus production. Integr Comp Biol 2008,
48 (6), 801-7.
11. Sun, Y.; Nan, D.; Jin, H.; Qu, X., Recent advances of injectable hydrogels for drug delivery and tissue engineering applications. Polymer Testing 2020, 81, 106283.
12. Olsen, B. D.; Kornfield, J. A.; Tirrell, D. A., Yielding behavior in injectable hydrogels from telechelic proteins. Macromolecules 2010, 43 (21), 9094-9099.
13. Tang, S.; Wang, M.; Olsen, B. D., Anomalous self-diffusion and sticky Rouse dynamics in associative protein hydrogels. J Am Chem Soc 2015, 137 (11), 3946-57.
14. Li, C. H.; Wang, C.; Keplinger, C.; Zuo, J. L.; Jin, L.; Sun, Y.; Zheng, P.; Cao, Y.; Lissel, F.; Linder, C.; You, X. Z.; Bao, Z., A highly stretchable autonomous self-healing elastomer. Nat
Chem 2016, 8 (6), 618-24.
15. Mozhdehi, D.; Neal, J. A.; Grindy, S. C.; Cordeau, Y.; Ayala, S.; Holten-Andersen, N.; Guan, Z., Tuning dynamic mechanical response in metallopolymer networks through simultaneous control of structural and temporal properties of the networks. Macromolecules 2016, 49 (17), 6310-6321.
16. Grindy, S. C.; Learsch, R.; Mozhdehi, D.; Cheng, J.; Barrett, D. G.; Guan, Z.; Messersmith, P. B.; Holten-Andersen, N., Control of hierarchical polymer mechanics with bioinspired metal-coordination dynamics. Nat Mater 2015, 14 (12), 1210-6.

![Figure 2-7. 1 H NMR characterization of N-(3-([2,2':6',2''-terpyridin]-4'-yloxy)propylmethacryl- N-(3-([2,2':6',2''-terpyridin]-4'-yloxy)propylmethacryl-amide (CDCl 3 , 300 MHz)](https://thumb-eu.123doks.com/thumbv2/123doknet/14755013.582062/44.918.109.808.98.599/figure-characterization-terpyridin-yloxy-propylmethacryl-terpyridin-yloxy-propylmethacryl.webp)