HAL Id: hal-02010873
https://hal.archives-ouvertes.fr/hal-02010873
Submitted on 22 Feb 2019HAL is a multi-disciplinary open access archive for the deposit and dissemination of sci-entific research documents, whether they are pub-lished or not. The documents may come from teaching and research institutions in France or abroad, or from public or private research centers.
L’archive ouverte pluridisciplinaire HAL, est destinée au dépôt et à la diffusion de documents scientifiques de niveau recherche, publiés ou non, émanant des établissements d’enseignement et de recherche français ou étrangers, des laboratoires publics ou privés.
Methane oxidation in a biofilter (Part 2): A lab-scale
experiment for model calibration
Corrado Amodeo, Salvatore Masi, Stijn van Hulle, Pierfrancesco Zirpoli,
Ignazio Mancini, Donatella Caniani
To cite this version:
Corrado Amodeo, Salvatore Masi, Stijn van Hulle, Pierfrancesco Zirpoli, Ignazio Mancini, et al.. Methane oxidation in a biofilter (Part 2): A lab-scale experiment for model calibration. Jour-nal of Environmental Science and Health, Part A, Taylor & Francis, 2015, 50 (13), pp.1404-1409. �10.1080/10934529.2015.1064278�. �hal-02010873�
1 Methane oxidation in a biofilter (part 2):
a lab-scale experiment for model calibration
CORRADO AMODEO 1,2*, SALVATORE MASI 1, STIJN W.H. VAN HULLE 2, PIERFRANCESCO ZIRPOLI 1, IGNAZIO M. MANCINI 1 and DONATELLA CANIANI 1
1 School of Engineering, University of Basilicata – Viale dell’Ateneo Lucano - 85100 Potenza (Italy)
2 Department of Industrial Biological Sciences, Ghent University Campus Kortrijk, Graaf Karel de Goedelaan, 5 - 8500 Kortrijk (Belgium)
__________________
*Address correspondence to Corrado Amodeo,Department of Industrial Biological Sciences, Ghent University Campus Kortrijk, Graaf Karel de Goedelaan, 5 - 8500 Kortrijk (Belgium); Phone: +32 493673719; Fax: +32 56241224;
2 Abstract
Methane is a strong greenhouse gas, 21 times more than carbon dioxide. Landfills are one of the most important anthropogenic source of methane trough biogas production. For small or old landfills it is not possible install energy recovery systems and in several cases it is impossible to use flares as well. In these situations biofiltration represents a valid alternative for biogas treatment. In biofilters methane is oxidized by methanotrophic bacteria. In this study an experimental study on a biological methane oxidation column presented with the aim to calibrate a mathematical model developed in an earlier study. The column was designed to reproduce at lab-scale a real biofilter trying to consider the more probable landfill boundary conditions. Although the methane oxidation efficiency in the column was lower than the expected (around 35%), an appropriate model implementation showed an acceptable agreement between the outcomes data of the model simulation and the experimental data (with a Theil’s Inequality Coefficient value of 0.08). A calibrated model allows a better management of the biofilter performance in terms of methane oxidation.
Keywords: Methane oxidation, methane emission, landfill gas, methanotrophs microorganisms, biofilters.
3 Introduction
Biogas treatment
The methane is an important greenhouse gas: 21 times more effective at trapping heat than the carbon dioxide [1]. In the last years the methane concentration in the atmosphere increased from
a value of 715 parts per billion (ppb) related to pre-industrial age to 1774 ppb registered in 2005 [2]. One of the most important anthropogenic sources of the methane is biogas that is
produced by the anaerobic decomposition of organic waste. The main components of this biogas are indeed carbon dioxide (CO2) and methane (CH4). In the US about 6.329 Tg of CH4
were produced from landfills in 2007 [3]. In Europe, in 2006, the methane from landfills was the
second largest source of anthropogenic CH4 (22%) with an estimated CH4 emission of 3.373 Tg
from waste disposal [4]. Worldwide landfills produce large amount of biogas. Some studies tried
to calculate the values of methane released in atmosphere every year by landfills worldwide and this value is between 35 and 69 Tg year–1 of CH4[5].
In relation with the environmental problematics related to the global warming, in the last few years many countries have recognized the treatment of biogas as an important step to lower the emission of greenhouse gasses. In all the developed countries new landfills must provide for a biogas extraction system linked with an energy recovery plant.
However there are different situations, such as small waste disposal sites or old landfills in which is not possible or not cost-effective making a new LFG (landfill gas) extraction system or a new energy recovery plant. For these situations there are different way to treat the biogas in order to lower the methane concentration content in the flow.
Flares represent a system to reduce the methane present in the biogas. The methane is oxidized to carbon dioxide and water through combustion. Technical specifications for flares available on the market indicate a minimum flow of 50 Nm3/h and a methane concentration of 30% v/v
4 of other gaseous pollutants (hydrocarbons, nitrogen oxides, carbon monoxide etc.). In many cases the flow and the methane concentration in the gas are low for any flares.
The biofiltration
The biofiltration is a biologic treatment for the biogas and represent a reliable system for those situations characterized by low flow quantity (less than 50 Nm3/h) and low methane
concentration (less than 30%). The process consist in a biologic oxidation occurred by the methanotrophic bacteria. These bacteria are able to use the methane content in the gas flow as carbon source. The biochemical reaction (∆°G = -780 kJ mol-1 CH
4, ∆°H = -890 kJ mol-1) is the following [7-8]:
heat
O
H
x
CO
x
O
x
CH
4+
(
2
−
)
2→
(
1
−
)
2+
(
2
−
)
2+
The kinetics of the process are described by Michaelis–Menten [8-9-10]:
2 2 2 4 4 4 max o O m o CH CH m CH
C
K
C
C
K
C
V
r
+
⋅
+
⋅
=
Where:• r = CH4 oxidation rate [mol/(m3*h)];
• Vmax = maximum CH4 oxidation rate [mol/(m3*h)];
• Km = Michaelis–Menten or half-saturation constant [mol/m3];
• C = concentration [mol/m3];
The biofilter is an aerobic reactor in which the biochemical reaction described before is occurring. Generally biofilters are containers filled with material that allows the methanotrophic bacteria to develop. The filling material is the heart of the system and different studies were focused to find the best composition to oxidize the methane [11-12-13-14]. Wood
chips are considered a good material to support and sustain the development of a methanotrophic biofilm. From a technical point of view the LFG is conveyed and conducted by
5 a piping system to the biofilter [15]. To avoid preferential pathways in the bottom of the
container there is an empty space in which the LFG can be distributed uniformly over the entire oxidation surface.
As for all the biological processes many environmental factors influence the methane oxidation efficiency. The temperature is an important parameter that control this process [16]. The optimal
range for these bacteria is around 25 – 35 °C [17], while 31°C is mentioned as the optimal
temperature by King & Adamsen [18], methane oxidation can occur down to 1–2 °C [19]. The
moisture of the filling material is important for the nutrient transport and it has to be between 10-20% w/w [20]. If the water content is higher the methane oxidation efficiency goes down
(molecular diffusion in water is about 100 times slower than in the air [21]). If this value is under
the threshold value of 5% the bacteria activity is drastically reduced as the water stress in the system influences the nutrient supply [22-23]. The pH value for the methane oxidation must be
between 5.5 and 8.5 [10]. The exopolymeric substances (EPS) can also influence the methane
oxidation efficiency. EPS accumulation in the biofilm reduces the CH4 oxidizing capacity
[24-25].
Aim of the study
The biogas treatment for small or landfills in advanced stages of post management is a challenging task. The biofiltration is a good solution because it is not affected by the low LFG flow or by the low methane concentration in the biogas. The development of a mathematical model to manage and control the biofiltration process is very important in order to optimize the performance of a biofilter. The aim of this study concerns the calibration and use of the mathematical model developed and tested by Amodeo et al. [26] through a lab-experiment,
6 Materials and methods
For the process of model calibration a lab-scale column was constructed (Fig. 1).
The column was made in glass with a diameter of 7 cm (resulting in a horizontal surface of 0.0038 m2). The total height was 95 cm divided in: (from the bottom) 5 cm of free space in order to have a good distribution of the gas, 10 cm of gravel to avoid preferential pathways for the gas phase, 70 cm of filling material; 10 cm of free space to allow a good mixing of the exhaust gas and also to insert all the instruments such as temperature sensor, water input and gas output pipe. Between the gravel and the free space a plexiglass filter of 5 mm was placed to prevent the gravel from falling down. To close the column in the top a cork stopper was used with three holes (one for the temperature sensor, one for the water input pipe and one for the gas output pipe).
Filling material
The aim of the work was to reproduce the conditions of a full scale biofilter. As suggested in literature [27] the material selected for this work was a 50% - 50% mixture of compost and
landfill soil. The presence of compost ensures the organic substance, necessary for the biologic processes (in this case for the methanotrophic bacteria development). Due to exposure to any biogas losses, the landfill soil is very important as well, because it could already contain several methanotrophic bacterial cultures. The landfill soil was taken from Vanheede landfill (municipality of Roeselare, Belgium, www.vanheedelandfillsolutions.be). The mixing soil had a specific weight of 645.6 kg/m3, a relative moisture content of 17.82% and a total solids content
of 82.18%, determined by drying 3 soil samples of 10 g each for 48 h at 105°C.
Flow and gas composition
The gas composition and the flow are very important parameters [28]. The goal of this work is to
7 conditions, for which the biofiltration represent an interesting solution, are with low methane content in the biogas (about 10%). For this reason a gas flow with 3% of methane was used. This value is lower than 10% for safety reasons (the experiment was conducted indoors). Further, the gas contained 20% of oxygen (according to Wang et al. [29]) and 77% of nitrogen.
This gas composition was purchased as such at Air Liquide. The applied flow rate it was 0.1 liter per minute (lpm). This value came out considering, as usual in this work, the operative conditions in small and/or old landfills. A full scale biofilter is designed for flow of around 50 Nm3/h [30]. If it is considered that the ratio between the volume of the biomass in the column
(0.0027 m3) and the biomass volume in the full scale biofilter (22 m3) is 0.0012, a flow rate of
0.1 lpm was obtained (50 Nm3/h*0.0012 = 0.006 Nm3/h = 0.1 lpm). Now if the total flow (0.1 lpm), the methane percentage in the flow (3%) and the effective oxidation surface of the column (0.0038 m2) are known it is possible to calculate the value of the methane loading rate:
which is d m mol soil CH ⋅ 2 4 50 . Experimental procedures
After the column was filled with the soil, the gas was introduced from the bottle to the column. The experiment was conducted for two months. During the first part (one month) the gas, before entering in the column, was directed in a gas-washing bottle filled with water in order to saturate the gas. In this way it was tried to avoid that the gas took away moisture from the soil. The experiment in this first part was conducted with an on/off system: the gas flow was on for 8 hours per day and 5 days per week. During the second part of the experiment (another month) the gas was conducted directly to the column (without saturation) and the system was operated continuously (24 hours per day 7 days per week). Every day several parameters were monitored. Soil temperature was measured (two times per day) with a Traceable®
8 Thermometer with a sensor of 30 cm and a range of -50 - 150 °C. To measure the flow a Cole Parmer® flowmeter was installed with (measurement range 0 – 0.5 lpm).
Gas samples and gas analysis
A valve system has been prepared for collecting the exhaust gas samples from the top of the column. During the experiment this valve system provided a possibility to directly sample the gas from the column, as during sample collection all the gas flow is directed in a tube already connected with a 12 mL syringe. The gas collected in the syringes was transferred in small bottles sealed with rubber stoppers. The bottle was filled with an acid solution composed of sulfuric acid, distilled water and methyl orange. The pH of the solution was around 2 (generally the ratio is 200 µl of sulfuric acid for liter of distilled water). The aim of the solution is to retain the gas and in the same time to avoid gas transfer to the liquid phase. It is only possible that a portion of carbon dioxide is transferred from the biogas to the solution, although the low pH minimizes this effect. At the same time, for each sample of exhaust gas, an input gas sample was taken in the same way.
The gas samples were analyzed using the gas chromatograph Agilent 6890 Serie Plus. A Hamilton gas syringe (250 μL) was used. The injector temperature was 65°C, the oven temperature was 55°C and the temperature of the Flame Ionization detector (FID) was 200°C. The chromatograph was calibrated with a known gas composition (80% of methane, 10% of carbon dioxide, 5% of nitrogen and 5% of hydrogen).
Mathematical model description
The mathematical model considered was developed by Amodeo et al. [26]. The model calculates
the methane, carbon dioxide and oxygen concentration as function of the filter height as function of for example the biogas flow. As such the following equations were used:
9 (1)
(
S)
CH CH CH CH CH y H y St d dy 4 4 4 4 4 =− ⋅ − ⋅ ω 2 4 4 4 4 2 4 4 4 4 4 4 4 4 4 4 4 CH CH CH m CH m CH CH CH CH CH m CH CH CH CH S CH H y K K H y H X K H y H X y + + − + + − − = (2)(
S)
O O O O O y H y St d dy 2 2 2 2 2 =− ⋅ − ⋅ ω S CH CH m S CH O O O O S O y K y H X H y y 4 4 4 2 2 2 2 2 2 + ⋅ ⋅ − = (3)(
S)
CO CO CO CO CO y H y St d dy 2 2 2 2 2 = ⋅ − ⋅ ω S CH CH m S CH CO CO CO CO S CO y K y H X H y y 4 4 4 2 2 2 2 2 + ⋅ − = Where:• yCH4, yO2, yCO2 = mole fraction in the gas phase [dimensionless];
• ω = z / h , with h the height of the filling material and z the axial coordinate
• StCH4, StO2, StCO2 = Stanton number [dimensionless];
• HCH4, HO2, HCO2 = Henry’s law constant [dimensionless];
• yS
CH4, ySO2, ySCO2 = mole fraction on the biomass boundary [dimensionless];
• XCH4, XO2, XCO2 =ratio between Damköhler and Stanton number [dimensionless];
• KmCH4, KmO2, KmCO2 = half-saturation constant [dimensionless];
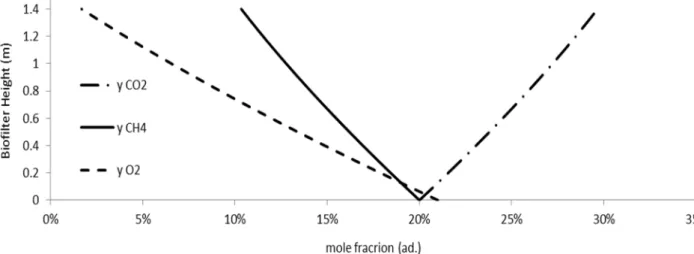
For the nominal operating conditions (Tab.1) of an aerobic full scale biofilter the results of the model are shown in the Figure 2.
Results and Discussion
The results of the lab-scale experimental column show that the methane oxidation occurred by the methanotrophic bacteria. These results were compared with those obtained from the mathematical model in order to perform a calibration.
10
Model Implementation
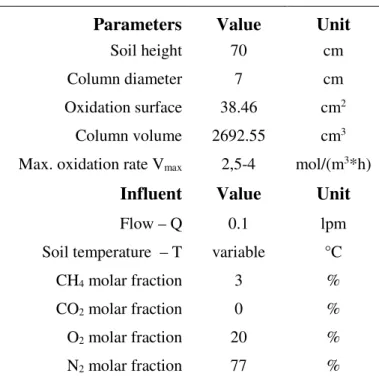
For simulations with the mathematical model the following influent conditions and model parameters were used as described in the material and methods section and summarised in Table 2.
The value of the maximum oxidation rate Vmax is very important for the methane oxidation efficiency [26-31-32]. After several considerations it was decided to initially use 4 mol/(m3*h) as a
starting value, considering that the maximum value of Vmax is 8 mol/(m3*h) and the minimum
is 0 as reported by De Visscher & Van Cleemput [33].
Methane oxidation profiles
First it is important to notice that the methane loading rate of the column (described in the paragraph 2.2) is a high value in relation with the values used in literature (Tab. 3) in order to keep in lab-scale the operative conditions in small and/or old landfills (Abichou et al. [34] show
values of Vmax measured on different soils obtained from the available literature).
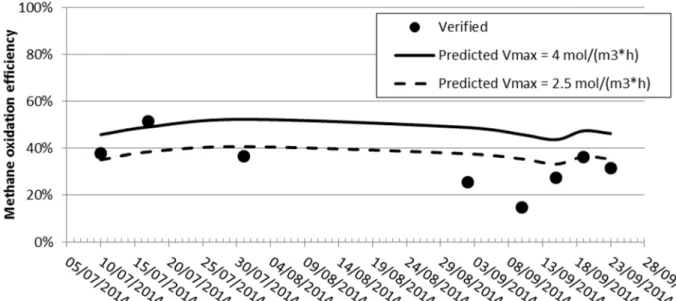
Figure 3 shows an overview of the results considering 8 samples. The lines represent the results predicted by the mathematical model while the points represent the results obtained experimentally in the column. In this way, considering the methane oxidation efficiency (defined in Hettiarachchi et al. [37]), it’s possible to note the comparison between the model
simulations and the column experiment. By using a Vmax value of 4 mol/(m3*h), the methane
oxidation was overestimated. As such, a value of 2.5 mol/(m3*h) was considered.
The continues line was determined using a Vmax value of 4 mol/(m3*h), the dotted line was
determined with a Vmax value of 2.5 mol/(m3*h). This parameter is the most influential
parameter in the model, as was indicated by a sensitivity analysis [26].
The graph shows that the correlation between the model and the experiment is better with a Vmax value of 2.5 mol/(m3*h). To evaluate numerically the goodness-of-fit between
11
(
)
2 , 2 2 , i m i i i i m i i y y y y TIC Σ + Σ − Σ =Where y represents the values predicted by the mathematical model and ym the value measured from the lab-column. If the value of the TIC is lower than 0.3 the correlation between the model and experiment data is good. In this case the calculation gave a TIC value of 0.14 for Vmax = 4 mol/(m3*h) and 0.08 for Vmax = 2.5 mol/(m3*h). Both the situations are acceptable
but the model simulation with Vmax = 2.5 mol/(m3*h) fits better.
From a theoretical point of view the use of a lower value of Vmax means that the biological activity is not so good as the prediction. The reasons could be the initial intermittent flow, the possibility that the moisture is not included in the correct range (10-20%), the probably not fully developed methanotrophic biomass and the high methane loading rate.
Conclusions
The aim of the work was the use of date from a lab-scale column for the calibration of a mathematical model. The results show that the methane oxidation in the column occurs with a methane oxidation efficiency comparable with literature values [20-31-32-39].
The methane oxidation, made by methanotrophic bacteria, is a biologic phenomenon: many environmental factors can occur, so it is very hard to find a perfect correspondence between the model prediction and the measured values. There is a difference between both values but the numeric value of the TIC suggests a good calibration of the model.
The next step will be the testing of the model with date from a full scale biofilter.
Acknowledgments
This work was made possible thanks to the collaboration between the University of Basilicata and the Gent University and it fits within the IWT-Tetra project FYBAR [140218] and the LED H2O project supported by Vlakwa.
12 References
[1] Forster, P.; Ramaswamy, V.; Artaxo, P.; Berntsen, T.; Fahey, D.W. Changes in atmospheric constituents and in radiative forcing. In Climate Change 2007: The Physical Science Basis. Contribution of Working Group I to the Fourth Assessment Report of the Intergovernmental Panel on Climate Change; Solomon, S.; Qin, D.; Manning, M.; Chen, Z.; Marquis, M.; Averyt, K.B.; Tignor, M.; Miller, H.L. Eds.; Cambridge University Press, Cambridge, 2007, UK and New York, NY, USA.
[2] IPCC. Summary for policymakers. In Climate Change 2007: The Physical Science Basis. Contribution of Working Group I to the Fourth Assessment Report of the Intergovernmental Panel on Climate Change; Solomon, S.; Qin, D.; Manning, M.; Chen, Z.; Marquis, M.; Averyt, K.B.; Tignor, M.; Miller, H.L. Eds.; Cambridge University Press, Cambridge, 2007, UK and New York, NY, USA.
[3] US-EPA, US Emission Inventory 2009. Inventory of U.S. Greenhouse gas emissions and sinks: 1990–2007. Public Review Draft, 2009.
http://www.epa.gov/climatechange/emissions/usinventoryreport.html. Accessed April 2009.
[4] EEA (European Environment Agency). Annual European Community Greenhouse Gas
Inventory 1990–2006 and Inventory Report 2008. Submission to the UNFCCC Secretariat. EEA Technical report, no. 6. 2008. ISSN 1725-2237.
http://www.eea.europa.eu/publications/technical_report_(2008_6). Accessed April 2009. [5] Bogner, J.; Abdelrafie Ahmed, M.; Diaz, C.; Faaij, A.; Gao, Q.; Hashimoto, S.; Mareckova,
K.; Pipatti, R.; Zhang., T. Waste management. In Climate Change: Mitigation Contribution of Working Group III to the Fourth Assessment Report of the Intergovernmental Panel on Climate Change; Metz, B.; Davidson, O.R.; Bosch, P.R.; Dave, R.; Meyer, L.A. Eds.; Cambridge University Press, Cambridge, United Kingdom and New York, NY, USA, 2007; 34 pp.
13 [6] Pnr Engineering Systems - Specialists in process instrumentation & heat exchanger services -
http://www.pnr-engineering.com.sg/wp-content/uploads/flare.pdf. Accessed April 2014. [7] Chanton, J.P.; Powelson, D.K.; Green, R.B. Methane oxidation in landfill cover soils; is a
10% default value reasonable? Journal of Environmental Quality 2009, 38, 654–63.
[8] Ng, C.W.W.; Feng, S.; Liu H.W. A fully coupled model for water-gas-heat reactive transport with methane oxidation in landfill covers. Science of the Total Environment 2015, 508, 307– 319.
[9] Abichou, T.; Mahieu, K.; Chanton, J.; Romdhane, M.; Mansouri, I. Scaling methane oxidation: from laboratory incubation experiments to landfill cover field conditions. Waste Management 2011, 31, 978–86.
[10] Scheutz, C.; Kjeldsen, P.; Bogner, J.E.; De Visscher, A.; Gebert, J.; Hilger, H. A.; Huber-Humer, M. ; Spokas, K. Microbial methane oxidation processes and technologies for mitigation of landfill gas emissions. Waste Management and Research 2009, 27, 409–455. [11] Börjesson, G.; Sundh, I.; Svensson, B. Microbial oxidation of CH4 at different temperatures in
landfill cover soils. FEMS Microbiology Ecology 2004, 48, 305-312.
[12] Du Plessis, C.A.; Strauss, J.M.; Sebapalo, E.M.T.; Riedel, K.-H.J. Empirical model for methane oxidation using a composted pine bark biofilter. Fuel 2003, 82, 1359–1365.
[13] De Visscher, A.; Schippers, M.; Van Cleemput, O. Short-term kinetic response of enhanced methane oxidation in landfill cover soils to environmental factors. Biology and Fertility of Soils 2001, 33, 231–237.
[14] Straka, F.; Crha, J.; Musilova, M.; Kuncarova, M. Biofilters on old landfills. In Proc. Sardinia 1999. Seventh International Waste Management and Landfill Symposium, 2, 507–516; Christensen, T.H.; Cossu, R.; Stegmann, R. Eds.; Seventh International Waste Management and Landfill Symposium, CISA; Cagliari, Italy, 1999.
[15] Streese, J.; Stegman, R. Microbial oxidation of CH4 from old landfills in biofilters. Waste
14 [16] Gebert, J.; Gröngröft, A. Performance of a passively vented field-scale biofilter for the
microbial oxidation of landfill methane. Waste Management 2006, 26, 399–407.
[17] Boeckx, P.; Van Cleemput O. Methane Oxidation in a Neutral Landfill Cover Soil: Influence of Moisture Content; Temperature; And Nitrogen-Turnover. Journal of Environmental Quality 1996, 25 (1).
[18] King, G.M.; Adamsen, A.P.S. Effects of Temperature on methane consumption in a forest soil and in a pure cultures of methanotroph Methylomonas rubra. Appl. Enviorn. Microb. 1992, 58, 2758-2763.
[19] Einola, J.K.M.; Kettunen, R.H. & Rintala, J.A. Responses of methane oxidation to temperature and water content in cover soil of a boreal landfill. Soil Biology and Biochemistry 2007, 39, 1156–1164.
[20] Park, S.; Brown, K.W.; Thomas, J.C. The effect of various environmental and design parameters on methane oxidation in a model biofilter. Waste Management and Research 2002, 20, 434–444.
[21] Bender, M.; Conrad, R. Effect of CH4 concentrations and soil conditions on the induction of
CH4 oxidation activity. Soil Biology and Biochemistry 1995, 27, 1517–1527.
[22] Whalen, S.C.; Reeburgh, W.S.; Sandbeck, K.A. Rapid methane oxidation in a landfill cover soil. Applied and Environmental Microbiology. Applied and Environmental Microbiology 1990, 56, 3405–3411.
[23] Park, S.; Lee, C.H.; Ryu, C.R.; Sung, K.J. Biofiltration for reducing methane emissions from modern sanitary landfills at the low methane generation stage. Water Air and Soil Pollution 2009, 196, 19–27.
[24] Hilger, H. A.; Cranford, D. F.; Barlaz, M. A. Methane oxidation and microbial exopolymer production in landfill cover soils.’ Soil Biol. Biochem. 1999, 32, 457–467.
[25] Wilshusen, J.H.; Hettiaratchi, J.P.A.; Stein, V.B. Long-term behaviour of passively aerated compost methanotrophic biofilter columns. Waste Management 2004, 24, 643–653.
15 [26] Amodeo, C.; Masi, S.; Van Hulle, S.W.H.; Caniani, D.; Mancini, I.M.; Zirpoli, P.; Methane oxidation in a biofilter (part 1): development of a mathematical model for designing and optimization. Journal of Environmental Science and Health, Part A (submitted).
[27] Haubrichs, R.; Widmann, R. Evaluation of aerated biofilter systems for microbial methane oxidation of poor landfill gas. Waste Management 2006; 26, 408–416.
[28] Park, J.; Shin, H. Surface emission of landfill gas from solid waste landfill. Atmospheric Environment 2001, 35, 3445–3451.
[29] Wang, J.; Xia, F.; Bai, Y.; Fang, C.; Shen, D.; He, R. Methane oxidation in landfill waste biocover soil: Kinetics and sensitivity to ambient conditions. Waste Management 2011, 31, 864-870.
[30] Amodeo, C. Sistemi bio-ossidativi per il controllo delle emissioni di metano da discarica controllata. PhD Thesis 2014 , 208 p.; Engineering School, Basilicata University (Italy). [31] De Visscher, A.; De Pourc, I.; Chanton, J. Isotope fraction effects by diffusion and methane
oxidation in ladfill cover soils. Journal of Geophysical Research 2004, 109.
[32] Stein, V.B.; Hettiaratchi, J.P.A.; Achari, G. Numerical model for biological oxidation and migration of methane in soils. Practice Periodical of Hazardous Toxic and Radioactive Waste Management 2001, 5, 225–234.
[33] De Visscher, A.; Van Cleemput, O. Simulation model for gas diffusion and methane oxidation in landfill cover soils. Waste Management 2003, 23, 581-599.
[34] Abichou, T.; Kormi, T.; Yuan, L.; Johnson, T.; Francisco, E. Modeling the effects of vegetation on methane oxidation and emissions through soil landfill final covers across different climates. Waste Management 2015, 36, 230-240.
[35] De Visscher, A.; Thomas, D.; Boeckx, P.; Van Cleemput, O. Methane oxidation in simultaed landfill cover soil environments. Environmental Science and Technology 1999, 33, 1854-1859.
16 [36] Mahieu, K. Modelling methane oxidation in landfill cover soils using stable isotope ratios. PhD thesis 2006, 123 p.; ISBN-number: 9789059891548; Faculty of Bioscience Engineering, Ghent University (Belgium).
[37] Hettiarachchi, V.C.; Hettiaratchi, J. P.; Mehrotra, A. K.; Kumar, S. Field-scale operation of methane biofiltration systems to mitigate point source methane emissions. Environmental pollution 2011, 159, 1715-1720.
[38] Audenaert, W.T.M., Callewaert, M., Nopens, I., Cromphout, J., Vanhoucke, R., Dumoulin, A., Dejans, P., Van Hulle, S.W.H. Full-scale modelling of an ozone reactor for drinking water treatment. Chemical Engineering Journal 2010, 157, 551–557.
[39] Hettiarachchi, V.C.; Hettiaratchi, J. P. A.; Mehrotra, A. K. Comprehensive One-Dimensional Mathematical Model for Heat; Gas; and Moisture Transport in Methane Biofilters. Practice Periodical of Hazardous; Toxic and Radioactive Waste Management 2007, 11 (4), 225-234.
17 FIGURE CAPTIONS
Figure 1. Schematic diagram of the experimental column
18 Figure 3. Methane oxidation efficiency measured in the column and predicted with the model
Table 1. Nominal operating conditions of the aerobic biofilter
Parameters Values UM Length 6.5 m Width 2.5 m Height 1.4 m Surface 16.25 m2 Volume 22.75 m3 Q 50 Nm3/h T 30 °C CTOT. 43.8 mol/m3 CH4 20 % CO2 20 % O2 21 %
19 Table 2. Parameters and influent conditions included in the model
Parameters Value Unit
Soil height 70 cm
Column diameter 7 cm
Oxidation surface 38.46 cm2
Column volume 2692.55 cm3
Max. oxidation rate Vmax 2,5-4 mol/(m3*h)
Influent Value Unit
Flow – Q 0.1 lpm Soil temperature – T variable °C
CH4 molar fraction 3 %
CO2 molar fraction 0 %
O2 molar fraction 20 %
N2 molar fraction 77 %
Table 3. Methane mass flow rate considered
Reference Value UM
De Visscher et al. [31] 12.5 mol / m2*d
Stein et al. [32] 19.7 mol / m2*d
Park et al. [20]
30 mol / m2*d
De Visscher et al. [35]
13.4 mol / m2*d
Mahieu et al. [36] 19.3 mol / m2*d