HAL Id: hal-00297091
https://hal.archives-ouvertes.fr/hal-00297091
Submitted on 9 Apr 2008
HAL is a multi-disciplinary open access
archive for the deposit and dissemination of
sci-entific research documents, whether they are
pub-lished or not. The documents may come from
teaching and research institutions in France or
abroad, or from public or private research centers.
L’archive ouverte pluridisciplinaire HAL, est
destinée au dépôt et à la diffusion de documents
scientifiques de niveau recherche, publiés ou non,
émanant des établissements d’enseignement et de
recherche français ou étrangers, des laboratoires
publics ou privés.
Mesoscale convective systems in Spain: instability
conditions and moisture sources involved
S. Queralt, E. Hernandez, D. Gallego, P. Lorente
To cite this version:
S. Queralt, E. Hernandez, D. Gallego, P. Lorente. Mesoscale convective systems in Spain: instability
conditions and moisture sources involved. Advances in Geosciences, European Geosciences Union,
2008, 16, pp.81-88. �hal-00297091�
www.adv-geosci.net/16/81/2008/
© Author(s) 2008. This work is distributed under the Creative Commons Attribution 3.0 License.
Advances in
Geosciences
Mesoscale convective systems in Spain: instability conditions and
moisture sources involved
S. Queralt1, E. Hernandez1, D. Gallego2, and P. Lorente1
1Universidad Complutense de Madrid, Madrid, Spain 2Universidad Pablo de Olavide, Sevilla, Spain
Received: 1 August 2007 – Revised: 17 December 2007 – Accepted: 18 February 2008 – Published: 9 April 2008
Abstract. Source-receptor water vapor content areas are analyzed for a particular case of deep mesoscale convec-tive system (MCS) developed over the Mediterranean mar-gin of Spain in October 1982. The aim of this work is to study simultaneously the atmospheric instability conditions and water vapour fluxes which finally resulted in very se-vere precipitation rates, reaching up to 600 mm in a single day. Humidity amounts and transport are quantified along the trajectories computed from a lagrangian particle simu-lation model (FLEXPART6.2). To evaluate the precipita-tion probability, the water vapor content and both thermo-dynamic and thermo-dynamic atmospheric instability components were assessed. The October 1982 Iberian MCS occurred as a consequence of a deep cutoff low detected between 500 and 200 hPa levels. The dynamical instability was measured through potential vorticity anomalies and Q vector diver-gence, which presented their maximum and minimum cen-ters respectively over south-eastern Iberia. Synoptic and dy-namic instability conditions were obtained from the ERA-40 reanalysis dataset. It is observed that during this severe weather episode, the specific humidity increased along the lowest and easternmost trajectories, which are mainly spread over the Mediterranean Sea.
1 Introduction
Severe convection events are especially intense over the west Mediterranean Sea basin. In particular, eastern Spain is char-acterized by frequent events of torrential rainfalls. Histori-cally, special interest has been focused on understanding the Mesoscale Convective Systems (MCSs) due to the important damages and fatalities involved in these episodes.
Correspondence to: S. Queralt
(queralt@fis.ucm.es)
Several Iberian MCSs case studies have been largely de-scribed (Romero et al., 2000) revealing that convective en-vironment was mainly the result of low level advection of warm and moist air from the Mediterranean Sea to the Span-ish coast. Recently, Garcia-Herrera et al. (2005) developed a general MSCs climatology. They found that moisture charg-ing is specially intense durcharg-ing the fall season. However, the available humidity content was difficult to determine.
A strong MCS was developed during October 1982 over eastern Spain and it was especially strengthened over the city of Tous (Fig. 1). After three days of heavy rainfall, Ju-car river overflowed and Tous dam collapsed on 20 Octo-ber 1982. The flood caused important damages and casual-ties. The objective of this paper is to characterize the insta-bility conditions and synoptic context leading to this MCS by using a lagrangian particle simulation model (Stohl et al., 2004, 2005).
In the following section, the dataset used in this study is presented. In the third section, some synoptic features of the MSC are described, instability indices are evaluated and a backward trajectory characterization is performed. Fourth section summarises the most relevant conclusions.
2 Data set and methodology
Several databases have been used in this study: 2.1 Radiosondes
Daily radiosondes (00:00 and 12:00 UTC) from the Inte-grated Global Radiosonde Archive have been used. Ra-diosoundings from Palma de Mallorca station (Fig. 1) have been evaluated in order to determine thermodynamic insta-bility indices from 18 to 23 October. Instainsta-bility data were compared with daily rainfall observations. CAPE, LI, TT, KI, SI and SWEAT are analyzed in order to characterize the thermodynamic instability.
82 S. Queralt: Mesoscale Convective Systems in Spain
Fig. 1. Iberian Peninsula; Tous location inside the box.
2.2 ERA-40 Reanalysis
The synoptic situations and dynamic instability have been characterized by using the ERA-40 reanalysis (horizontal and vertical velocity components, temperature and geopo-tential height) over an area extending from 15◦N to 70◦N and 25◦W to 25◦E, with 0.5◦×0.5◦spatial resolution. Dy-namic instability has been evaluated through Potential Vor-ticity (PV) anomalies and Q vector divergence (dQ). PV anomalies were obtained substracting the monthly mean value. PV anomalies at 330 K isentropic surface were per-formed. PV cross sections (between 850 and 100 hPa) were also analyzed in order to evaluate the foldings of the dy-namical tropopause (DT), defined by the usual threshold of 2 Potential Vorticity Units (PVU) (Hoskins et al., 1985), (1 PVU=10−6Km2s−1kg−1)and the potential exchanges
be-tween the stratosphere (S) and the troposphere (T). It is well known that most of the characteristics of a MCS as cut-off lows, tropopause foldings and thunderstorms have been iden-tified as dynamical structures associated with Stratosphere-Troposphere exchange (Sprenger, 2007).
Both dQ at 850 hPa (dQ850) and 500 hPa (dQ500) (kPa m−2s−1) at 00:00 UTC and 12:00 UTC have been computed as follows (Hoskins et al., 1978):
∇2+f 2 σ ∂2 ∂p2 ! ω = −2 σ∇ ·Q (1)
where, f is the Coriolis parameter, ω (x, y, p, t ) is the verti-cal velocity and σ is the stability parameter.
Reanalysis data were also used to characterize the location of the jet stream following the method developed by Gallego et al. (2005) which is based on the geostrophic wind at 200 hPa.
Table 1. The ten classes of CWTs (Trigo et al., 2000) and associated
humidity transport in Iberia.
CWTs Symbol Associated flux in Iberia Anticyclonic type A Variable
Cyclonic type C Wet Northeasterly type NE Dry Easterly type E Dry Southeasterly type SE Dry Southerly type S Dry Southwesterly type SW Wet Westerly type W Wet Northwesterly type NW Variable Northerly type N Variable
2.3 Back-trajectories from the FLEXPART model
The model FLEXPART6.2 (James et al., 2004; Stohl et al., 2004, 2005) was run in order to examine the available hu-midity sources of the air masses involved in the Iberian MCS episode. One million particles were launched by the disper-sion model in backward mode. Back-trajectories and mois-ture content evolution were computed in 3-h steps.
2.4 Atmospheric circulation weather types
Atmospheric circulation patterns involved in the Tous MCS study case were evaluated with the Circulation Weather Types (CWTs) classification scheme developed by Trigo et al. (2000) and Paredes et al. (2006) for the Iberian Peninsula. These patterns give a first insight about the dominant atmo-spheric flow regime and the expected moisture transport.
3 Results
3.1 Synoptic environmental features 3.1.1 Low level
The Iberian CWTs are characterized by a set of indices as-sociated with the direction and vorticy of geostrophic flow. They are based on the composites of the sea level pressure (Trigo et al., 2000). This daily circulation scheme allows to define ten different types of patterns with a characteristic SLP field and to approach the humidity content fluxes (Ta-ble 1) for the Iberian Peninsula. As it is shown in Ta(Ta-ble 2, the central days of Tous MCS development (19 to 21 Octo-ber) are characterized by a transition from Anticyclonic to Cyclonic regime.
Geopotential height at 1000 hPa (not shown) has also been evaluated in order to verify the CWTs and to examine the low level structures present during the Tous MCS.
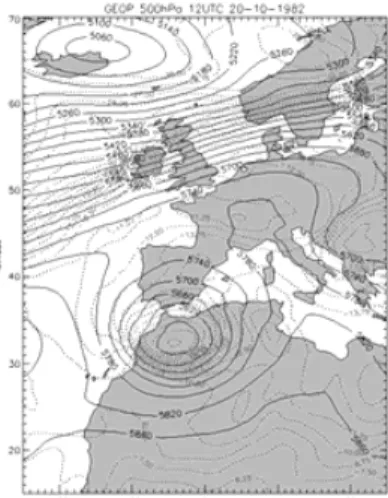
Fig. 2. Geopotential height at 500 hPa (solid lines) and temperature (dotted lines) for 18 to 23 October 1982.
3.1.2 Middle-High levels
The October 1982 Iberian MCS occurred jointly with a 4-day persistent cut-off low detected at mid-upper levels (be-tween 500–200 hPa), and identified from an objective algo-rithm (Nieto et al., 2005). As it is shown in Fig. 2, tempera-ture in the cut-off center was lower than –22◦C.
Geopotential heights at 200 hPa (not shown) have also been analyzed to assess the upper troposphere. Between 18 and 23 October, the geopotential configuration at both 500 hPa and 200 hPa levels was essentially the same. By 18 October, an intense Iberia-centred trough was develop-ing a deep cut-off low in Southern Iberia and Northern Mo-rocco (Fig. 2). This structure persisted during the following four days (19 to 22 October, inclusive) and it was recognized simulaneously at 500 hPa and 200 hPa. After 23 October, the cut-off low got dissipated and it was followed by a new trough.
Table 2. CWTs associated with Tous MCS.
Day/Time CWTs 18 00:00 UTC NW 18 12:00 UTC N 19 00:00 UTC A-N 19 12:00 UTC A-NE 20 00:00 UTC A 20 12:00 UTC NE 21 00:00 UTC C-N 21 12:00 UTC C-N 22 00:00 UTC N 22 12:00 UTC NW 23 00:00 UTC A-NW 23 12:00 UTC A
84 S. Queralt: Mesoscale Convective Systems in Spain
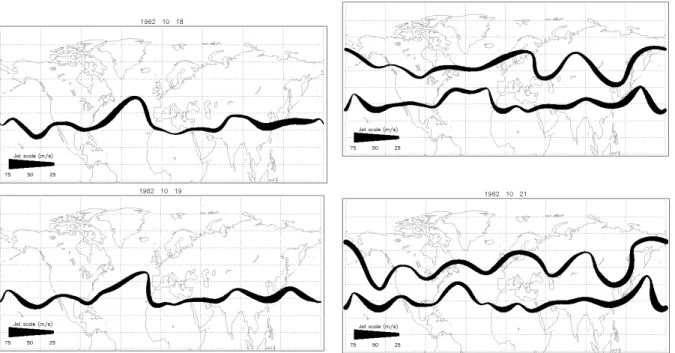
Fig. 3. Jet position for 18 to 21 October 1982.
3.1.3 Jet stream positions
Subtropical jet stream is found to be deeply perturbed for 18 and 19 October 1982 close to the Iberian Peninsula, as it is shown in Fig. 3. The subtropical jet tends to be smoother in the following days. The highest perturbation on 19 October is in good agreement with the geopotential field (Fig. 2) and the PV anomalies (Fig. 4). The geopotential field for 19 Oc-tober shows a cut-off low in rapid development in accordance with the maxima positive PV anomaly (stratospheric air in-strusion) (Lamarque et al., 1994).
The Polar jet position is not available until 20 October, since the highest velocity of the geostrophic flow could not properly be defined. Rossby wave propagation could be pre-vented or broken on the previous days, while from 20 Octo-ber onwards, the polar jet position is available and seems not to be affecting the MCS.
4 Dynamic and thermodynamic instability conditions
4.1 Thermodynamic instability
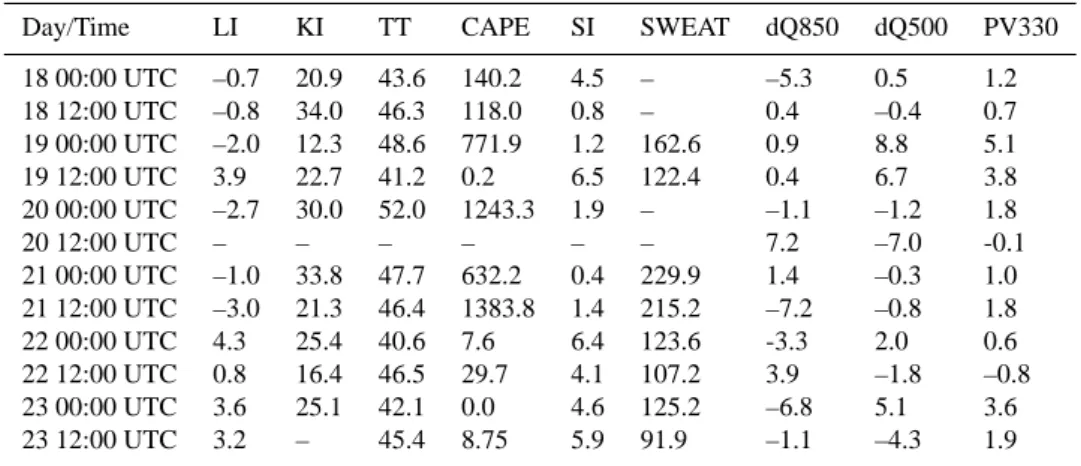
Thermodynamic instability indices were provided by the Palma de Mallorca radiosounding station. Among others, Convective Available Potential Energy (CAPE), Lifted Index (LI), K-Index (KI), Total Totals (TT), Showalter Index (SI) and Severe Weather Threat Index (SWEAT) were analyzed, in order to evaluate the degree of thermal atmospheric insta-bility associated with the Iberian MCS (Table 3). CAPE is in J/kg; LI, TT, KI, SWEAT, and SI are dimensionless.
In-stability thresholds are: CAPE>1000 J/kg, LI<0, TT>44, KI>25, SWEAT>200, SI<4.
The results showed that the greater part of the thermody-namic indices exceeded its 90% percentile during the Iberian MCS of October 1982. On 20 October, instability is so ex-cessive that indices cannot be computed.
4.2 Dynamic instability
Q vector divergence at 500 and 850 hPa and PV anomaly at 330 K isentropic surface (Table 3) shows large anomalies over Tous during the heavy rainfall episode. Positive val-ues of dQ (divergence) indicate air mass subsidence, while negative values (convergence) represent upward movements. Maximum convective instability (CAPE and LI, or instance) occurred at 00:00 UTC 21 October and 12:00 UTC 21 Oc-tober which are also characterized by strong convergence at both levels (negative values for dQ500 and dQ850). At 12:00 UTC 20 October, the highest negative dQ500 value is found, indicating ascending air at the 500 hPa level. This strong rising or air is accompanied by PV negative anomaly, hence the DT movement towards higher levels made the air lifting possible.
Regarding PV, positive anomalies above 2 PVU are con-sidered as stratospheric air intrusions and therefore, an indi-cation of high dynamic instability. The maximum positive PV anomalies of 19 October are in agreement with the high value of positive dQ at both levels. In addition, PV anomalies were performed in horizontal fields and vertical cross sec-tions (Fig. 4). On 19 October, a tropopause folding was de-veloped, as DT reached a pressure level lower than 500 hPa
Fig. 4. Top: PV vertical cross section (thick solid line indicates Dynamical Tropopause) at Tous latitude (39◦N) for 18 October (left) and 20 October (right), 1982. Bottom: 330 K isentropic PV anomaly for the same days, thick solid line indicates where PV anomaly is zero, solid lines show positive anomalies and dotted lines show negative anomalies.
Table 3. Thermodynamic and dynamic indices related to Tous MCS. Bold fonts indicate that the instability threshold is exceeded.
Day/Time LI KI TT CAPE SI SWEAT dQ850 dQ500 PV330 18 00:00 UTC –0.7 20.9 43.6 140.2 4.5 – –5.3 0.5 1.2 18 12:00 UTC –0.8 34.0 46.3 118.0 0.8 – 0.4 –0.4 0.7 19 00:00 UTC –2.0 12.3 48.6 771.9 1.2 162.6 0.9 8.8 5.1 19 12:00 UTC 3.9 22.7 41.2 0.2 6.5 122.4 0.4 6.7 3.8 20 00:00 UTC –2.7 30.0 52.0 1243.3 1.9 – –1.1 –1.2 1.8 20 12:00 UTC – – – – – – 7.2 –7.0 -0.1 21 00:00 UTC –1.0 33.8 47.7 632.2 0.4 229.9 1.4 –0.3 1.0 21 12:00 UTC –3.0 21.3 46.4 1383.8 1.4 215.2 –7.2 –0.8 1.8 22 00:00 UTC 4.3 25.4 40.6 7.6 6.4 123.6 -3.3 2.0 0.6 22 12:00 UTC 0.8 16.4 46.5 29.7 4.1 107.2 3.9 –1.8 –0.8 23 00:00 UTC 3.6 25.1 42.1 0.0 4.6 125.2 –6.8 5.1 3.6 23 12:00 UTC 3.2 – 45.4 8.75 5.9 91.9 –1.1 –4.3 1.9
over Iberian longitudes (–9◦W to 0◦E). On 20 October, DT
moved into upper levels, and PV anomalies were up to nega-tive values.
Maximum subpolar jet stream perturbations occurred si-multaneously to the DT folding. In accordance with the jet stream restoration into non-disturbed state, PV anomalies re-cover the usual tropospheric values (underneath 2 PVU).
5 Backward trajectories
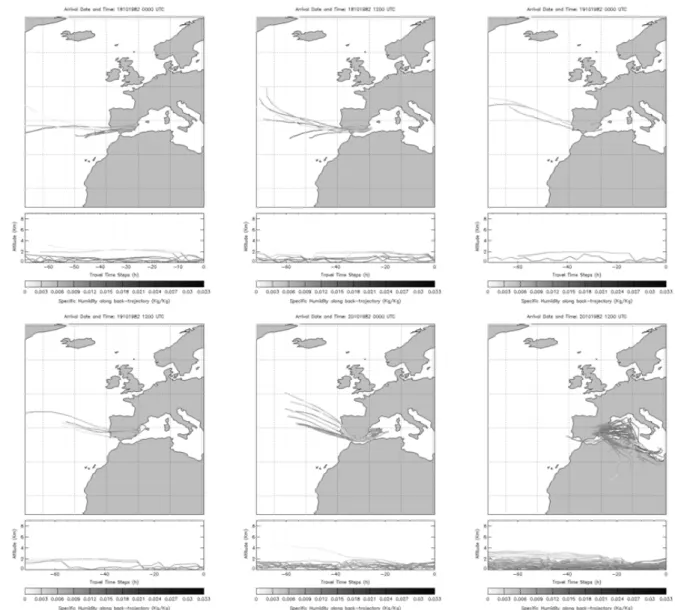
The atmospheric particles over eastern Iberia, between 15 and 25 October, with specific humidity (at the moment they arrive in Tous) greater than 0.0075 kg/kg were selected to perform 72-h backward trajectories, tracking the moisture changes along the paths (Figs. 5 and 6).
In Figs. 5 and 6 dry (light grey) and wet (dark grey) at-mospheric particles arriving in eastern Iberia on 18 October (00:00 and 12:00 UTC) show western paths, slightly turn-ing to northwest trajectory components on 19 and 20 Octo-ber. Under this atmospheric flux, the intense precipitations
start to increase the Jucar river flow (close to Tous). In the course of 20 October, trajectories exhibit a rapid change into southeast and east components, coming from northern Africa and the eastern Mediterranean Sea, respectively. Dry (higher heights) and wet (lower heights) particle trajectories show similar signatures. Dry particles get large amounts of water along their trajectories, due to available humidity sources, even as far as the Nile basin in Northern Africa. Dry par-ticles became wet at the arrival time. The Jucar river flow keeps increasing, reaching dangerous levels.
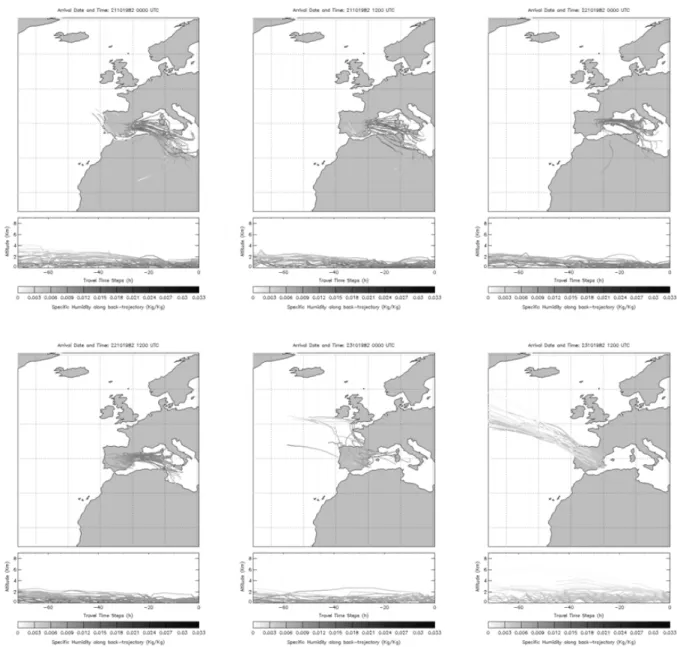
Dry and wet particle trajectories start to diverge during 21 October. Low-level particles spread over Mediterranean Sea, with a component coupled to the current cyclonic CWT, bringing humidity towards eastern Iberian coast. At higher levels, particles with a nortwest and cyclonic component carry low moisture amounts. Trajectories describe a shear-like vertical profile, where the highest and driest particles show a western component and the lowest and wettest par-ticles exhibit eastern origin. This vertical behaviour implies strong stratiform instability.
86 S. Queralt: Mesoscale Convective Systems in Spain
Fig. 5. 72-h backward trajectories of wet (dark grey) and dry (light grey) particles involved in Tous MCS which arrive in eastern Iberia at
00:00 and 12:00 UTC of 18, 19 and 20 October. Specific humidity at the arrival time is higher than 0.0075 kg/kg.
The persistent rainfall episode causes the Jucar river over-flow, and the dam of Tous collapses at 19:15 UTC.
Air particles still transport large amounts of humidity to the eastern Iberia during 22 October. However, moisture content and number of particles involved decrease as the cut-off low starts to disappear. Most of 00:00 UTC 22 Octo-ber wet trajectories maintain a pure east component, while at 12:00 UTC trajectories show a twisted component at the last part of their paths towards eastern Iberia. On 23 October, the cut-off low was over and only dry particles arrived at east-ern Iberia, coming from northwest, thus, restoring the stable conditions.
6 Conclusions
Instability conditions and backward trajectories of the 20 Oc-tober 1982 Iberian MCS, were analyzed in order to assess the evolution of the dynamic and thermodynamic structures which led to the intense rainfall episode.
Instability components showed large instable conditions consistent with the synoptic situation and the observed pre-cipitation rates. Middle to upper level unstable structures can be explained by the DT behavior and low level structures are in good agreement with CWTs and wet atmospheric parti-cles paths. The evolution of upper level dynamic structures (jet stream, cut-off low, DT folds) affected the local low level circulation patterns.
Fig. 6. As in Fig. 5, but for 21, 22 and 23 October.
On 19 October, a DT folding (derived from the upper level cut-off low) was detected as a large PV anomaly over Tous region. These positive PV anomalies occurred together with positive dQ values at both 500 hPa and 850 hPa levels, thus, downward air movements occurred. DT foldings injected stratospheric air into the troposphere, bringing strong ther-mal instability and anticyclonic circulation at lower levels. On 20 October, DT showed a rebound effect rising higher levels. This DT movement towards higher levels on 20 and 21 October occurred together with dQ negative values, and partially explain the development of the convective system over Tous. Static instability indices on 20 October showed an atmospheric thermal inversion accordingly with the se-vere convective system development. At lower levels, during
20 and 21 October, CWTs turned to cyclonic circulation. Al-though the DT bending was still present on 22 October, mass convergence weakened as the cut-off low and the MCS did.
As a consequence of the upper level structures shift, lower levels exhibited a rapid transition from Anticyclonic to Cy-clonic CWT regimes which led to a shear-like vertical profile. As a result, instability conditions were reinforced as the ther-modynamic indices and backward trajectories have shown.
Back-trajectories provide a detailed and new perspective for the analysis of MCSs. The assessment of humidity sources origin and the evaluation of the different air mass trajectories allow a better understanding of hazard rainfall episodes and provide a powerful tool for forecasting and warning against potential damages.
88 S. Queralt: Mesoscale Convective Systems in Spain
Acknowledgements. The authors wish to thank U.C.M. and M.E.C for the grant and contract respectively, associated to CG04-05187-CO3-01/CLI project. Special thanks to S. C. Michaelides for all the useful comments and helpfulness.
Edited by: S. C. Michaelides
Reviewed by: two anonymous referees
References
Gallego, D., Ribera, P., Garc´ıa-Herrera, R., Hern´andez, E., and Gi-meno, L.: A new look for the Southern Hemisphere jet stream, Clim. Dynam., 24, 607–621, 2005.
Garc´ıa-Herrera, R., Hern´andez, E., Paredes, D., Barriopedro, D., Correoso, J. F., and Prieto, L.: A MASCOTTE-based character-ization of MCSs over Spain, 2000–2002, Atmos. Res., 73, 261– 282, 2005.
Garc´ıa-Herrera, R., Barriopedro, D., Hern´andez D., Paredes, D., Correoso, J. F., and Prieto, L.: The 2001 Mesoscale Convec-tive Systems over Iberia and Balearic Islands, Meteorol. Atmos. Phys., 90, 225–243, 2005.
Hoskins, B. J., Draghici, I., and Davies, H. C.: A new look at the ω equation, Quart. J. R. Meteorol. Soc., 104, 31–38, 1978. Hoskins, B. J., McIntyre, M. E., and Robertson, A. W.: On the use
and significance of isentropic potential vorticity maps, Quart. J. R. Meteorol. Soc., 111, 877–946, 1985.
James, P., Stohl, A., Spichtinger, N., Eckhardt, S., and Foster, C.: Climatological aspects of the extreme European rainfall of Au-gust 2002 and a trajectory method for estimating the associated evaporative source regions. Nat. Hazards Earth Syst. Sci., 4, 733– 746, 2004,
http://www.nat-hazards-earth-syst-sci.net/4/733/2004/.
Lamarque, J. F. and Hess, P. G.: Cross-Tropopause Mass Exchange and Potential Vorticity Budget in a Simulated Tropopause Fold-ing, J. Atmos. Sci., 51(15), 2246–2269, 1994.
Nieto, R., Gimeno, L., de la Torre, L., Ribera, P., Gallego, D., Garc´ıa-Herrera, R., Garc´ıa, J. A., N´u˜nez, M., Reda˜no A., and Lorente, J.: Climatological features of Cut-off Low Systems in the Northern Hemisphere, J. Climate, 18, 3085–3103, 2005. Paredes, D., Trigo, R. M., Garcia-Herrera, R., and Franco, I.:
Understanding Precipitation Changes in Iberia in Early Spring: Weather Typing and Store-Tracking Approaches, J. Hydromete-orol., 7, 101–113, 2006.
Romero, R., Doswell, C. A., and Ramis, C.: Mesoscale Numeri-cal Study of Two Cases of Long-Lived Quasi-Stationary Con-vective Systems over Eastern Spain, Mon. Weather Rev., 128, 3731–3750, 2000.
Sprenger, M., Wernli, H., and Bourqui, M.: Stratosphere-Troposphere Exchange and its Relation to Potential Vorticity Streamers and Cutoffs near the Extratropical Tropopause, J. At-mos. Res., 64, 1587–1602, 2007.
Stohl A. and James, P.: A Lagrangian Analysis of the Atmospheric Branch of the Global Water Cycle, Part I: Method Description, Validation, and Demonstration for the August 2002 Flooding in Central Europe, J. Hydrometeorol., 5(4), 656–678, 2004. Stohl A. and James, P.: A Lagrangian Analysis of the Atmospheric
Branch of the Global Water Cycle, Part II: Moisture Transports between Earth’s Ocean Basins and River Catchments, J. Hy-drometeorol., 6(6), 961–984, 2005.
Trigo, R. M. and DaCamara, C.: Circulation Weather Types and their Influence on the Precipitation Regime in Portugal, Int. J. Climatol., 20, 1559–1581, 2000.