K A. .6-M, X R" A QlA CA S .. ... .... v. 1w: Jv, .... .. ... ... .. ... K% ..N:.. ... VA ez A A.w n!:e .... . ... A t .. ... ; %K n .. ... . AW 0. W, Fk N 0. ?
Economic Predictions for Heat Mining:
A Review and Analysis of Hot Dry Rock (HDR)
Geothermal Energy Technology
Jefferson W. Tester and Howard J. Herzog
Energy Laboratory
Massachusetts Institute of Technology
Cambridge, Massachusetts 02139
Final Report
for the
U.S. Department of Energy
Geothermal Technology Division
MIT-EL 90-001
Acknowledgement
The authors would like to express their appreciation to those individuals who
provided important data and comments. Although it would be impossible to name
them all, J.N. Albright, H.C.H. Armstead, A.S. Batchelor, D.W. Brown, F. Cochrane,
R.E. Cummings, D. Duchane, R.B. Duffield, J. Dunn, D. Entingh, S. Fleming, R.
Grieder, C.O. Grigsby, R. Hendron, A. Jelacic, J.E. Livesay, J.E. Mock, G. Morris,
H.D. Murphy, C.W. Myers, R. Nicholson, J. Owen, R.M. Potter, J.E. Rannels, F.
Roach, B.A. Robinson, I. Smith, M.C. Smith, C. Tosaya, R. Traeger, and J. Whetten
were especially helpful. J. Hale is gratefully acknowledged for her help in preparing
the report. The Geothermal Technology Division of the U.S. Department of Energy,
Sandia National Laboratories and the MIT Energy Laboratory provided partial
support for this project. The views and opinions presented in this report are solely
those of the authors, and as such, do not necessarily reflect an endorsement by the
U.S. Government, its agencies or laboratories.
Economic Predictions for Heat Mining:
A Review and Analysis of Hot Dry Rock (HDR) Geothermal Energy Technology
Table of Contents
Page
1. Objectives and Scope
1
2. HDR Resource Quality and Drilling
3
3. HDR Reservoir Formation
16
4. HDR Reservoir Performance Criteria
26
5.
HDR Reservoir Performance Modeling
28
6. HDR Power Plant Options
33
7. Comparison of HDR Economic Model Predictions
40
8. Composite HDR Model Predictions
58
9. Generalized HDR Economic Model for Electricity Production
66
10. Sensitivity and Uncertainty Analysis
72
11. The MIT HDR Economic Model for Direct Thermal Use
77
12. Economic Projections for HDR in the U.S. by Region
82
13. Recommended Research and Development for HDR Technology
87
14. References
89
15. Appendices
A. Detailed MIT HDR Economic Model Results
A.1 Electricity Generation
94
A.2 Sensitivity and Uncertainty Analysis
132
A.3 Direct Thermal Use
136
B. Distribution of Geothermal Gradients by Region
B.1 Distribution of Geothermal Gradients by State
176
B.2 Potential HDR Electricity Production by Class
179
B.3 HDR Electricity Cost by Class and Technology Level
180
1. Objectives and Scope
The HDR geothermal energy resource is associated with accessible regions of hot
rock beneath the earth's surface that do not contain sufficient natural porosity or
permeability. Energy can be extracted by creating artificial permeability using
hydraulic stimulation techniques to propagate and open joints or fractures. The
resulting fracture network is connected to a set of injection and production wells
where heat is removed by circulating water under pressure from the surface, down
one well, through the fractured zone, and up a second well. Electricity and/or
process steam would then be generated using the heated water in an appropriately
designed power plant. This heat mining concept is closed-loop on the geothermal
side so there are no effluents, thus minimizing the environmental impact of the HDR
"fuel cycle" to site preparation, well drilling, and other land use issues.
Because HDR systems do not require natural, indigenous hot fluids and high
permeability, the HDR resource itself can be defined by the accessible thermal
energy in the earth's crust above some minimum temperature level. Thus the size of
the HDR resource is very large and more widely distributed than natural geothermal
systems. For example, in the U.S., to a 10 km depth assuming an average geothermal
temperature gradient of 25
0C/km and a minimum initial rock temperature of 150'C,
the amount of thermal energy in place is about 10 million quads' (Tester, Brown,
and Potter (1989)). Worldwide the HDR resource base is estimated at over 100
million quads (Armstead and Tester (1987)). Based on the enormous size and
ubiquitous distribution of the resource and its positive environmental characteristics,
HDR could provide an acceptable alternative to the fossil and nuclear options for
meeting a substantial fraction of worldwide electric power and space and process heat
demand.
The main objectives of this study were first, to review and analyze several
economic assessments of Hot Dry Rock (HDR) geothermal energy systems, and
second, to reformulate an economic model for HDR with revised cost components.
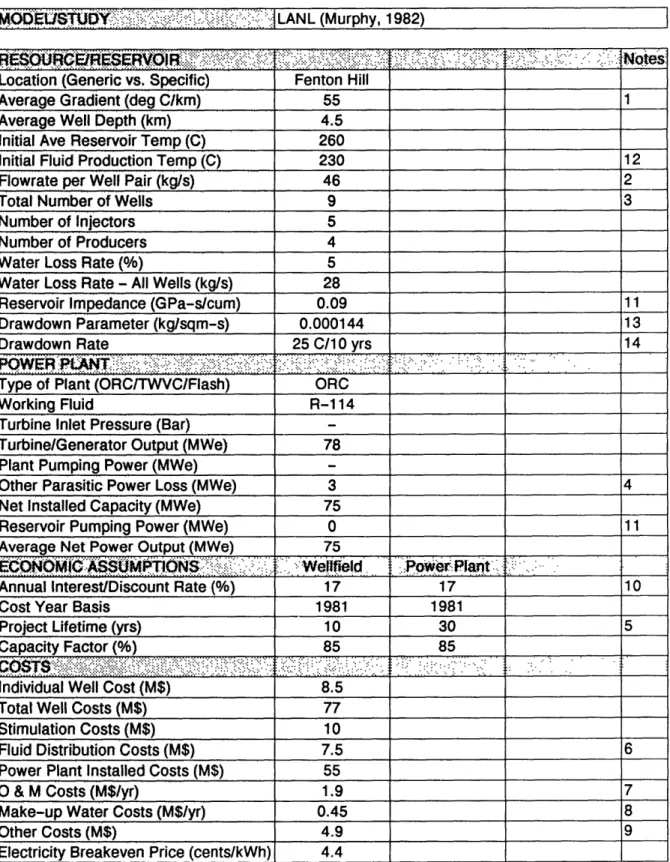
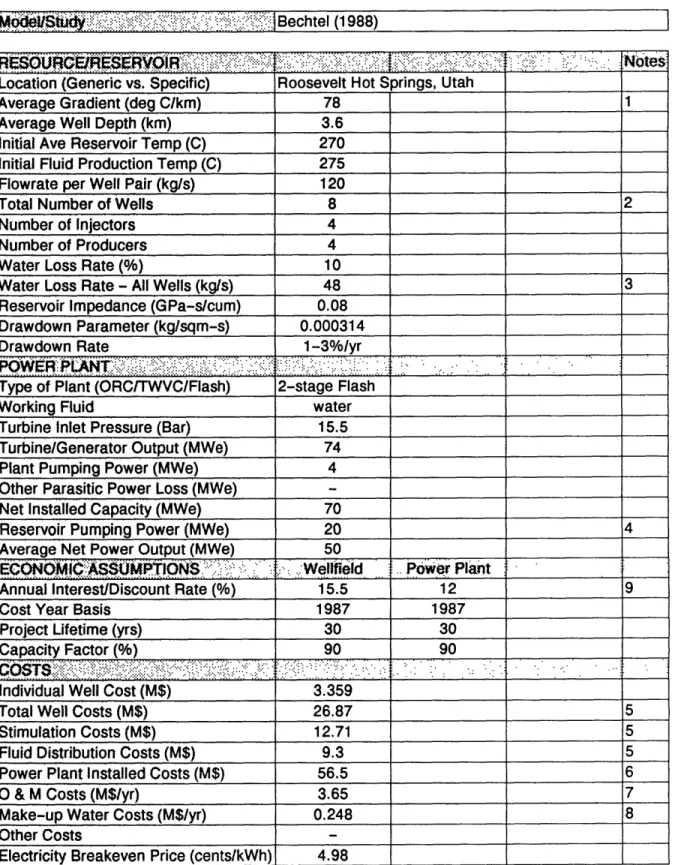
The economic models reviewed include the following studies sponsored by:
1. Electric Power Research Institute (EPRI)--Cummings and Morris (1979)
2. Los Alamos National Laboratory (LANL)--Murphy, et al. (1982)
3. United Kingdom (UK)--Shock (1986)
4. Japan--Hori, et al. (1986)
11 quad
=
101'
BTU
=
1.055
x 1018J -
180 million barrels of oil equivalent
5.
Meridian--Entingh (1987)
6. Bechtel (1988)
A general evaluation of the technical feasibility of HDR technology components
was also conducted in view of their importance in establishing drilling and reservoir
performance parameters required for any economic assessment (see Sections
2-5).
In
our review, only economic projections for base load electricity produced from HDR
systems were considered. Bases of 1989 dollars
($)
were selected to normalize costs.
Following the evaluation of drilling and reservoir performance, power plant
choices and cost estimates are discussed in Section 6. In Section 7, the six economic
studies cited earlier are reviewed and compared in terms of their key resource,
reservoir and plant performance, and cost assumptions. Based on these comparisons,
we have estimated parameters for three composite cases. Important parameters
include: (1) resource quality--average geothermal gradient (oC/km) and well depth, (2)
reservoir performance--effective productivity, flow impedance, and lifetime (thermal
drawdown rate), (3) cost components--drilling, reservoir formation, and power plant
costs and (4) economic factors--discount and interest rates, taxes, etc. In Section 8,
composite case conditions were used to reassess economic projections for
HDR-produced electricity. In Section 9, a generalized economic model for HDR-HDR-produced
electricity is presented to show the effects of resource grade, reservoir performance
parameters, and other important factors on projected costs. A sensitivity and
uncertainty analysis using this model is given in Section 10. Section 11 treats a
modification of the economic model for predicting costs for direct, non-electric
applications. HDR economic projections for the U.S. are broken down by region in
Section 12. In Section 13, we provide recommendations for continued research and
development to reduce technical and economic uncertainties relevant to the
2. HDR Resource Quality and Drilling
The development of the HDR resource at a particular location depends largely
on being able to gain access to high rock temperatures which will lead to acceptable
fluid temperatures for generating electric power. Although some exploration for
locating high quality HDR resources is required, the difficulty and costs associated
with locating a suitable HDR site are far less than for hydrothermal or fossil fuel
resource development. In fact, the more or less ubiquitous nature of the HDR
resource suggests that its grade in terms of average geothermal gradient will be the
single key factor influencing the "commercial-quality" of a particular site. In Heat
Mining, Armstead and Tester (1987) subdivide the grade of HDR resources in the
U.S. into two categories, thermal with above average gradients >38
0C/km and
non-thermal with gradients of about 20 to 25
0C/km. About 16% of the land area in the
U.S. can be categorized as a thermal area with a significant fraction existing in
hyperthermal regions near or within active hydrothermal systems. A typical range for
average gradients in such hyperthermal systems would be from 60 to 80
0C/km.
Fenton Hill, NM and Roosevelt Hot Springs, UT fall into this latter category.
Therefore, in order to evaluate a range of HDR grades, economic studies
frequently examine several gradients or try to parameterize the effect of gradient on
costs. Milora and Tester (1976) were the first to do this for generic HDR resources.
Their estimates were later updated by Cummings and Morris (1979), Tester (1982),
and Armstead and Tester (1987). In other studies, for example, Murphy et al. (1982),
Japan (1986), and Bechtel (1988), specific sites were selected to establish resource
parameters.
In establishing HDR economic feasibility requirements in this study, we examined
a range of gradients within three separate HDR resource grades:
1. High (with high gradients <VT>
=
80
0C/km)
2. Mid (with above normal gradients <VT> = 50oC/km)
3. Low (with near-normal gradients <VT> = 30oC/km)
The next set of issues has to do with estimating costs for drilling and completing
wells to gain access to the HDR resource. Although HDR reservoir temperatures
are selected as a design choice, an acceptable range can easily be bracketed for
electric power applications. In any situation, one balances the cost of producing the
fluid against the cost of converting its thermal energy into electric power. Effectively,
this is equivalent to balancing drilling costs against power plant capital costs to reach
a minimal total cost corresponding to optimal design temperature or reservoir depth
for a particular HDR site. These effects are illustrated in Figure 2.1. Using the
dashed line for reference, one can see that reservoir design temperature range from
about 140
0C for low gradient areas (20oC/km) to about 250
0C or more for high
gradient areas (> 80°C/km) with a fairly flat minimum. Strictly speaking, the actual
values of these reservoir design temperature optima depend on the capital costs and
system performance assumptions used. (These points are revisited again in Section
9).
Thus, although no absolute quantitative conclusion can be made at this time, a
reasonable range for optimal drilling depths for HDR electric power systems can be
specified for each resource grade based on earlier studies as shown in Table 2.1 (see
Armstead and Tester (1987) Ch. 14 and Tester (1982)):
TABLE 2.1 ESTIMATED OPTIMAL TEMPERATURES AND DEPTHS
FOR HDR RESOURCES
HDR resource grade
VT
oC/kmOptimal
depth
range
Optimal initial
reservoir temperature
range
km
1. High (high gradient)
2. Mid (above-normal
gradient)
3. Low (near-normal
gradient)
2.9-3.6
3.1-4.5
4.2-6.5
250-300
170-240
140-210
an average ambient surface temperature of 15
0C was assumed
Consequently, from the table above we are particularly interested in estimating the
drilling costs for wells in HDR service over depths ranging from about 2.9 to 6.5 km
(9,500 to 21,400 ft).
-J
U
15
LI
0
U
5 M)CONTROL
I I40
60
80
AVERAGE GRADIENT
100
VT
(C/km)
) 800
C/km
I I I I I I0
50
100
RESERVOIR
Figure 2.1.
150
200
250
300
350
PRODUCTION TEMPERATURE (oC)
Generalized effects of resource quality and reservoir performance
on busbar generating costs for HDR-produced electricity
(from Armstead and Tester (1987)).
HIGH
I I I I I II-I
I
120
w
-J U L.)ca
r10
U 5
Lm
Mn
I I I I I I mAt this stage of HDR development, it is difficult to say what rock types should be
considered. Most of the HDR wells drilled to date have been in hard crystalline
granitic-type formations for most of their depth with varying amounts of overlying
sediments and/or volcanics. Although rock penetration rates are slower in these
harder formations, holes tend to be more stable and consequently require only
modest mud and casing programs in comparison to typical oil and gas wells in a
similar depth range from 2.9 to
6.5
km. Once expansion and contraction effects have
been properly accounted for, completion programs for HDR wells are also
straightforward in comparison to those required in less stable formations.
To establish base case costs and a cost range for HDR drilling, we reviewed all
available drilling and completion cost data for geothermal (hydrothermal and HDR)
and oil and gas wells for the period 1972-1988. The geothermal well costs came from
a number of sources including Carson and Lin (1981), Entingh (1989), Batchelor
(1989), and Armstead and Tester (1987) as well as from the six case studies being
examined. Joint Association Survey (JAS) data for drilling and completing oil and
gas wells in the continental U.S. in a particular year were used as a reference point to
compare actual HDR well costs against.
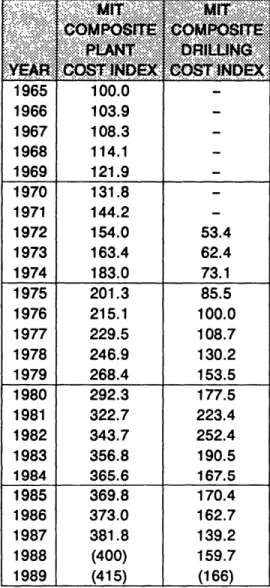
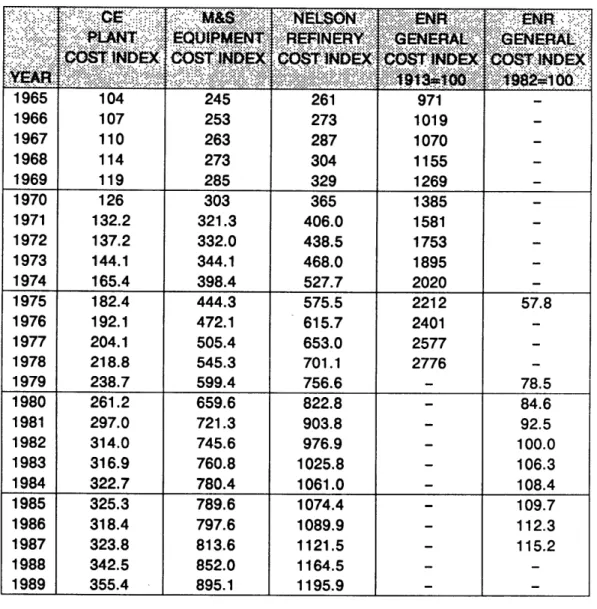
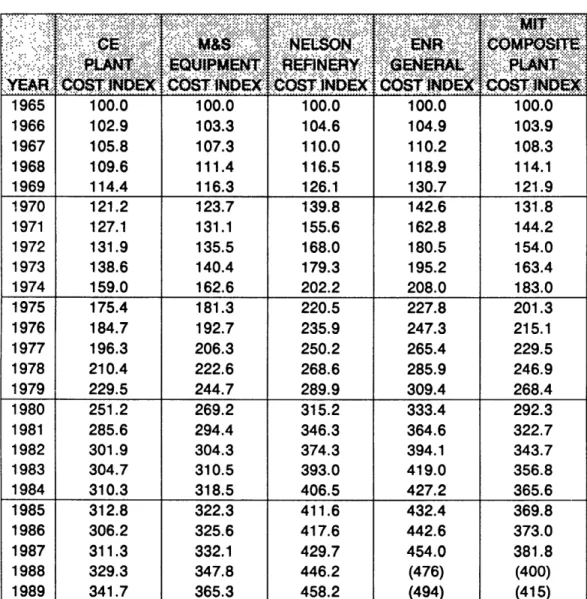
In order to normalize well costs to a common year dollar, a drilling cost index
was established as shown in Table 2.2 and Figure 2.2. To develop this index, JAS
average oil and gas well costs based on total footage for depths ranging from 1250 ft
(0.38 km) to 20,000 ft (6.1 km) were used from 1977 to 1988. In addition, Energy
Information Administration (EIA) costs for 1976 to 1977 (Anderson and Funk
(1986)) was used to supplement the JAS data base. For wells drilled before 1976, a
17% annual inflation factor was assumed.
Table 2.3 gives actual and predicted drilling and completion costs for individual
wells for HDR and hydrothermal systems. 1988 JAS composite costs for completed
oil and gas wells are also included in Table 2.3. Dry well costs were not included in
deriving the JAS composite. Costs for average well depths are shown. Figure 2.3
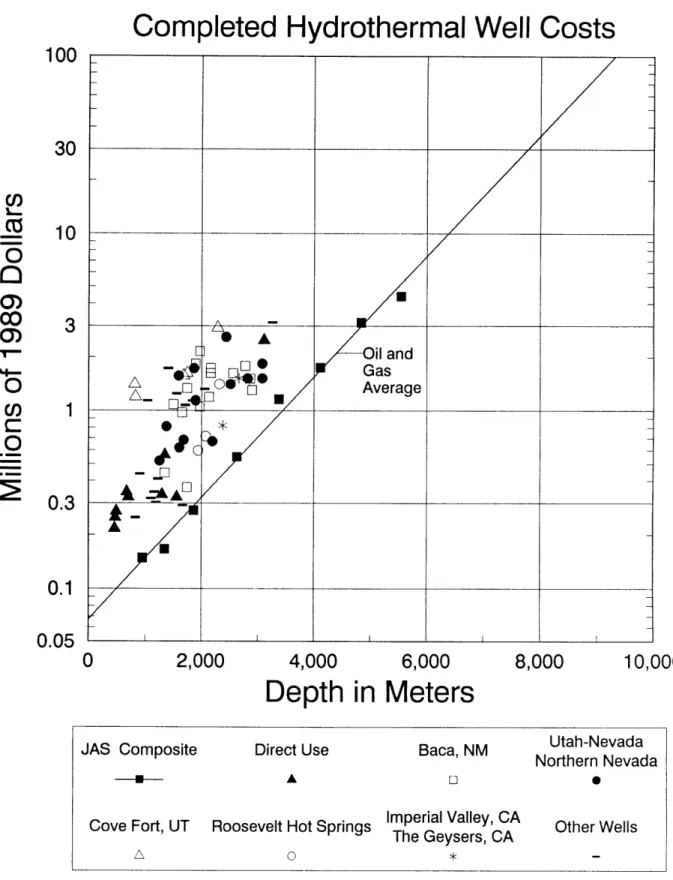
presents a composite of actual and predicted well costs normalized to 1989 $. The
collection of individual well cost data from a number of hydrothermal sites in the
U.S. compiled by Carson and Lin (1981) was normalized to 1989 $ and plotted in
Figure 2.4 with the data listed in Table 2.4. The line plotted in Figures 2.3 and 2.4
corresponds to a least squares fit of the 1988 JAS oil and gas composite well cost
data extrapolated to 1989
$.
One immediately sees that without exception, all
hydrothermal and HDR well costs are higher than a typical, average oil and gas well
drilled to the same depth. Furthermore, the bandwidth of costs for HDR wells lies
somewhat above the scatter of hydrothermal wells.
Following the methodology described earlier by Milora and Tester (1976) and
later updated by Armstead and Tester (1987), we chose to establish a range of
expected drilling costs for HDR wells drilled to 10 km depths. Figure
2.5
shows the
same data as plotted in Figure 2.3 except that an HDR base case curve has been
plotted with an upper bound (HDR problem burdened) and a lower bound (HDR
commercially mature) shown. These well cost figures will be discussed again when
various HDR economic models are compared (Section 7), when the composite cases
are presented (Section 8), and when the generalized model is discussed (Sections
9-11).
TABLE 2.2. MIT COMPOSITE COST INDEXES
MIT MIT
YEAR COST INDEX COST INDEX 1965 100.0 -1966 103.9 1967 108.3 1968 114.1 1969 121.9 1970 131.8 1971 144.2 -1972 154.0 53.4 1973 163.4 62.4 1974 183.0 73.1 1975 201.3 85.5 1976 215.1 100.0 1977 229.5 108.7 1978 246.9 130.2 1979 268.4 153.5 1980 292.3 177.5 1981 322.7 223.4 1982 343.7 252.4 1983 356.8 190.5 1984 365.6 167.5 1985 369.8 170.4 1986 373.0 162.7 1987 381.8 139.2 1988 (400) 159.7 1989 (415) (166) (xxx) = Projected value.
rm--m.
U U , I I I I1970
I I I I I1975
1980
I I I I I I I I I I1985
1990
Year
Estimated plant construction and drilling cost inflation indexes.
MIT Composite Plant
Index
Basis: 100 in 1965
MIT Composite Drilling Index
Basis: 100 in 1976
500
400
300
X
C
200
100
-1965
f , : , ' , I I' I ' ' I ' I i ' ' ii ''IFigure 2.2.
TABLE 2.3. ACTUAL AND PREDICTED
CRILLING
AND COMPLETION COSTS (1989$)
P
.t
.p
I-
Co.
I
Co
Co
1 GT-1 732 0.060 1972 0.187 Fenton Hill Site, New Mexico, USA.
2 GT-2 2,932 1.900 1974 4.315 Actual costs.
3 EE-1 3,064 2.300 1975 4.465
4 EE-2 4,660 7.300 1980 6.827
5 EE-3 4,250 11.500 1981 8.545
6 EE-3A 4,572 5.160 1988 5.364
7 RH-11 (low) 2,175 1.240 1981 0.921 Rosemanowes Site, Cornwall, UK. 8 RH-11 (high) 2,175 1.984 1981 1.474 Actual costs.
9 RH-12 (low) 2,143 1.240 1981 0.921 Conversion rates:
10 RH-12 (high) 2,143 1.984 1981 1.474 low = $1 per pound. 11 RH-15 (low) 2,652 2.250 1985 2.192 high = $1.6 per pound.
12 RH-15 (high) 2,652 3.600 1985 3.507 as recommended by A.S. Batchelor (1989).
UK (Shock, 1987) 6,000 8.424 1985 8.206 From Camborne School of Mines ($1 per pound). Bechtel (1988) 3,657 3.359 1987 4.006 Predictions for Roosevelt Hot Springs, UT Site. Japan (1986) 3,000 6.000 1985 5.845 Predicted costs.
Meridian (1987) 1 3,000 6.900 1984 6.838 Predicted costs based on Heat Mining.
Meridian (1987) 11 3,000 3.800 1984 3.766 Meridian (1987) 111 3.000 3.000 1984 2.973
Heat Mining (1987) 3,000 3.000 1984 2.973 Predicted costs.
13 Geysers 1,800 0.486 1976 0.807 Actual costs cited in Milora and Tester (1976).
14 Geysers 3,048 2.275 1989 2.275 Actual costs from A.S. Batchelor (1989). 15 Other Hydrothermal 1,600 0.165 1976 0.274 Actual costs cited in Milora and Tester (1976).
IM-GEO IV-FL 1,829 1.123 1986 1.146 Meridian predictions of hydrothermal wells
IM-GEO IV-BI 2,743 0.956 1986 0.975 from their IM-GEO data base (Entingh, 1989). IM-GEO BR-FL 2,438 1.217 1986 1.242 Only base well costs shown.
IM-GEO BR-BI 914 0.556 1986 0.567 See key below for hole details. IM-GEO CS-FL 3,048 2.032 1986 2.073
IM-GEO CS-BI 914 0.576 1986 0.588 IM-GEO YV-FL 1,524 0.906 1986 0.924
IM-GEO YV-BI 152 0.406 1986 0.414
IM-GEO GY-DS 3,048 1.155 1986 1.178
JAS 954 0.142 1988 0.148 Actual costs for oil and gas wells
JAS 1,340 0.160 1988 0.166 from Joint Association Survey (1988).
JAS 1,859 0.263 1988 0.273 JAS 2,628 0.528 1988 0.549 JAS 3,376 1.111 1988 1.155 JAS 4,108 1.682 1988 1.748 JAS 4,834 3.019 1988 3.138 JAS 5,539 4.236 1988 4.403
Plot #'s refer to Figures 2.3 and 2.5.
MS - Millions of US Dollars. Key:
IV-FL - Imperial Valley Flash, Salton Sea, CA field. IV-BI - Imperial Valley Binary, Heber, CA field.
BR-FL - Basin and Range Flash, Dixie Valley, NV field. BR-BI - Basin and Range Binary, generic NV field.
CS-FL - Cascades Flash, Newberry, OR field. CS-BI - Cascades Binary, generic OR, WA field.
YV-FL - Young Volcanics Flash, Coso, CA field.
YV-BI - Young Volcanics Binary, Mammoth, CA field.
GY-DS - Dry Steam, The Geysers, CA field (Costs from B.J. Livesay).
Drilling and Completion Costs
2,000
4,000
6,000
8,000
Depth in Meters
Actual and predicted drilling and completion costs
(see Table 2.3 for data and sources).
100
30
o
-5
O
0
0)Co
C
O
im10
3
1
0.3
0.1
0.05
10,000
JAS Composite
HDR Actual
HDR Predicted
Other HydrothermalGeysers Actual
Other Hydrothermal
Hydrothermal Predicted
Actual
0 o
TABLE 2.4. HYDROTHERMAL
WELL
COST DATA
From Carson and Lin (1981)
Wt DESCRITDT
C
DEPTH %:
'ST
FT..
8979M M Direct Use 1,500 0.20 457 0.216 Direct Use 1,550 0.23 472 0.249 Direct Use 1,600 0.25 488 0.270 Direct Use 2,300 0.30 701 0.324 Direct Use 2,200 0.32 671 0.346 Direct Use 4,250 0.31 1,295 0.335 Direct Use 5,100 0.30 1,554 0.324 Direct Use 4,400 0.52 1,341 0.562 Direct Use 10,200 2.30 3,109 2.487 Baca, NM 4,400 0.41 1,341 0.443 Baca, NM 4,900 1.00 1,494 1.081 Baca, NM 5,400 0.90 1,646 0.973 Baca, NM 5,700 1.23 1,737 1.330 Baca, NM 5,700 0.34 1,737 0.368 Baca, NM 6,450 0.97 1,966 1.049 Baca, NM 6,450 2.00 1,966 2.163 Baca, NM 7,000 1.10 2,134 1.190 Baca, NM 7,100 1.50 2,164 1.622 Baca, NM 7,100 1.60 2,164 1.730 Baca, NM 8,400 1.50 2,560 1.622 Baca, NM 9,100 1.65 2,774 1.784 Baca, NM 9,400 1.40 2,865 1.514 Baca, NM 9,500 1.20 2,896 1.298 Baca, NM 6,200 1.70 1,890 1.838 Utah-Nevada 4,100 0.48 1,250 0.519 Utah-Nevada 4,500 0.75 1,372 0.811 Utah-Nevada 5,200 1.45 1,585 1.568 Utah-Nevada 5,250 0.57 1,600 0.616 Utah-Nevada 5,500 0.63 1,676 0.681 Utah-Nevada 6,200 1.05 1,890 1.136 Utah-Nevada 8,000 2.40 2,438 2.595 Northern Nevada 6,100 1.60 1,859 1.730 Northern Nevada 7,200 0.62 2,195 0.670 Northern Nevada 8,250 1.30 2,515 1.406 Northern Nevada 9,250 1.40 2,819 1.514 Northern Nevada 10,100 1.40 3,078 1.514 Northern Nevada 10,100 1.70 3,078 1.838 M$ = Millions of US dollarsTABLE 2.4. HYDROTHERMAL
WELL
COST DATA
Continued
.79 M$.METERS ... Cove Fort, UT 2,650 1.30 808 1.406 Cove Fort, UT 2,700 1.10 823 1.190 Cove Fort, UT 5,500 1.45 1,676 1.568 Cove Fort, UT 5,700 1.50 1,737 1.622 Cove Fort, UT 7,500 2.70 2,286 2.920Roosevelt Hot Springs 6,350 0.55 1,935 0.595
Roosevelt Hot Springs 6,800 0.66 2,073 0.714
Roosevelt Hot Springs 7,600 1.30 2,316 1.406
Imperial Valley, CA 7,800 0.76 2,377 0.822 The Geysers, CA 8,750 1.40 2,667 1.514 The Geysers, CA 9,350 1.35 2,850 1.460 Other Wells 2,700 0.23 823 0.249 Other Wells 2,950 0.41 899 0.438 Other Wells 3,600 0.30 1,097 0.319 Other Wells 3,900 0.28 1,189 0.303 Other Wells 3,800 0.32 1,158 0.346 Other Wells 4,000 0.38 1,219 0.411 Other Wells 5,450 0.27 1,661 0.292 Other Wells 3,400 1.05 1,036 1.136 Other Wells 4,600 1.60 1,402 1.730 Other Wells 5,100 1.15 1,554 1.244 Other Wells 5,600 0.99 1,707 1.071 Other Wells 6,000 1.05 1,829 1.136 Other Wells 6,750 1.22 2,057 1.319 Other Wells 10,700 2.90 3,261 3.136
Completed Hydrothermal Well Costs
100
30
10
3
1
0.3
0.1
0.05
2,000
4,000
6,000
Depth in Meters
8,000
10,000
Utah-NevadaJAS Composite
Direct Use
Baca, NM
Utah-Nevada
Northern Nevada
-U- A 0 0
Cove Fort, UT
Roosevelt Hot Springs Imperial Valley, CA
Other Wells
The Geysers, CA
A 0
Figure 2.4. Actual hydrothermal completed well costs as a function of depth
(adapted from Carson and Lin (1981)).
U,
0)
Co
0)
0
C_
0
Projected HDR Well Costs
2,000
4,000
6,000
Depth in Meters
8,000
10,000
Projected HDR well drilling and completion costs for the
base case with limits for problem-burdened, commercially mature,
and advanced drilling technology shown.
100
30
C'
-
CO
0O
Co
C,
0
(-10
3
1
0.3
0.1
0.05
Figure
2.5
JAS Composite
HDR Actual
HDR Predicted
-- A-- A
Geysers Actual
Other Hydrothermal
Hydrothermal Predicted
Actual
* o
3. HDR Reservoir Formation
To characterize the economics of hot dry rock geothermal energy utilization, we
have evaluated several critical technical elements of HDR reservoirs and surface
systems to show how they compare with existing natural hydrothermal systems.
Geothermal power plants now operating throughout the world typically involve an
underground reservoir containing natural steam and/or hot water which is brought to
the surface by way of a set of drilled wells. Natural or indigenous geothermal fluid
flows under artesian pressure or is pumped through a gathering system of pipes to a
centrally located power plant, which may produce electricity, supply heat, or both.
Reinjection wells are normally used to return the cooled fluid to the formation. The
main feature that distinguishes an HDR system from these natural hydrothermal
systems is the absence of a sufficient amount of spontaneously produced indigenous
reservoir fluid.
Accordingly, HDR resources provide a degree of flexibility that is inherently
absent from natural hydrothermal systems. Namely, HDR reservoir temperatures
may be selected by drilling to a specified depth determined by the geothermal
temperature gradient. Furthermore, if an HDR reservoir has too short a lifetime,
remedial treatment is possible by redrilling to a hotter region of rock. In the
hydrothermal case, the reservoir conditions, including in situ fluid temperature,
pressure and composition, and formation permeability and porosity, are determined
by existing natural conditions in that region. In contrast, the unique gradient
relationship between reservoir temperature and depth in HDR systems provides a
framework for exploring the economic tradeoffs of drilling deeper, hotter, more costly
wells versus drilling shallower, cooler, less expensive wells balanced against the value
of the product; that is, electricity or heat or both.
HDR reservoirs may exist in formations having permeabilities ranging from very
low (<1 microdarcy) to high (> 1 millidarcy) in which the rock itself is hot enough to
be considered useful for energy extraction. Depending on the end use, temperatures
may be as low as
100°C
for space heating purposes or approaching 300'C for
producing electricity.
One of the key characteristics of any HDR system is that the reservoir rock does
not contain sufficient in situ fluids and/or permeability. Therefore, HDR systems, by
definition, require stimulation to create a viable reservoir. Viability requires a
sufficient volume of hot rock capable of extracting thermal energy for an extended
period at commercially acceptable rates. Artificial fracturing methods are the main
technique of reservoir stimulation used in low permeability HDR formations. Most
concepts employ some modification of classical hydraulic fracturing to either open
sealed natural joint structures in the rock mass or to create new ones.
Reasonable rates of energy extraction and sufficient reservoir lifetimes (- 10 yr or
greater) from HDR systems may be achieved using two fundamental approaches to
mining the heat. First, if in situ formation permeabilities are low, an artificial system
must be created to expose a circulating fluid to the hot rock by creating
high-conductance flow passages with a sufficiently large heat-transfer surface area. In this
case, recovery of most of the injected fluid may be achieved quite easily by taking
advantage of the natural containment provided by the low permeability of the
formation (Smith, et al. (1975)). But if the permeability is high, the techniques to
contain and recover the fluid and to ensure uniform fluid contact with the hot rock
surface are more demanding. The same approaches used for recovery of gas and oil
by water drive or flooding methods may be quite applicable to high permeability
formations for HDR applications. Both production and injection well networks
would be arranged so that fluid loss to surrounding permeable formations at the
perimeter of the developed geothermal field is minimal.
The choice of reservoir circulating fluid should be briefly discussed. For almost
all HDR concepts considered for either low- or high-permeability formations, liquid
water or steam has been selected. The main reasons for this are the poorer
performance, significantly higher costs and potential environmental consequences
associated with non-aqueous fluids. In principle, the idea of using an "inert" fluid that
will not corrode or dissolve minerals is attractive. However the very fact that finite
losses from the active reservoir will occur due to permeation has a real economic and
environmental impact. The subsequent costs and the perceived (or real)
environmental effects of this loss makes any fluid but water or air unequivocally not
acceptable. The choice between a vapor system consisting of compressed air or
steam and a pressurized liquid water system is based primarily on performance.
Parasitic pressure losses per unit of energy recovered from a deep reservoir will be
very high when a low-density gas is used as the transport medium. To reduce
pumping or compressor power requirements, large diameter wellbores would be
needed. These would be too costly. Furthermore, if steam were used, operation at
lower pressures would be required to avoid premature condensation in the production
well. A liquid water or liquid water-steam system has the very attractive feature of
providing a substantial amount of buoyancy-driven flow due to the density difference
between the cold injection well and the hot production well. All things considered,
liquid water kept under sufficient pressure to avoid flashing is the best choice for first
generation HDR systems where performance and stable operation are key factors. In
future systems, liquid water-steam concepts could be considered but it is unlikely that
air or non-aqueous fluids would ever be attractive.
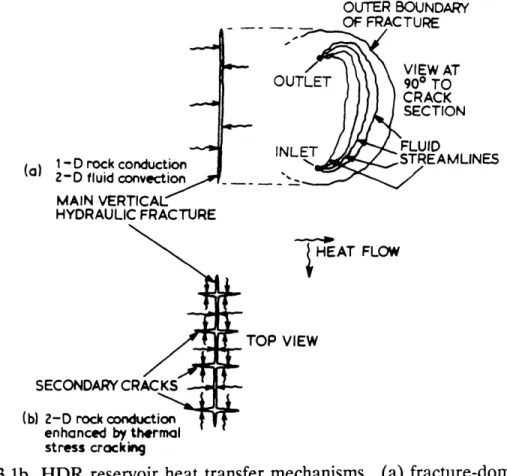
Several HDR reservoir concepts for low-permeability formations are depicted in
Figure 3.1a. The first idealized concept is a single vertical hydraulic fracture
produced from one wellbore by fluid pressurization that exceeds the effective
confining stress and strength of the rock. The required surface areas and reservoir
volumes for heat extraction are created by continued high-pressure injection of fluid.
1000 -2000 m
(a) Large single fracture (b) Smaller multiple parallel fractures
PERMEABLE ROCK
(c) r0-50CFully fractured (c) Fully fractured region
Figure 3.1a HDR reservoir concepts for low permeability formations. Half
fractures shown with division at a vertical axis of symmetry.
(a) large single fracture. (b) smaller multiple parallel
fractures. (c) fully fractured regions in jointed rock.
(from Armstead and Tester (1987)).
AMI Drockconduction, -- LII
2-D fluid convection -MAIN VERTICAL HYDRAULIC FRACTURE
SHEAT
FLOW TOP VIEW SECONDARY CRACKS (b) 2-D rock conduction enhanced by thermal stress crockingFigure 3.1b HDR reservoir heat transfer mechanisms. (a) fracture-dominated
flow. (b) fracture-dominated flow with enhancement by thermal
stress cracking (from Armstead and Tester (1987)).
The downhole system is then completed by directionally drilling a second wellbore to
intersect the fractured region with sufficient separation from the first wellbore to
avoid flow short-circuiting. Pressurized water is then circulated down one hole
through the fractured region to remove energy from the rock and is recovered in a
second hole. Energy is extracted at the surface using heat exchangers, and the cooled
fluid is reinjected to complete a closed cycle. Even with low permeabilities, some
makeup water is required. Because reservoirs of this type will most likely be formed
at depths sufficient to ensure that the least principal earth stress is in the horizontal
plane, in theory, hydraulically stimulated fractures should have near-vertical
orientation. Assuming that the stress field is uniform and the physical strength
properties of the formation are approximately isotropic and homogeneous, an ideal
fracture of circular shape with an elliptical cross section should be formed (Smith et
al. (1975) and Tester and Smith (1977)). Effective fracture radii will be typically 100
m or greater with widths of a few millimeters in cross section. Because the inherently
low thermal conductivity of the rock quickly controls the rate of heat transfer to the
circulating fluid, large fracture surface areas are required. For optimum performance
of a reservoir of this type, the fluid should contact as much of the fracture surface as
possible. Fracture conductances or permeabilities for self- or pressure-propped
fractures should be sufficiently high to permit buoyant circulation across the faces of
the fractures between the inlet and outlet points of the system as shown in Figure
3.1b. Multiple, parallel fracture concepts have also been proposed as a method of
creating large reservoir areas and active volumes.
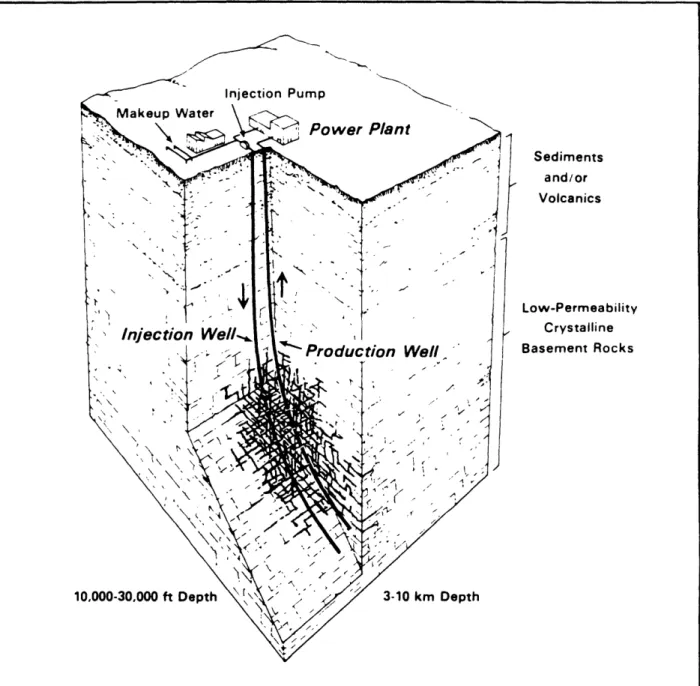
In real HDR reservoirs, the dominant feature will most likely be a network of
interconnected fractures that results from activation of a set of natural joints
(Batchelor (1984 (a,b), 1988) and Armstead and Tester (1987)) (see Figure 3.2). This
is in contrast to the idealized set of single or parallel fractures that has been depicted
in early HDR concepts (see Figure 3.1a). Nonetheless, regardless of how complex
the reservoir is, the magnitude and orientation of the in situ stress field will influence
the structure of the activated fracture network as will the geometry of the natural
joints themselves.
The key objective in forming an HDR reservoir is to maximize heat extraction
efficiency and reservoir lifetime. This requires knowledge of the extent and
orientation of the fracture system in order to optimally locate the production and
injection wells. Thus diagnostic methods for characterizing reservoir geometry are
essential. Field work to date at Fenton Hill, Rosemanowes, and elsewhere has
employed active and passive seismic methods, pressure transient, tracer techniques
and other geophysical measurements to determine reservoir structural parameters.
This is a very difficult task as it requires the deconvolution of only indirect
evidence that results in a classical non-unique solution where more than
one reservoir geometry can be found that consistently represents all available data.
The development of reservoir diagnostic techniques involving both the hardware and
the theoretical methodology to interpret data are key components in the HDR
Sediments and/or Volcanics Low-Permeability Crystalline Basement Rocks
Figure 3.2 HDR reservoir concept for an interconnected network of fractures
stimulated in a low-permeability formation (from Tester, Brown,
and Potter (1989)).
research and development programs in existence today (see Tester, Brown, and
Potter (1989), Batchelor (1984 (a,b), 1986), and Armstead and Tester (1987) for
summaries).
If thermal exhaustion of an HDR fractured reservoir occurs because of
insufficient surface area or active rock volume, remedial stimulation treatment is
possible. For example, by proper orientation of the boreholes in a parallel, inclined
arrangement as shown in Figure 3.1a, additional fracturing might be used to provide
more accessible surface area in a hot region of rock. Sidetracking of the original
wellbores to a new region and refracturing might also be an attractive method of
re-stimulation.
Other methods of reservoir enhancement may occur naturally. Removal of heat
from the vicinity of the fracture surface introduces thermal stress which may be
sufficiently large to cause additional cracking of the rock. If thermal stress cracks
propagate in such a way as to provide accessible flow channels for the circulating
fluid as shown in Figure 3.1b, the performance and lifetime of an HDR reservoir
could be substantially enhanced. Thermal stress cracking of this type increases the
heat transfer efficiency by forming an extended surface penetrating into the hotter
regions of the formation. As McFarland and Murphy (1976) point out, even without
thermal stress cracking, the thermal contraction of the rock will increase the fracture
gap width, thus allowing buoyancy effects to sweep fluid more uniformly over the
available fracture surface area. There is strong evidence in early tests of the HDR
Phase I reservoir at Fenton Hill that reservoir growth occurred as a direct result of
thermal stress induced effects (Tester, et al. (1989)).
If thermal stress enhancement does not occur or if large, stable fracture domains
cannot be produced, multiple fractures in inclined boreholes may be an acceptable
alternative. Multiple parallel fracturing concepts have been suggested by Raleigh, et
al. (1974) and R.M. Potter of LASL in 1972 and analyzed by Gringarten, et al. (1975)
and Wunder and Murphy (1978). Multiple fracturing using hydraulic stimulation
methods is currently under study for generating sufficient surface area to maintain
reservoir lifetime (see Figure 3.1a). Even with networks rather than discrete
fractures, multiple zone stimulation may be feasible to activate large rock volumes for
heat extraction.
Developing and perfecting HDR stimulation methods have been a major focus of
the U.S. and UK R&D programs during the past 15 years (see Armstead and Tester
(1987), Batchelor (1984 (a,b), 1988, 1989b), and Brown et al. (1989) for details).
Although the field efforts have made considerable progress, there is not yet sufficient
knowledge regarding rock fracturing characteristics to absolutely guarantee that a
fractured network of sufficient size and viability can be created and connected to an
appropriately designed injection and production well system. Given this inherent
uncertainty, we must make several assumptions regarding the formation of such a
reservoir system in order to proceed with an economic assessment of HDR.
All studies have assumed that current fracturing technology (or some modest
extension of it) is sufficient to create a viable HDR reservoir at depths of interest. In
addition, they have estimated the costs associated with these stimulation methods.
These include the costs of pumping at high pressures and rates, costs for fluids with
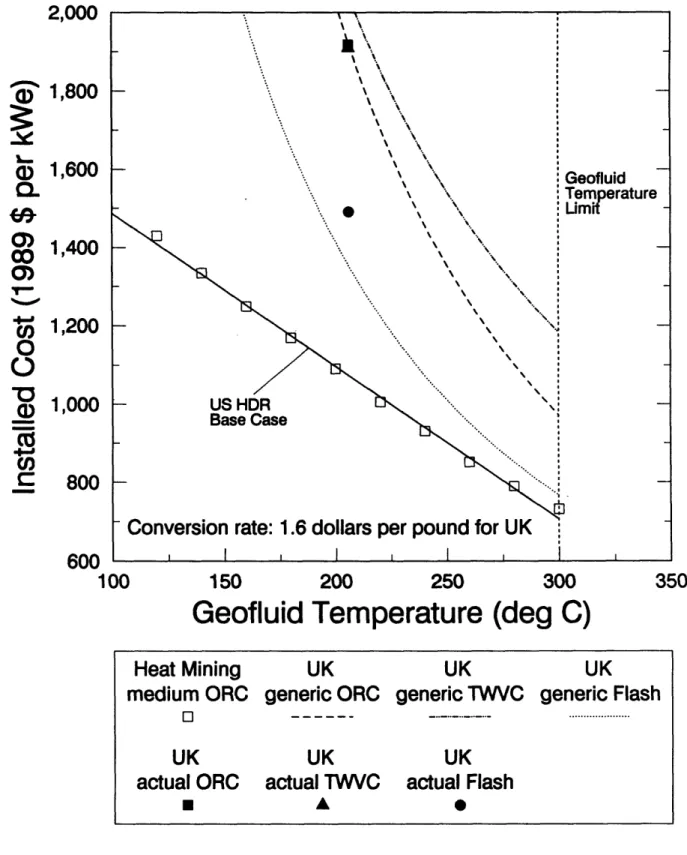
special rheological properties, and the costs of diagnostic geophysical testing. Figure
3.3 provides an estimate of stimulation costs per kWe of net installed capacity for
different temperature reservoirs. Also plotted on the same figure are specific
estimates for stimulation costs taken from the economic assessment studies. Note
that we have tried to account for the effect of resource grade on the stimulation costs
by plotting costs as a function of initial reservoir temperature. Lower gradient
regions will in general require deeper wells and/or higher well flow rates and
therefore proportionately higher costs will result. Recent estimates of drilling and
stimulation costs for HDR systems in the UK by Mortimer and Minett (1989) are
consistent with the results shown in Figure 3.3.
This methodology for estimating stimulation costs falls short of providing a clear
dependence of costs on the size of the reservoir. Consequently, we examined an
alternate approach. In Figure 3.4, the estimated cost of stimulating an HDR doublet
system is plotted as a function total effective reservoir surface area in m
2per kWe of
installed capacity. By using the installed capacity to normalize costs and reservoir
size, the effect of fluid temperature (and hence gradient and depth) on conversion
efficiency is accounted for. Data from the Bechtel, LANL, Meridian, Japan, and UK
HDR economic studies are plotted along a regressed line (solid) for the composite
base case that will be used in the economic projections described later in this report
(see Sections 8 and 9). One should note that the Meridian Organic Rankine Cycle
(ORC) estimates were not used in the regression. The dotted lines shown represent
two times and one half of the composite base case stimulation costs to illustrate the
range of estimates. Table 3.1 gives the calculations that were used in Figure 3.4. In
all cases, these cost estimates should be regarded as only approximate in that the
technology for creating HDR reservoirs is still under development.
180
200
220
240
260
280
300
Average Initial Reservoir Temp (deg C)
320
Estimated HDR reservoir stimulations costs in $ per kWe installed
as a function of average initial reservoir temperature. Note that
deg C
=
degrees Celsius
=
oC,ORC
=
Organic Rankine Cycle and
2-stage flash refers to power plant choices (see Section 6).
1,000
a)
0000%%0)
Co
0)
CD
0
0
.
0
E
0
-5
E
a)
i 4aCD
E
WL)
800
600
400
200
0
-160
Figure 3.3
200
400
600
800
Effective Reservoir Area (sqm/kWe)
1,000
Estimated HDR reservoir stimulation costs in
$
per kWe installed as a
function of normalized effective reservoir surface area in sqm/kWe
(m
2/kWe) installed.
1,200
O
a-Co
60
v,
0
0
0
--E
-CZ
w
1,000
800
600
400
200
Figure 3.4
TABLE 3.1. CALCULATIONAL SUMMARY FOR STIMULATION COST ESTIMATES
S..
OTwdw:
n
:iatel.i
::;:
er
Number
of
; Reservoi
istal
star.
Reservo;i~f stiion.St
imulrYn
i
Paraineter RevQii Reservoi
Reservoirs Total Area
Capacity
Area
Cst
C
kg/sqnk
lkg s
M sqm (4)
M sqm (4)
MWe*
i
e
98W
90 M$
(5)
198G $IlWe
Reference Table 7.1 Table 7.1 Calc Table 7.1 Calc Table 7.1 Calc Table 7.1 Calc
(1) (2) (3) Bechtel 0.000314 120 1.20 4 4.80 70 69 15.2 217 LANL 0.000144 46 1.00 12 12.00 75 160 7.4 99 Meridian 0.000122 57 1.47 19 27.87 64 436 54.5 852 0.000145 62 1.34 19 25.51 88 290 54.5 619 0.000145 78 1.69 19 32.09 112 287 54.5 487 Japan 0.000127 74 1.83 9 16.47 68.7 240 22.4 326 UK 0.000053 75 4.47 5 22.34 25.3 884 13.1 520 0.000053 75 4.47 5 22.34 35.3 633 13.1 372 0.000053 75 4.47 5 22.34 22.3 1003 13.1 589 Notes:
(1) - Where necessary, determined from drawdown rate and Heat Mining Figure 10.25.
(2)
-(3)
-(4)
-(5)
-For Meridian, estimated from fluid availability (function of reservoir temperature) and net installed capacity. Adjusted by the MIT Composite Drilling Index from Table 2.1.
M sqm = Millions of square meters of effective heat transfer area (single-sided basis) for a planar fracture. M$ = Millions of US dollars.
4. HDR Reservoir Performance Criteria
The temperature changes that may occur in the reservoir output fluid, as well as
the rate of power production over the 20 to 40 year lifetime of an HDR system, are
crucial in determining economic viability and in developing an optimal strategy for
reservoir management. The most desirable approach is to maintain a constant output
temperature while maximizing the mass flow rate of fluid through the reservoir. This
will not be possible because any finite-sized HDR system will have a finite rate of
temperature decline or drawdown. The energy drawdown rate for a fractured HDR
reservoir with low formation permeability will depend on the following factors:
* Accessible fracture surface area and rock volume
* Mass flow rate r of produced fluid
* Reservoir temperature distribution
* Distribution of fluid across the fractured surface,
and through the fractured region
* Thermal properties of the rock (density, heat capacity,
and conductivity)
* Net impedance to flow and allowable pressure drop
* Water loss rates
Section 5 of the report considers the quantitative representation of these factors
in specific performance models of HDR reservoirs. Here we would like to first
discuss the qualitative features of performance.
High reservoir temperatures, high production flow rates, low impedance, and
large reservoir surface areas and volumes are desirable--leading to lower rates of
thermal drawdown which is the primary measure of energy extraction effectiveness.
Furthermore with low impedance to flow, parasitic pumping losses will be minimized
and in the optimal case, "self-pumped" systems are possible as a result of buoyancy
drive.
The issue of water loss raises some speculation about induced seismic effects and
the possible economic impact of a large makeup supply of water in arid regions of
the U.S. It should be emphasized that proper pressure management of the HDR
system, which in extreme cases may require downhole pumping from the production
well, can control or eliminate all water losses should they become a critical issue.
Furthermore, in all testing to date, no measurable seismic risk has occurred.
The distribution of fluid uniformly across large surface areas and through large
volumes of the fractured rock comprising the reservoir is crucial to achieving
acceptable reservoir lifetimes. In petroleum engineering terminology, this concept is
expressed as sweep efficiency or maximized swept rock areas and volumes. In
practice, achieving high sweep efficiencies through large volumes of fractured rock
has only been demonstrated on a small-scale. Commercially-sized HDR reservoirs
have yet to be demonstrated in the field, although they represent the modular
extension of concepts already proved for smaller, prototype HDR reservoirs
(Armstead and Tester (1897)).
In any assessment of HDR economics, assumptions regarding the energy
extraction performance of the reservoir are required. In order to fully appreciate the
inherent uncertainties that are carried with these assumptions, one must look not only
at what has been demonstrated in the field but also at the extent of the extrapolation
of that performance required to meet the specifications of larger, commercial-sized
systems.
Alternatively, the economic model itself can be used to specify what reservoir
performance parameters (fluid temperatures, flow rates, etc.) are required to make
the system viable--for example, to produce electric power at competitive breakeven
busbar prices. This was, in fact, the fundamental approach used to establish HDR
feasibility in the early economic modeling efforts (see for example, Milora and Tester
(1976), Tester et al. (1979) and Cummings and Morris (1979)). Base case reservoir
temperatures, fluid flow rates and drawdown rates were bracketed using existing
hydrothermal reservoir data. These ranges were then tested for economic viability
using the early models to estimate a break-even or busbar price for electricity. For
example, initial fluid production temperatures ranging from 100 to 300
0C and flow
rates from
45
to 227 kg/s (100 to 500 lb/s or 360,000 to 1,800,000 lb/hr) were used in
the first assessment of HDR economics by Milora and Tester (1976) to cover a range
consistent with high grade to marginal liquid-dominated systems.
5. HDR Reservoir Performance Modeling
A proper understanding of reservoir thermal drawdown rates is required for
scaling reservoir performance for economic assessments of HDR. For example, for a
given set of assumptions, dealing with fluid flow rates and flow distribution, rock
temperatures and reservoir structure, rates of temperature decline can be estimated
as a function of produced fluid flow rate and reservoir volume or effective heat
transfer area. This permits a quantitative assessment of the impact of finite reservoir
drawdown on power output and thus on revenues over the lifetime of the power
plant. For example, as temperature declines, the plant's efficiency drops, and less
power is produced per kg of geofluid. If the drawdown rate is too fast, drilling new
wells or redrilling old ones to hotter zones of rock will be required to sustain electric
power output at acceptable levels.
The models used to predict or simulate the thermal performance of HDR systems
range from very simplistic to extremely complex treatments of fluid flow and heat
transfer effects in discretely fractured porous media. The primary models for HDR
reservoirs developed to date include:
1. Zeroth-order single fracture model (Gringarten, et al. (1975),
Armstead and Tester (1987)), 1-dimensional rock conduction coupled
to 1-dimension convective flow in planar fractures of uniform
aperture
2. Single fracture model (McFarland and Murphy (1976), Murphy,
et al. (1981)), 1-dimensional rock conduction coupled to
2-dimensional convective flow in planar fractures of variable
aperture
3. Multiple interacting fracture model (Wunder and Murphy (1978)
and Zyvoloski (1983)), 2-dimensional rock conduction coupled
to 1- or 2-dimensional convective flow in planar fractures
4. Porous 3-D channel model (Robinson and Kruger (1988), and
Robinson and Jones (1987))
All of these models require specification of reservoir structure (fracture length,
radius, aperture, spacing, and/or density and reservoir volume) in order to produce
quantitative predictions of thermal performance. Typically one or more of these
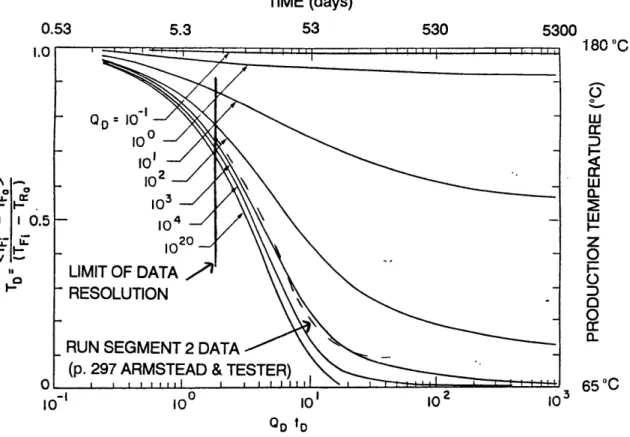
reservoir sizing parameters are fit to match observed field data such as depicted in
Figure 5.1 from tests at Fenton Hill and Rosemanowes. Frequently, more than one
model can adequately describe the data shown in Figure 5.1. This results in different
values of reservoir geometric parameters or even worse in completely different modes
or mechanisms for heat transfer. For example, a 3-D porous media model and a
single fracture model have been used to match the 75-day test of the Phase I Fenton
Hill system where a significant amount of drawdown occurred. In Figure 5.2a, a
spherical, lumped parameter model (#5) developed by Elsworth (1989 a,b,c) fits the
data quite well as does the single fracture and zeroth-order models (#1 and #2).
The consequence of all this is that a unique reservoir geometry cannot be specified
without more data.
The situation becomes even more uncertain when one tries to extrapolate to
larger, commercial-sized HDR systems. Preliminary economic analyses of HDR
suggest that only limited drawdown will be acceptable. A commercial goal of 5-10%
of temperature decline over a 5 to 10 year period is depicted in Figure 5.1. In order
to demonstrate that this goal is reachable, many people argue that you will have to
test a commercial-sized system for a 5 to 10 year period to be sure that production
temperatures can be sustained.
Although we cannot at this stage of model development accurately predict the
future performance of any HDR reservoir much beyond the actual test period over
which parameters were fit, modeling can be used generically in economic forecasting.
For example, we can set the drawdown rate a priori at a particular value and study its
economic impact in a sensitivity test. The more difficult question is what value of
drawdown should be selected for the base case. Some of the HDR economic studies
have neglected thermal drawdown while others have included it. For
example, the most recent Bechtel study (1988) used a parallel, non-interacting
fracture system whose thermal performance came from the single fracture model for
predicting drawdown. They also included reservoir growth effects induced by thermal
stress enhancement for some of their cases. We feel that it would be best to consider
three generic levels of drawdown for each of the three HDR reservoir grades:
1. Base case--A 2% production fluid temperature decline per year with
redrilling done every 5 years to restore fluid temperatures to
original design levels. For modeling purposes this corresponds
to a drawdown parameter ii/R
2equal to 0.00014 kg/m
2.s.
I I I I 11111 - ~VYTh1l~~r~FmTrFFFf I I I I 11111
ENLARGED PHASE
d(
I (FENTON HILL) PHASE IT (ROSEMANOWES)
520 days
282 days
COMMERCIAL
ENTON HILL) COMMERCIAL
GOAL -75 days 5yr IOyr I I I~~~ I
~
I I I I l lI l 10 days I I I I I l llI l I I I ll11l100
1000
10000
PRODUCTION PERIOD (hr)
I yr I , w10l00100000
produced fluid temperature at time t
initial produced fluid temperature
reinjection temperature
Composite of HDR prototype reservoir thermal drawdown data
plotted as dimensionless drawdown versus the logarithm of time
(adapted from Armstead and Tester (1987)).
1.0
0.8
1-
0.6-a,0
v II h0H4-0.4
0.
2--I day I0.0L
10
T(t)
T(t
=
0)
Trej
Figure 5.1
I I I I I II I I I i 1 1 1 1 SI I l I I I F I II 31 days PHASE Il (F ORIGINAL PHASE Z (FENTON HILL)5.3
TIME (days)
53
530 5300 180 C w crr wa-w
z
0
0
Io 0 650 6500C 0o to5.2a. Lumped-parameter spherical model (Elsworth (1989 a,b,c))
10
20
30
40
50
60
70
80
TIME (days)
5.2b. Single fracture model (Murphy, et al. (1981))
Figure 5.2 HDR reservoir modeling predictions of performance for
the 75-day test of the Phase I Fenton Hill system.
0.53 0 0 I 0.5 IF