HAL Id: hal-00317640
https://hal.archives-ouvertes.fr/hal-00317640
Submitted on 23 Sep 2004
HAL is a multi-disciplinary open access
archive for the deposit and dissemination of
sci-entific research documents, whether they are
pub-lished or not. The documents may come from
teaching and research institutions in France or
abroad, or from public or private research centers.
L’archive ouverte pluridisciplinaire HAL, est
destinée au dépôt et à la diffusion de documents
scientifiques de niveau recherche, publiés ou non,
émanant des établissements d’enseignement et de
recherche français ou étrangers, des laboratoires
publics ou privés.
Middle ultraviolet remote sensing of the equatorial
thermosphere during a geomagnetic storm
A. W. Stephan, K. F. Dymond, S. A. Budzien, R. P. Mccoy
To cite this version:
A. W. Stephan, K. F. Dymond, S. A. Budzien, R. P. Mccoy. Middle ultraviolet remote sensing of the
equatorial thermosphere during a geomagnetic storm. Annales Geophysicae, European Geosciences
Union, 2004, 22 (9), pp.3203-3209. �hal-00317640�
SRef-ID: 1432-0576/ag/2004-22-3203 © European Geosciences Union 2004
Annales
Geophysicae
Middle ultraviolet remote sensing of the equatorial thermosphere
during a geomagnetic storm
A. W. Stephan1, K. F. Dymond1, S. A. Budzien1, and R. P. McCoy2
1E. O. Hulburt Center for Space Research, Naval Research Laboratory, Washington, District of Columbia, USA 2Office of Naval Research, Arlington, Virginia, USA
Received: 29 September 2003 – Revised: 3 February 2004 – Accepted: 18 February 2004 – Published: 23 September 2004 Part of Special Issue “Equatorial and low latitude aeronomy”
Abstract. We present measurements of the equatorial
mid-dle ultraviolet airglow taken during the week of 21–28 May 2000, including a strong geomagnetic storm on 24 May. Limb spectra were taken by the Ionospheric Spectroscopy and Atmospheric Chemistry (ISAAC) experiment on the Advanced Research and Global Observation Satellite (AR-GOS). O II lines near 247.0 nm and N II lines near 214.3 nm provide a measure of thermospheric O and N2 changes,
re-spectively. Our results show increases in airglow brightness of both emissions during the storm that we interpret as in-creases in the concentrations of both species, but the ratio of intensities that correspond to O/N2is lower than expected
during and after the storm. We also invert the emission pro-files using discrete inverse theory, to obtain a measure of ther-mospheric neutral temperatures during this time. Although temperatures increase after the main phase of the storm, the increases do not correlate with the observed features in the intensity ratio. These data could be explained by vertical winds and tides modifying the equatorial neutral composi-tion during storms, in addicomposi-tion to common heating responses.
Key words. Atmospheric composition and structure (thermosphere-composition and chemistry; airglow and aurora) – Magnetospheric physics (storms and substorms)
1 Introduction
The response of the thermosphere and ionosphere to geo-magnetic storms has proved to be a challenging puzzle due to the influence of a combination of winds, waves, heating, and electrodynamics. These multiple forces create storm per-turbations in neutral composition that vary significantly with latitude but still demonstrate some well characterized fea-tures. At high latitudes, direct particle and energy inputs lead to vivid auroral displays and initiate disturbances that propagate to lower latitudes. Upwelling due to Joule and
Correspondence to: A. W. Stephan
(andrew.stephan@nrl.navy.mil)
particle heating leads to changes in neutral composition as molecular species are enhanced (Mayr et al., 1978; Pr¨olss, 1980). Winds circulate these composition changes to mid-dle latitudes and influence the production and loss of iono-spheric plasma. As the magnetic inclination decreases, winds and traveling atmospheric disturbances (TADs) also begin to push this plasma up field lines (Pr¨olss and O˘cko, 2000). The result is a somewhat complex pattern of positive and negative storm effects, where the plasma density is enhanced or de-pressed, respectively, compared to quiet conditions (Pr¨olss, 1993; Burns et al., 1995; Fujiwara et al., 1996, and references therein).
The ratio of neutral concentrations, O/N2, has been shown
to be an accurate tracer of ionospheric storm effects at sun-lit middle and high latitudes (e.g. Strickland et al., 2001; Mendillo et al., 2002), because O is the primary species re-sponsible for plasma production while N2 (along with O2)
is responsible for plasma loss. Observations near the equa-tor indicate that densities of all neutral species increase as a result of heating during a geomagnetic storm (e.g. Hedin et al., 1977; Mayr et al., 1978; Pr¨olss et al., 1988; Wiens et al., 2002) and composition changes are visible in O/N2,
especially when viewed on constant pressure surfaces (Burns et al., 1995). TADs that propagate from each pole converge at the equator and cause temperature increases via compres-sional heating that enhance neutral densities (Pr¨olss, 1993; Fujiwara et al., 1996; Pr¨olss and O˘cko, 2000) and perturb the ionosphere (Fesen et al., 1989).
Thermospheric densities have been extracted from sev-eral middle and high latitude observations of far ultravio-let (FUV) airglow and aurora (e.g. Strickland and Thomas, 1976; Meier and Anderson, 1983; Conway et al., 1988; Craven et al., 1994). Strickland et al. (1995) devised a method of using disk images of O I 135.6 nm and N2LBH
dayglow to measure column O/N2 down to a reference
al-titude that corresponds to a column N2 concentration of
1017cm−2. This technique has been used to analyze ther-mospheric changes in response to solar and geomagnetic activity (Drob et al., 1999; Strickland et al., 1999a, 2001) but does not provide information on the altitude profile.
3204 A. W. Stephan et al.: Middle ultraviolet remote sensing of the equatorial thermosphere
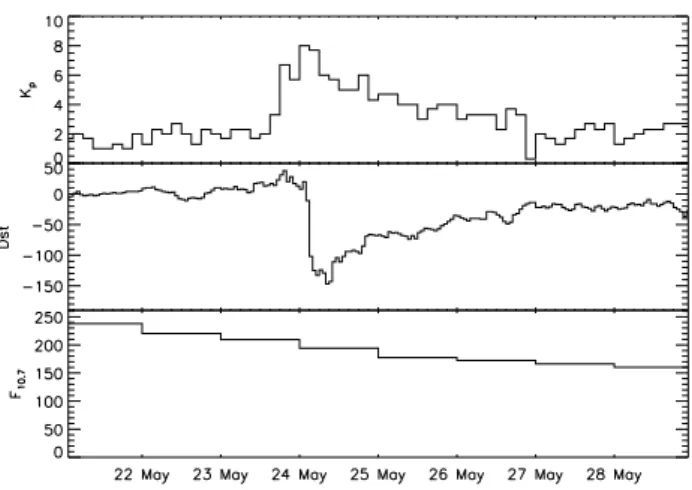
Fig. 1. Geomagnetic and solar indices for 21 May to 28 May 2000,
indicating the geomagnetic storm on 24 May. (Major ticks mark 0 UT for each day.)
Meier and Picone (1994) developed a method using discrete inverse theory to retrieve absolute concentrations of O, N2,
and O2from limb profiles of far ultraviolet airglow. Stephan
et al. (2003) adapted this technique to the middle ultraviolet by creating an airglow model of the O II 247.0 nm and N II 214.3 nm emissions.
The O II 247.0 nm emission is produced by the photoion-ization and excitation of thermospheric O by solar extreme ultraviolet radiation. The transition from the (2P) excited state to the (4S) ground state of O+ produces a doublet at 247.10 nm and 247.11 nm (vacuum wavelengths) (Mar-tin et al., 1993) that make up the emission we use for our study. Similarly, the N II 214.3 nm emission is produced by the photodissociation, ionization, and excitation of N2. The
transition from the (5S) excited state to the (3P) ground state of N+also produces a doublet, at 213.97 nm and 214.35 nm (Erdman and Zipf, 1986). Because of the short lifetimes of these excited states, an inversion of these emissions yields an altitude profile of the associated O and N2neutral species.
In this paper, we present an analysis of the thermospheric response to a geomagnetic storm using measurements of the 214.3 nm and 247.0 nm emissions. We outline the details of the observations in Sect. 2 and describe our analysis of the spectra required to remove contributions of unresolved nearby emissions from the lines of interest in Sect. 3. In Sect. 4 we present the resulting images, showing these emis-sion profiles and their changes during and after the storm. We also use the discrete inverse technique to retrieve ther-mospheric temperatures from the emission profiles to inves-tigate heating effects of the storm. In Sect. 5 we discuss our results and summarize our work.
2 Observations
Spectra containing the O II 247.0 nm and N II 214.3 nm emissions were taken by the Ionospheric Spectroscopy and Atmospheric Chemistry (ISAAC) experiment on the
Ad-vanced Research and Global Observation (ARGOS) satel-lite. ISAAC is a 1/8 m focal length, Ebert-Fastie spectro-graph with a 1/8 m focal length, off-axis parabolic telescope and an intensified plasma coupled device detector (Wolfram et al., 1999). ARGOS was launched on 23 February 1999, into a 850 km, circular, 97◦inclination, Sun-synchronous or-bit. The ascending node crossing time was approximately 14:10 LT. ISAAC obtained spectra of thermospheric airglow from May 1999 until October 2000, scanning the limb of the Earth in the wake of the spacecraft. The integration time for each spectrum was 1 s and a limb scan was completed in 140 s, including time to return to the starting zenith an-gle. The instrument field of view was 1.2◦along the horizon and 0.03◦perpendicular to the horizon. Each spectrum cov-ered a chosen 40 nm passband within the 180–330 nm spec-tral range, as determined by the position of the grating. A 210–250 nm passband was selected for the days studied here. Based on observations of isolated atomic lines, the spectral resolution was 0.4 nm.
To improve the signal-to-noise ratio of the measurements, we combined data from each orbit to form a single profile representing an average of the airglow between 20◦N and 20◦S latitude. We selected all data where the tangent point of the line of sight fell within these latitudes and ordered them according to zenith angle, creating a single composite pro-file of the equatorial airglow for each orbit. We then filtered the data to remove any anomalous spectra due to energetic particles, hot stars, or other features that were not represen-tative of pure airglow. In addition, we eliminated data where the detector became strongly nonlinear or saturated due to high count rates, typically corresponding to altitudes below 115 km.
We averaged the remaining spectra in groups of 10 to yield approximately 30 spectra between 120 km and the up-per bound above 300 km. This also provides a secondary benefit of improving any uncertainty in zenith angles and alti-tudes due to random errors in the instrument pointing control and knowledge. Although the magnitude of this uncertainty is not investigated in detail here, it is expected to be less than the approximate 7-km altitude resolution of the final profile. For this study we analyzed ISAAC data for the week of 21–28 May 2000. We chose this week because ISAAC was in the correct mode and a geomagnetic storm occurred in the middle of the week on 24 May. Figure 1 shows the Kp, Dst,
and F10.7 indices for this week. The storm commenced late on 23 May and peaked early on 24 May. Solar flux during this time was high, but monotonically decreasing through-out the week. We examine the data during this week to in-vestigate changes in the thermosphere and associated middle ultraviolet airglow from quiet to active geomagnetic condi-tions.
3 Fit to spectra
For each of the resulting spectra we fit 4 nm regions around 247 nm and 214 nm using the instrument lineshape function
Fig. 2. Sample ISAAC spectra for data near 168 km. (Top) Fit
to O II 247.0 nm doublet (red curves), including the N2VK (0,4)
band (green curve) peaking near 246.4 nm and the dim NO γ (0,2) band (blue curve). (Bottom) Fit to N II 214.3/213.9 nm doublet (red curves), including the N2 LBH band (green curve) visible near 212.9 nm and 214.8 nm and the brighter NO γ (1,0) band (blue curve) extending from 213 nm to 216 nm.
and a synthetic spectrum of the primary emissions in each spectral window. Samples of these fits are shown in Fig. 2. In the spectra near the O II 247.0 nm lines this required model-ing the NO γ (0,2) band and the N2Vegan-Kaplan (VK) (0,4)
band. The brightest contributors near the N II 214.3 nm lines were the NO γ (1,0) band and the (5,14) and (6,15) bands of the N2 Lyman-Birge-Hopfield (LBH) system. N2LBH and
VK spectra were taken from the Atmospheric Ultraviolet Ra-diance Integrated Code (AURIC) (Strickland et al., 1999b). Profiles of the NO bands were computed using the algorithms developed by Stevens (1995).
Any uniform background was subtracted from each spec-trum and a wavelength scale was calculated based on posi-tions of several features in the data. In each case, the mag-nitude of the NO and N2bands was adjusted to optimize the
fit to the spectrum at wavelengths where there is no contribu-tion from the O II or N II emissions. Changes were made to the temperature to adjust the shape of the molecular bands to optimize the fit. The NO γ (1,0) band near 214.3 nm shows
Fig. 3. Images of O II 247.0 nm intensity (top) and N II 214.3 nm
intensity (bottom) from 21–28 May 2000. Each pixel represents an average of 10 spectra gathered with the tangent point of the line of sight located between 20◦N and 20◦S latitudes.
the effects of self-absorption that can modify the shape of the observed spectrum (Stevens, 1995). A parameter was in-cluded to adjust this factor as needed. The contribution from these NO and N2bands are minor above altitudes of
approxi-mately 200 km. The remainder was fit by scaling the O II and N II emission lines convolved with the instrument lineshape. We made final adjustments to each parameter to improve the fit as determined by a standard χ2calculation between the modeled and measured spectra. The intensities of the O II and N II emissions were then calculated from the modeled profile. Uncertainties for each measurement were included from both statistical considerations of the data, as well as our ability to reproduce our fits to the spectra. We found that the fitting process introduced the largest error, estimated to be 15%.
4 Results
Figure 3 shows images of the O II 247.0 nm and N II 214.3 nm emissions for the week of 21–28 May 2000. Each
3206 A. W. Stephan et al.: Middle ultraviolet remote sensing of the equatorial thermosphere
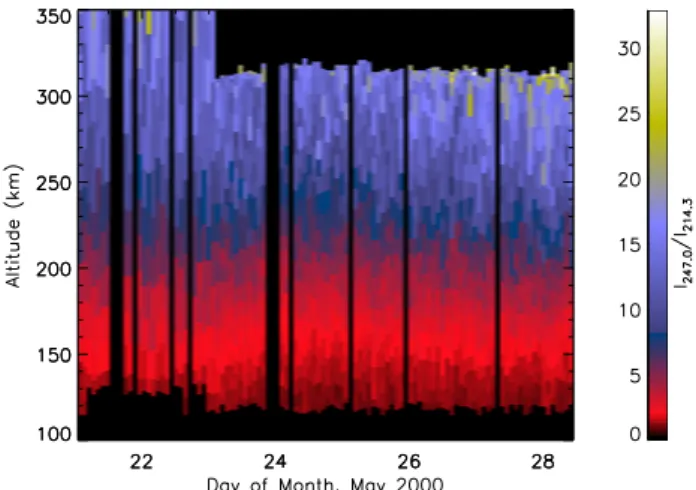
Fig. 4. Ratio of 247.0 to 214.3 nm intensities measured by ISAAC
and shown in the two images in Fig. 3.
altitude profile in an image is separated by approximately 100 minutes, the orbital period of ARGOS. Missing profiles indicate orbits where sufficient data could not be processed because of spectral contamination or noise. The altitude in each profile corresponds to the altitude of the tangent point of the line of sight to the surface of the Earth. A scheduled change in the altitudes scanned by ISAAC is visible on 23 May. The general trend in the O II emission seen in the top panel is an overall reduction in intensity with time, matching the decrease that would be expected based on the decrease in solar flux seen in Fig. 1. Shortly after the storm peak early on 24 May there is a marked brightening in the emis-sion that lasts for several orbits. The bottom panel shows the N II emission for this same period. This emission changes in a similar manner with a gradual overall decrease in intensity that is interrupted by a brightening during the storm on 24 May. Figure 4 shows a ratio of these two images. Since both emissions are produced by solar UV radiation, variations in this ratio reflect qualitative changes in the relative O to N2
concentrations. Because of the difference in scale heights between the species, the fraction of O becomes increasingly larger at higher altitudes. Contours of similar intensity ratios, indicated by color in the image, are at steady or falling alti-tudes until the storm begins. As the storm peaks, regions of lower O/N2rise up to higher altitudes. After the storm, these
contours show a gradual return to the conditions seen prior to the storm.
Figure 5 shows two slices through Fig. 4 at altitudes of 200 and 280 km. The larger uncertainties at 200 km are a result of the bright molecular features that have been fit and removed as part of the spectral fitting described in Sect. 3. For com-parison, we have used a forward model of the two emissions (Stephan et al., 2003) to create the expected intensity ratio given the solar and geophysical conditions. This model com-bines a thermosphere from the NRL Mass Spectrometer In-coherent Scatter model (NRLMSISE-00, hereafter abbrevi-ated as MSIS) (Picone et al., 2002) with a method to rapidly compute the population rate of the excited state relevant to
each emission, or g factor, based on solar zenith angle, solar F10.7, and the column density of neutrals (Strickland et al., 1997). Our model uses the solar and geomagnetic indices, representing the conditions of each observation, to calculate a neutral atmosphere, excitation rate, and integrated intensity along the line of sight. Prior to the storm the ratio is rising in response to the decrease in the solar flux and the associated cooling of the thermosphere. As the storm begins there is a decrease in the ratio of the two emissions, although Fig. 3 shows that both emissions are brightening. The decrease in the observed ratio is not seen in the ratios compiled using our forward model. After the main phase of the storm there is a general return to the expected increase of the intensity ra-tio, although disagreements between the forward model and ISAAC measurements remain.
Discrete inverse theory (DIT) offers a method of using the full altitude profile of each emission to further explore the details of these changes (Meier and Picone, 1994; Stephan et al., 2003). Each limb scan offers information on concen-trations and temperature through both the relative magnitude and the shape of the emission altitude profiles. Our imple-mentation of DIT adjusts the nominal MSIS concentration profiles and temperatures, as well as g factors, to achieve an optimal fit to the observed data. Uncertainties are propa-gated through the inversion as described by Meier and Picone (1994). For the ISAAC observations, the 15% uncertainties ascribed to the data through our process of fitting the spectra combine with the lack of information below 120 km, where the N II emission peaks to result in uncertainties in absolute concentrations of each species that are 50% or larger. Thus, those results are not informative and we will not report on them here. Thermospheric temperatures that are returned si-multaneously are more dependent on the slope of the profiles above 150 km and can be specified more accurately. Simula-tions have shown that an inversion result using the DIT algo-rithm is insensitive to the initial guess within the uncertainty retrieved from the process (Meier and Picone, 1994; Stephan et al., 2003). Although we have not comprehensively tested that assumption here, spot checks on several profiles with a variety of reasonable alternative inital guesses confirmed this result.
Figure 6 shows the temperatures at 280 km, where the at-mosphere is essentially isothermal, as returned by the inver-sion of the emisinver-sion profiles measured by ISAAC. Temper-atures from MSIS for the week are shown for comparison. Prior to and through the main phase of the storm, tempera-tures are in agreement with the MSIS model, despite the fact that the measured intensity ratios are different from those de-rived using MSIS. On 25 May, when the storm has ended its fast recovery phase, a divergence from MSIS tempera-tures appears. There is also a strong diurnal variation that appears to match MSIS predictions in phase but not magni-tude. This pattern demonstrates an anticorrelation to modu-lation seen in the expected intensity ratio calculated from the forward model and shown in Fig. 5. These are expected due to changes in universal time and the motion of the observed geographic equator relative to the geomagnetic pole. This
Fig. 5. Slices through Fig. 4 at 200 km (top) and 280 km (bottom).
Solid line represents expected intensity ratio at this altitude using the neutral thermosphere provided by the MSIS model for the con-ditions on each day. The uncertainties due to the fitting and removal of nearby N2and NO molecular bands, which are brighter at lower
altitudes, are reflected in the uncertainties in these line intensity ra-tios.
pattern is not strongly correlated to the modulation seen in the ISAAC data, which still demonstrates reductions in the intensity ratio near 12 UT each day.
5 Discussion and summary
The response of the equatorial thermosphere to the geomag-netic storm of 24 May 2000, is visible in the ISAAC MUV remote sensing data. The data show increases in both the O II 247.0 nm and the N II 214.3 nm emissions during the storm, indicating an increase in both O and N2. Since these
emis-sions are tracers of thermospheric O and N2, the ratio of the
emissions can be used as a relative measure of changes in the O/N2 concentration ratio. ISAAC data agree with data
derived from MSIS until the onset of the storm, when the measured intensity ratio is smaller than expected. The dif-ference is largest in the two days after the peak of the storm,
Fig. 6. Thermospheric neutral temperature derived from inversion
of the emission intensity profiles in Fig. 3.
although full agreement between the model and data is not fully reestablished even after four days.
The difference is not completely explained by the heating effects of the storm. Temperatures derived from the emission profiles are still in agreement with MSIS nearly 24 h after the storm peaks and the intensity ratios begin to deviate from expected values. Modulation in the intensity ratio is also not correlated to changes in the observed temperatures.
Another process appears to be impacting the relative com-position of the equatorial thermosphere during the storm. Burns et al. (1995) found that while storm-time changes in O/N2at low to middle latitudes generally were negative on
constant height surfaces, no predictable patterns were seen. They observed a 20% drop in O/N2near 20◦latitude during
a storm on 6 September 1982, but also saw increased and un-changed ratios during different storms. In addition to these mixed observations, they noted that the correlation to tem-peratures was poor and another mechanism, such as vertical winds or tidal upwelling, was needed to explain the data. Our results show a maximum decrease of nearly 20% during the storm that does not appear to be correlated to temperature changes, in support of the observations and conclusions of Burns et al. (1995).
Unfortunately, the low temporal resolution and back-ground noise during the peak of the storm have made it im-possible to obtain any other information that might be related to the timing of the changes or the rapid propagation of grav-ity waves and tides from the poles to the equator. However, a decrease is apparent in Fig. 5 with the last data point on 23 May, just before the gap in the data corresponding to the peak of the storm. This time would be consistent with the propagation time for waves to reach the equator. The contin-ued fluctuations in O/N2immediately after the storm,
how-ever, suggest a source that is not as transient. We also cannot rule out the possibility that multiple effects are causing the changes seen in the ISAAC data. Winds or tides may initiate the changes seen during 24 May, where temperatures are in agreement with MSIS. Discrepancies between the model and
3208 A. W. Stephan et al.: Middle ultraviolet remote sensing of the equatorial thermosphere the data after that could be explained by the difference in the
observed and MSIS temperatures.
This work represents the first study using middle ultravi-olet emissions for the remote sensing of long-term thermo-spheric changes. The strength of the analysis presented here is constrained largely by the spectral resolution of the instru-ment that necessitates detailed fitting and modeling to extract the O II 247.0 nm and N II 214.3 nm emissions.
We have used data from the ISAAC experiment to examine changes in thermospheric composition at 14:10 LT during a geomagnetic storm. We have found that for the storm of 24 May 2000, the equatorial concentrations of both O and N2
in-creased, but the ratio O/N2decreases compared to expected
values during and after the storm. These changes are not en-tirely correlated with temperature changes retrieved from the inversion of the emission profiles and suggest atmospheric transport from other altitudes and latitudes.
Acknowledgement. This work is supported by the Office of Naval
Research. We are grateful to R. R. Meier for helpful discussions and comments.
Topical Editor U.-P. Hoppe thanks A. Burns for his help in eval-uating this paper.
References
Burns, A. G., Killeen, T. L., Deng, W., Carignan, G. R., and Roble, R. G.: Geomagnetic storm effects in the low- to middle-latitude upper thermosphere, J. Geophys. Res., 100(A8), 14 673–14 691, 1995.
Conway, R. R., Meier, R. R., and Huffman, R. E.: Satellite ob-servations of the OI 1304, 1356, and 1641 ˚A dayglow and the abundance of atomic oxygen in the thermosphere, Planet. Space Sci., 36, 963–973, 1988.
Craven, J. D., Nicholas, A. C., Frank, L. A., Strickland, D. J., and Immel, T. J.: Variations in the FUV dayglow after intense auroral activity, Geophys. Res. Lett., 21(25), 2793–2796, 1994. Drob, D. P., Meier, R. R., Picone, J. M., Strickland, D. J., Cox, R. J.,
and Nicholas, A. C.: Atomic oxygen in the thermosphere during the July 13, 1982, solar proton event deduced from far ultraviolet images, J. Geophys. Res., 104(A3), 4267–4278, 1999.
Erdman, P. W. and Zipf, E. C.: Dissociative excitation of the N+(5S) state by electron impact on N2: Excitation function and quenching, J. Geophys. Res., 91(A10), 11 345–11 351, 1986. Fesen, C. G., Crowley, G., and Roble, R. G.: Ionospheric effects at
low latitudes during the 22 March, 1979, geomagnetic storm, J. Geophys. Res., 94(A5), 5405–5417, 1989.
Fujiwara, H., Maeda, S., Fukunishi, H., Fuller-Rowell, T. J., and Evans, D. S.: Global variations of thermospheric winds and tem-peratures caused by substorm energy injection, J. Geophys. Res., 101(A1), 225–239, 1996.
Hedin, A. E., Bauer, P., Mayr, H. G., Carignan, G. R., Brace, L. H., Brinton, H. C., Parks, A. D., and Pelz, D. T.: Observations of neutral composition and related ionospheric variations during a geomagnetic storm in February 1974, J. Geophys. Res., 82(22), 3183–3189, 1977.
Martin, W., Kaufman, V., and Musgrove, A.: A compilation of energy-levels and wavelengths for the spectrum of singly-ionized oxygen (O-II), 22(5), J. Phys. Chem. Ref. Data, 1179–1212, 1993.
Mayr, H. G., Harris, I., and Spencer, N. W.: Some properties of up-per atmosphere dynamics, Rev. Geophys., 16, 1209–1223, 1978. Meier, R. R. and Anderson Jr., D. E.: Determination of atmospheric composition and temperature from the UV dayglow, Planet. Space Sci., 31, 967–976, 1983.
Meier, R. R. and Picone, J. M.: Retrieval of absolute thermospheric concentrations from the far UV dayglow: An application of dis-crete inverse theory, J. Geophys. Res., 99(A4), 6307–6320, 1994. Mendillo, M., Rishbeth, H., Roble, R. G., and Wroten, J.: Mod-elling F2-layer seasonal trends and day-to-day variability driven by coupling with the lower atmosphere, J. Atmos. Solar-Terr. Phys., 64, 1911–1931, 2002.
Picone, J. M., Hedin, A. E., Drob, D. P., and Aikin, A. C.: NRLMSISE-00 empirical model of the atmosphere: Statistical comparisons and scientific issues, J. Geophys. Res., 107(A12), 1468, doi:10.1029/2002JA009430, 2002.
Pr¨olss, G. W.: Magnetic storm associated perturbation of the up-per atmosphere – recent results obtained by satellite-borne gas analyzers, Rev. Geophys., 18(1), 183–202, 1980.
Pr¨olss, G. W.: Common origin of positive ionospheric storms at middle latitudes and the geomagnetic activity effect at low lati-tudes, J. Geophys. Res., 98(A4), 5981–5991, 1993.
Pr¨olss, G. W. and O˘cko, M.: Propagation of upper atmospheric storm effects towards lower latitudes, Adv. Space Res., 26(1), 131–135, 2000.
Pr¨olss, G. W., Roemer, M., and Slowey, J. W.: Dissipation of solar wind energy in the earth’s upper atmosphere: the geomagnetic activity effect, Adv. Space Res., 8(5/6), 215–261, 1988. Stephan, A. W., Meier, R. R., Dymond, K. F., Budzien, S. A.,
and McCoy, R. P.: Quenching rate coefficients for O+(2P) de-rived from middle ultraviolet airglow, J. Geophys. Res., 108(A1), 1034, doi:10.1029/2002JA009540, 2003.
Stevens, M. H.: Nitric oxide γ band fluorescent scattering and self-absorption in the mesosphere and lower thermosphere, J. Geo-phys. Res., 100(A8), 14 735–14 742, 1995.
Strickland, D. J. and Thomas, G. E.: Global atomic oxygen den-sity derived from Ogo-6 1304 ˚A airglow measurements, Planet. Space Sci., 24, 313–326, 1976.
Strickland, D. J., Evans, J. S., and Paxton, L. J.: Satellite remote sensing of thermospheric O/N2and solar EUV 1. Theory, J.
Geo-phys. Res., 100(A7), 12 217–12 226, 1995.
Strickland, D. J., Majeed, T., Evans, J. S., Meier, R. R., and Pi-cone, J. M.: Analytic representation of g factors for rapid, accu-rate calculation of excitation accu-rates in the dayside thermosphere, J. Geophys. Res., 102(A7), 14 485–14 498, 1997.
Strickland, D. J., Cox, R. J., Meier, R. R., and Drob, D. P.: Global O/N2 derived from DE-1 FUV imaging dayglow data:
Tech-nique and examples from two storm periods, J. Geophys. Res., 104(A3), 4251–4266, 1999a.
Strickland, D. J., Bishop, J., Evans, J. S., Majeed, T., Shen, P. M., Cox, R. J., Link, R., and Huffman, R. E.: Atmospheric Ultravi-olet Radiance Integrated Code (AURIC): theory, software archi-tecture, inputs, and selected results, J. Quant. Spec. Rad. Trans., 62, 689–742, 1999b.
Strickland, D. J., Craven, J. D., and Daniell Jr., R. E.: Six days of thermospheric-ionospheric weather over the northern hemi-sphere in late September 1981, J. Geophys. Res., 106(A12), 30 291–30 306, 2001.
Wiens, R. H., Bhatnagar, V. P., and Thuillier, G.: Geomagnetic storm heating effects on the low-latitude dayside thermosphere from WINDII observations at equinox, J. Atmos. Solar-Terr. Phys., 64, 1393–1400, 2002.
Wolfram, K. D., Dymond, K. F., Budzien, S. A., Fortna, C. B., Mc-Coy, R. P., and Bucsela, E. J.: The Ionospheric Spectroscopy and Atmospheric Chemistry (ISAAC) experiment on the Advanced Research and Global Observing Satellite (ARGOS): Quick look
results, in Proc. of the SPIE, Ultraviolet Atmospheric and Space Remote Sensing: Methods and Instrumentation II, edited by Car-ruthers, G. R. and Dymond, K. F., vol. 3818, pp. 149–159, 1999.