HAL Id: hal-02560418
https://hal.univ-lorraine.fr/hal-02560418
Submitted on 1 May 2020HAL is a multi-disciplinary open access archive for the deposit and dissemination of sci-entific research documents, whether they are pub-lished or not. The documents may come from teaching and research institutions in France or abroad, or from public or private research centers.
L’archive ouverte pluridisciplinaire HAL, est destinée au dépôt et à la diffusion de documents scientifiques de niveau recherche, publiés ou non, émanant des établissements d’enseignement et de recherche français ou étrangers, des laboratoires publics ou privés.
On the Use of Aeromagnetism for Geological
Interpretation: 2. A Case Study on Structural and
Lithological Features in the Northern Vosges
Bertrand Lionel, B. Gavazzi, J. Mercier de Lépinay, M. Diraison, Yves
Géraud, M. Munschy
To cite this version:
Bertrand Lionel, B. Gavazzi, J. Mercier de Lépinay, M. Diraison, Yves Géraud, et al.. On the Use of Aeromagnetism for Geological Interpretation: 2. A Case Study on Structural and Lithological Features in the Northern Vosges. Journal of Geophysical Research : Solid Earth, American Geophysical Union, 2020, 125, pp.e2019JB017688. �10.1029/2019JB017688�. �hal-02560418�
This article has been accepted for publication and undergone full peer review but has not been through the copyediting, typesetting, pagination and proofreading process which may lead to differences between this version and the Version of Record. Please cite this article as doi: 10.1029/2019JB017688
Bertrand Lionel (Orcid ID: 0000-0003-2068-7519) Gavazzi Bruno (Orcid ID: 0000-0002-0960-1174)
Mercier de Lépinay Jeanne (Orcid ID: 0000-0001-5246-7882) Geraud Yves (Orcid ID: 0000-0002-2352-3045)
On the use of aeromagnetism for geological interpretation part II: a case study on
structural and lithological features in the Northern Vosges.
L. Bertrand1, B. Gavazzi2, J. Mercier de Lépinay2, M. Diraison1, Y. Géraud1 and M.
Munschy2
1 Université de Lorraine, CNRS, GeoRessources, F-54000 Nancy, France
2 Institut de Physique du Globe de Strasbourg (IPGS) ; UMR 7516 ; Université de
Strasbourg/EOST, CNRS ; 1 rue Blessig, F-67084 Strasbourg Cedex. Corresponding author: Lionel Bertrand ([email protected])
Key Points:
New aeromagnetic surveys bring new constraints on the in-depth structure of basement rocks in the Northern Vosges (France).
The organization in vertical bands with an ENE-WNW direction of the magmatic and metamorphic units is supported by the magnetic anomalies.
Modelling indicates a high level of compartmentalization of the basin faults by the secondary fault network.
Abstract
In many grabens of the West European Rift System, several drilling projects are targeting fluid conductive faults to produce electricity with geothermal energy. In order to reach the adequate temperatures, the targeted faults are located in the basement rocks or at the basement/cover interface. Unfortunately, the basement rock facies and structural data useful for reservoir modelling are often poorly constrained because of the lack of boreholes deeper than 2000 m and seismic information on the deep subsurface. With the aim to outline the basement structure in the Upper Rhine Graben, two aeromagnetic surveys were conducted where the basement outcrops in the Northern Vosges, with different flight parameters and types of magnetometers. An interpolator using equivalent sources for gridding these two surveys is described by Gavazzi et al. (this issue). Here, we describe the geological interpretation of these surveys. We demonstrate the consistency between the total magnetic field intensity and the outcropping lithological units organized in ENE-WSW subvertical bands. In detail, three main blocks were delineated, separated by N-S faults linked to the graben formation and ENE-WSW inherited Hercynian faults. The latter faults, together with more local NE-SW and NW-SE faults compartmentalize the N-S oriented basement rocks. This is relevant for geothermal prospection where the N-S faults are the main targets because fluid flow through other fault systems is deemed restricted. With a focus on the interface between the Northern Vosges and the Upper Rhine Graben, we also demonstrate considerable segmentation on the main graben boundary faults.
1 Introduction
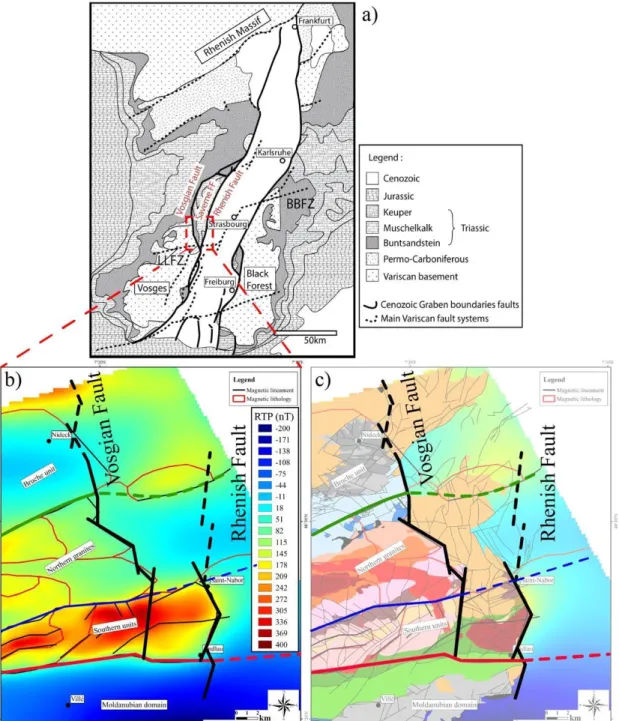
The West European Rift System is composed of several grabens in Western Europe from the late Eocene to the Miocene Epochs (Figure 1a). Theses grabens, especially the Upper Rhine Graben (URG), are the targets of several drilling projects for geothermal high temperature energy production (Boissavy et al., 2016). In fact, the thinned upper crust and/or associated volcanism create a favourable thermal gradient and the structural features of the grabens allow natural hot fluid flow (Bailleux, 2012; Brun et al., 1992; Freymark et al., 2017; Genter et al., 2004; Jung, 1999). However, temperatures adequate for electricity production (>150°C) are reached at more than 3000 m depth and therefore in the basement rocks of the grabens. Thus, the structural features and the reservoir properties of these rocks are key information for the evaluation of the suitability of each drilling project. Unfortunately, these are almost unknown due to the lack of deep boreholes and to the poor information given by classical seismic investigations in magmatic or metamorphic rocks (Khair et al., 2015).
One way to obtain valuable data for resource exploitation is to study outcrop analogues of the basement rocks at the shoulders of the rift and to extrapolate their properties in the adjacent basin (McCaffrey et al., 2003). However, this method is based on the assumption of the continuity of rock facies and the structural settings from outcrop to depth. In the central part of the URG, previous gravimetric and magnetic data have highlighted the continuity of basement facies from the shoulder to the basin (Edel & Schulmann, 2009; Edel et al., 2013) (Figure 1b). However, these data show only first order faults and main basement units. They cannot be used to assess potential variations in rock facies. Data on the second order faults, with typically few kilometres length and few hundred metres of throw, targeted in the geothermal drilling projects, are also missing. Therefore, two different aeromagnetic surveys were conducted in the Northern Vosges and the URG at the proximity of the western graben boundary where the basement rocks outcrop. The two surveys have different acquisition parameters: survey 1 is at a fixed altitude of 900 m conducted by Institut de Physique du Globe de Strasbourg (IPGS) with a three-component fluxgate magnetometer system mounted on a
plane. Survey 2 is draping at constant height above the ground and conducted by Geophysics GPR International Inc. with a scalar cesium magnetometer system mounted on a helicopter. A specific method based on an equivalent source interpolator for merging and gridding the data from the two surveys was developed and is detailed in Gavazzi et al. (this issue).
The aim of this paper is to use these surveys in the Northern Vosges to compare the magnetic anomalies with the geological outcropping data, in order to give new constraints on the subsurface geology of the Northern Vosges. New considerations on the extent of the basement lithologies from the outcropping area under the URG sedimentary cover and the structure of the first order faults will be shown. It will also allow to discuss the distribution of the second order faults at the outcrop, which can be a proxy for the deep structures targeted by the geothermal drilling projects.
2 The Northern Vosges geological and magnetic background
The basement rocks of the URG are composed of different units that correspond to different lithotectonic domains from the Hercynian orogeny that occurred between 360 and 300 Ma (Skrzypek et al., 2014). In the Northern Vosges, different units outcrop in E-W to ENE- WSW trending bands partly covered by Permian and Triassic sediments (Figure 2). Bounded to the South by the Lalaye-Lubine Fault Zone (LLFZ) that separates the Northern Vosges from the Central Vosges, they are composed of: 1) The Steige-Villé schists, 2) the « Champ-du- Feu » (CdF) magmatic massif and 3) the metamorphosed volcano-sedimentary Bruche and Rabodeau-Schirmeck (RS) units. The different rock facies are detailed below and the mean magnetic susceptibilities (K) measured on samples are summarized in Table 1.
2.1 The Steige and Villé schists
The Steige and Villé schists are Cambrian to Silurian pelitic sediments with tuff intercalations metamorphosed in greenschist-facies conditions (Reitz and Wickert, 1989; Skrzypek et al., 2014). At the contact with the CdF massif, the Steige schists have suffered contact metamorphism that can locally lead to K values around 10 to100·10-3 SI, whereas the whole formation has lower values around 0.1·10-3 SI (Edel et al., 1986).
2.2 The Champ-du-Feu magmatic massif
The first intrusion of the magmatic massif is the so-called Southern unit with various facies of diorites and granodiorites emplaced at 334 ± 5 Ma in ENE-WSW trending bands (Cocherie, 2007; Elsass et al., 2008). Except for some local quartz-diorite facies, the total magnetic Susceptibility K measured on cored outcrop samples of these facies show high K values exceeding 1 to 10·10-3 SI (Edel et al., 1986; Taktak & Lauer, 1972). The Northern granites are the Fouday, Waldersbach and Belmont granites, emplaced after the Southern unit, at 319 ± 3 Ma (Cocherie, 2007; Hess et al., 1995). These granites have K values lower than 1·10-3 SI (Edel et al., 2013). Two magmatic events occurred later and crosscut the ENE-WSW « band-type » intrusions: the sub-circular shaped Senones, Natzwiller and Andlau granites, and the peraluminous fault related intrusions of the Kreuzweg and Kagenfels granites. The peraluminous intrusions, dated at 299 ± 7 Ma, mark the end of the plutonic activity (Boutin et al., 1995) and shows K values around 0.1·10-3 SI (Edel et al., 1986). Through a study of Curie
temperatures of samples, Edel et al. (2013) show that the magnetic susceptibility in the whole massif is mostly carried by magnetite, with a small contribution from hematite in the northern and the younger granites.
2.3 The Bruche and Rabodeau-Schirmeck units
The Bruche unit is a volcano-sedimentary unit composed of various detrital sediments and sparse carbonate lenses intruded by bimodal volcanism. In outcrop, the main volcanic intrusion is recognized as the RS unit (Elsass et al., 2008; Skrzypek et al., 2014). These units have both suffered Barrovian type metamorphism during the Hercynian compression and outcrop at the North of the CdF massif and in the western part around the Senones granite (Figure 2). The magnetic susceptibilities of these units can reach 10·10-3 SI for the volcanic
facies whereas the sedimentary facies have weaker magnetic susceptibilities at about 0.1·10-3 SI (Edel et al., 2013).
2.4 Structural settings
After the Hercynian orogeny tectonics, the basement rocks and their structural features were reactivated by several tectonic events. From the Pennsylvanian Epoch to Permian Period, the orogenic collapse led to the formation of the Villé, Saint-Dié, Champenay and Nideck basins, mainly composed of clastic sediments intercalated with rhyolites especially in the Nideck basin (Boutin et al., 1995; Schumacher, 2002; Ziegler et al., 2006) (Figure 2). During the Triassic and Jurassic periods, the sedimentation area progressively enlarges in this part of Europe (Bourquin et al., 2006; Guillocheau et al., 2000; Sissingh, 2001). The West European Rifting began at the end of the Eocene Epoch in response to the Alpine collision, with a main E-W extension phase during the Oligocene Epoch followed by NW-SE transtension during the Miocene Epoch (Bourgeois et al., 2007; Dèzes et al., 2004; Ford et al., 2007; Vergés et al., 2002).
While the relative influence of these different tectonic events on the fault network is not precisely constrained in the basement rocks, four sets of fault directions are recognized: N- S, NE-SW, ENE-WSW and NW-SE (Figure 2). These sets, with their current spatial arrangement (density, length, orientation distributions) separate the Northern Vosges in three first-order structural blocks: Western, Northern and Central blocks (Bertrand et al., 2018). Whether the Western block is clearly separated from the others by the Saales fault, the structure that separates the Central and the Northern blocks, remains unclear.
3 Aeromagnetic data interpretation
The area was covered by two surveys with different parameters. The first survey was conducted in 2008 by IPGS with a fluxgate vector magnetometer system mounted on a Maule MX7 airplane. The survey covers an area of 600 km2 with N-S profiles set every 500 m and E-
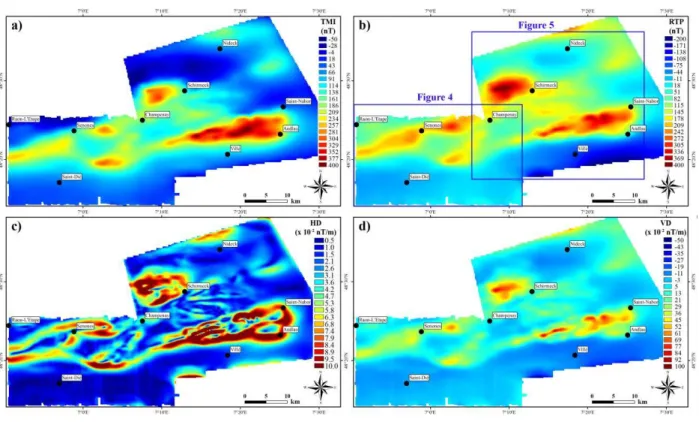
W tie lines set every 2000 to 3000 m at a fixed altitude of 900 m above sea level. The second survey was conducted in 2015 by Geophysics GPR International Inc as a commercial survey for Fonroche Géothermie. The survey is conducted with a cesium magnetometer mounted on an AS 350 Ecureuil helicopter over an area of 924 km2 with profiles set every 400 m and tie lines set every 4000 m at a level draping the topography at a distance of 300 m. The combination of the two aeromagnetic surveys and the application of potential field transforms are computed using an equivalent source method described in Gavazzi et al. (this issue). It permits to take into account the different parameters of both surveys, especially the variations of altitude and distance to the ground and to combine datasets with different position settings or navigation errors. In comparison to classical merging methods, more accurate potential field transforms of non-fixed-level datasets are calculated (Gavazzi et al. (this issue)). Figure 3 shows the two magnetic grids computed at 1400 m above mean sea level, which corresponds to 300 m above the highest topographic point and is aimed to assess the deeper features:
anomalies of the total magnetic field intensity (TMI), reduction to the pole (RTP), horizontal and vertical derivatives of the RTP (HD - VD). TMI shows the raw magnetic anomaly, i.e. the magnetic signal after all basic corrections (magnetic compensation, time dependent variation, IGRF12 (Thébault et al., 2015)). Strictly speaking, magnetization cannot be inferred from TMI measurements only, because it is a vector with three independent directions and a norm. As the Koenigsberger ratio has been measured to be under 0.5 for most of the studied units (Edel et al., 2018), all the materials' magnetization is considered as induced with no remanent component. This means the direction of the magnetization is known (in the direction of the regional magnetic field in this area) and the norm of the magnetization is only proportional to the susceptibility of each lithological unit. For a few units however, this hypothesis might be debatable: such cases are discussed in the models. The magnetic susceptibility anisotropy is also neglected because it is generally low. Edel et al. (2013) give anisotropy values < 1.1 or in a few cases < 1.2. With these assumptions, TMI does inform on the presence of variations of magnetization that can be interpreted as lithological or structural contacts or units but does not give direct information on the precise position or depth of such sources. We define in this paper the magnetic anomalies either as Magnetic Lineament when interpreted as structural contacts that have a main linear component or as Magnetic Lithology when interpreted as lithological contacts when the geometry is more diffuse or irregular. Maxima of RTP give the horizontal position of the sources of which the remanent magnetization can be considered negligible compared to its induced magnetization (Baranov, 1957). HD and VD highlight vertical and horizontal gradients of RTP and enhance respectively smaller and/or shallower sources and horizontal limits of sources. Because they highlight small wavelength variations of the signal, HD and VD also reduce the signal/noise ratio. This effect is usually stronger for VD of aeromagnetic data. Depending on the study, fractional order derivatives can be chosen to find a compromise between enhancement of features and reduction of signal/noise ratio (Cooper and Cowan, 2003). In this study, a fractional VD is applied at the order of 0.5.
The RTP map shows a clear distinction between the CdF massif (K values 1 to 10·10
-3) and both the Steige-Villé schists (K values 0.1·10-3 but locally higher) and Moldanubian
domain (K values unknown) (Table 1). The contact is well marked by a large wavelength anomaly with local maximal values over 400 nT (Figure 3). The Moldanubian domain corresponds roughly to negative values below -50 nT in the whole outcropping area and below the Saint-Dié and Villé basins. Such a large wavelength can only be explained by deep a structure or contact. In the northern part, the lithological ENE-WSW bands are recognizable with positive values corresponding to the Southern unit of the CdF (K values 1 to 10·10-3), negative values corresponding to the Northern granites (K values 0.1 to 1·10-3) and positive values where the Bruche (K values 0.1·10-3) and RS unit (K values 10·10-3) outcrop.
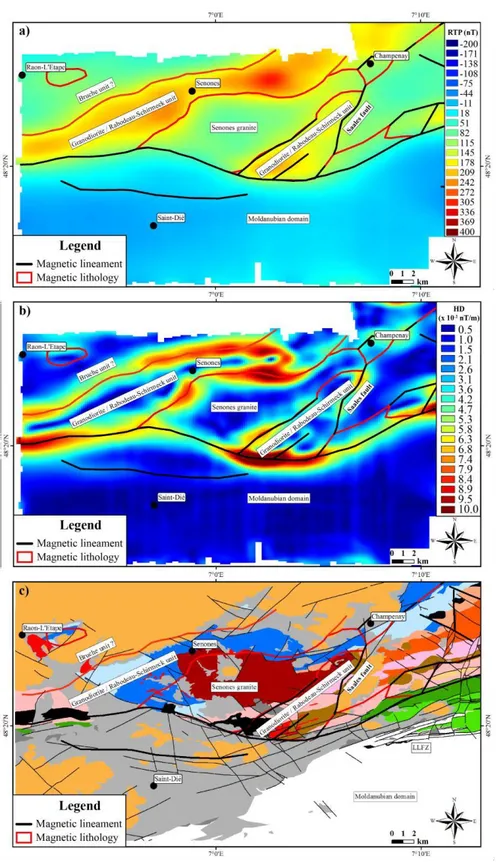
3.1 The Western block
As shown on the general map, the Southern delimitation of the Western block is the most prominent anomaly linked to the fault that constitutes the boundary between the Steige- Villé schists and CdF. This anomaly follows the limit between the basement and the Saint-Dié Basin in the area (Figure 4). Thus, it highlights the link between the basin structure and the underlying basement contact. The Saales fault that delimits the Western block from the others is highlighted in the data by another magnetic lineament that fits the fault trace on the geological map (Figure 4). In this block, the Senones granite can easily be identified on the RTP map by a local minimum (negative values) surrounded by two maxima (positive values) linked to the outcropping Granodiorite and RS unit. Finally, the northwestern part of the map
with the Permo-Triassic sediments shows negative values, with a small positive value that fits well with the outcrop of basalts attached to the Bruche unit (Elsass et al., 2008).
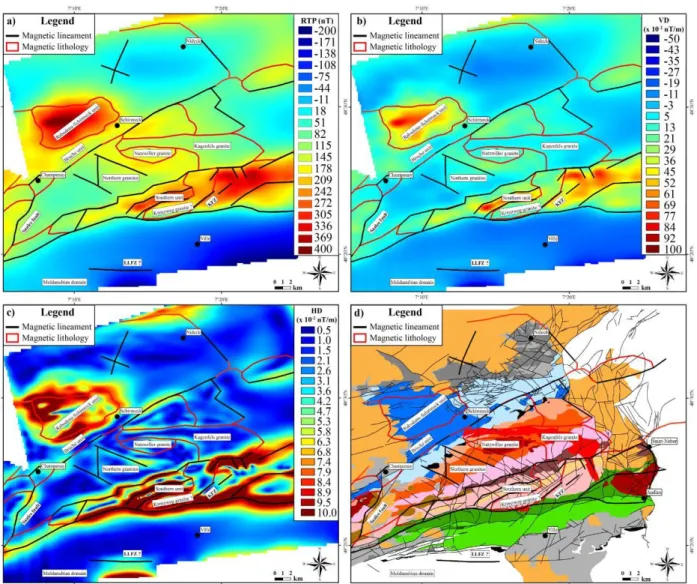
3.2 The Central block
The Central block is roughly composed of the Southern unit corresponding to positive values over 200 nT on the RTP map and the Northern granites showing lower values (Figure 5). At the south of the block, the limit marked by the horizontal gradient is clearly in accordance with the Granodiorite and Steige-Villé schists interface. However, at the eastern side of the Kreuzweg Fault Zone (KFZ), this magnetic limit is progressively shifted to the South in comparison to the outcrop. This supports a tectonic decoupling on this fault zone with a strike slip mode and a subvertical contact at the west and a thrust at the east with a dip to the South, as mentioned by Elsass et al. (2008).
The boundary between the Southern unit and the Northern granites is marked by local maxima on the HD map that fit the outcrop. The limit between the two lithologies is highly segmented by N-S, NE-SW and ENE-WSW lineaments that also fit with identified faults on the geological map even when the lateral offset is mainly controlled by NW-SE faults rather than by N-S and NE-SW faults.
In the northern part of the block, the magnetic contact with the Northern block is shifted to the northwest in comparison to the outcrops of the Northern granites and the Bruche unit (Figure 5b & d). This contact is almost straight and not segmented by the NW-SE and N-S faults. These observations are in favor of a NW-dipping tectonic contact of these units that bounds the N-S and NW-SE second order faults from the Central block.
In the Central block, the boundary between the Kagenfels and the other granites can be identified on the HD map (Figure 5a, b & c). It is not the case between the Kagenfels and Southern unit (Figure 5d). In fact, this is in agreement with the rock facies showing shallower crystallization conditions for the Kagenfels granite in the South than in the North (Elsass et al.,
2008). On the HD map, some N-S and NW-SE lineaments can be observed in the granites.
They correspond to strike-slip faults at the outcrops in a similar way to the KFZ in the Southern unit.
3.3 The Northern block
At the North of the ENE-WSW magnetic interface with the Central block, the RS unit corresponds on the RTP map to positive values with a maximum about 400 nT, surrounded by negative values corresponding likely to the Bruche unit. The magnetic contrasts interpreted as the limits of the RS unit give a surface larger than the surface given by the outcropping geological limits. This suggests that the extent of this eruptive area decreases with depth. At the northern corner of the map, a second unit corresponding to positive values is observed under the Triassic cover but is difficult to interpret because it is not entirely covered by the survey.
4 Discussion
The aeromagnetic data and geological map show a good general correlation and allow the comparison between the outcropping units and their in-depth continuity. The superposition of magnetic lineaments and outcrop data can be interpreted as the evidence of almost vertical structural or lithological contacts, namely between the Steige-Ville schists and the CdF massif, while the shift between both types of lineaments at the contact between the CdF massif and the
Northern unit provides information about its dip-direction. In addition, the interpretation is focused on: 1) the large-scale units and the LLFZ and 2) the structural limit between the northern Vosges and the URG.
In order to understand the sources of the main anomalies linked to these features four magnetic profiles are extracted from the grid. Then a magnetization model is set using the geological map and magnetic susceptibility values given by the literature (Edel et al., 1986, 2013; Taktak & Lauer, 1972) (Table 1). The obtained magnetic anomaly generally does not fit the data because of the unknowns linked to in-depth susceptibility variations. Therefore, in the forward modelling the shape of the magnetized bodies is varied iteratively to explain the data best. The goal is not to match exactly the magnetic data because the perfect fit is beyond the resolution of the study and of the dataset. Moreover, magnetic modelling is very under- determined and various models can explain the same set of data. Hence, the modelled profiles are not exact representations of the considered geological sections at depth; however, they do give general estimations of the structural trends like burial direction or the presence of faults, so the results are integrated in the structural interpretation.
Due to the ENE-WSW orientation of the lithological bands, a simple block per unit can be used in the N-S cross section whereas only one unit corresponding to a single lithological band can be considered in the E-W sections.
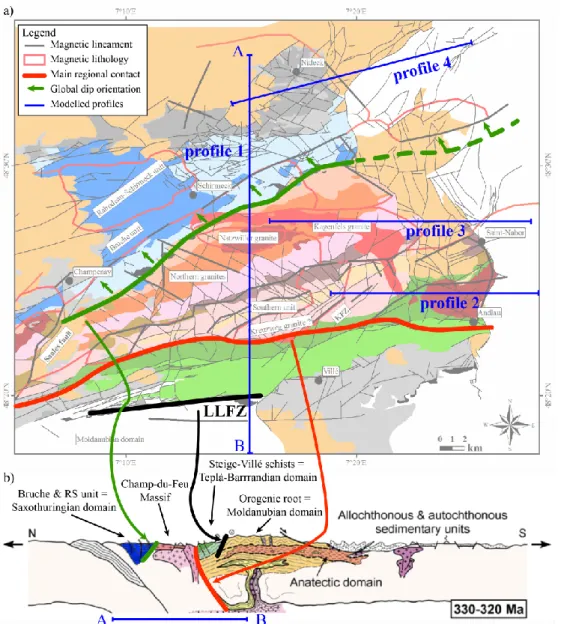
4.1 Large-scale geology
The tectono-metamorphic reconstitution of the Northern Vosges shows that the Steige- Villé schists are the western termination of the Teplà-Barrandian domain jammed between the CdF magmatic arc and the Moldanubian domain (Figure 6) (Skrzypek et al., 2014). In this model, the LLFZ is a vertical strike slip fault that separates the highly metamorphic orogenic root (Moldanubian domain) and the less metamorphosed external units (Bruche & RS units and Steige-Ville schists). It is therefore a main orogenic contact, also commonly associated with the prolongation of the Vittel fault in the Paris basin (e.g. Baptiste, 2016) and the Baden-Baden Shear Zone in the Black Forest on the eastern shoulder of the URG (Edel & Schulmann, 2009) (Figure 1).
However, the LLFZ does not appear clearly in the new aeromagnetic data (black line, figure 6). This means that there is no strong magnetization contrast where the LLFZ is expected in the conceptual geological model. This could mean either that this contact is not a major contact or that the susceptibility contrast between the Steige-Villé schists and the Moldanubian domain is weak. In any case, the large wavelength anomaly in the southern part of the map corresponding to the contact between the Steige-Villé schists and the CdF massif (red line, figure 6) shows the presence of a main boundary, north of the position of the LLFZ in the conceptual model, as suggested by Skrzypek et al. (2014) (Figure 6b). These authors also propose that the fault stated as the LLFZ corresponds to a minor shallow deformation. This interpretation is consistent with the magnetic data.
In the northern part of the map, the contact between the CdF granites and the Northern units is also marked by a straight magnetic lineament suggesting a fault-type contact (green line, figure 6). To the West, this fault could continue toward the Saales fault but it is hidden by the Senones granites (Figure 4). To the East, it is prolongated through the URG despite the bordering fault of the graben (see also next section). No outcropping fault is documented in the area; the presence of a rather prominent fault between these units was also suggested by the
organization of minor faults and fractures observed in the field (Bertrand et al., 2018). Comparing the outcropping contact and the magnetic lineament location on the HD map, this fault zone is likely to be NW-dipping.
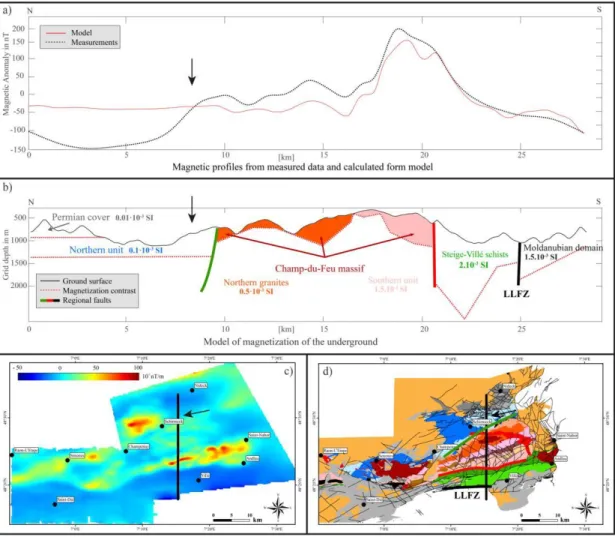
To go further, a first N-S profile is extracted in the central area of the map (Figure 7). This profile shows different anomalies with two distinct wavelengths: a large wavelength in the North marked by strong negative values lower than -100 nT) and short wavelength anomalies further South (Figure 7a). For the latter, modelling results using the published magnetic susceptibilities of the outcropping units fit with the data. The unit showing the highest values is the Steige-Villé schists with a K value of 2·10-3 SI. As explained previously, the CdF massif has a varying range of susceptibilities. Since the diverse granites have K values typically < 1·10-3 SI and the peraluminous intrusions are marked by a lower susceptibility around 0.1·10- 3 SI (see section 2.2), a mean K value of 0.5·10-3 SI is set for the whole unit. Similarly, the
Northern unit shows volcanic and sedimentary facies with highly varying magnetic susceptibilities, however this unit should have a slightly lower mean K value than the CdF massif (Edel et al., 2013, 2018), which is here set at 0.1·10-3 SI.
The geological cross-section mostly explains the magnetic data, except in its Northern part. The slight differences between the measurements and the model might be due to local facies variations and shift between the measured susceptibilities and large-scale magnetic properties of the rocks that are not taken into consideration at the scale of the cross-section. In this particular case, a small influence of the remanent magnetization and K anisotropy could explain part of the misfit in the model, in particular in the Southern unit of the CdF massif (Biedermann & McEnroe, 2017; Edel et al., 1986 ; Edel et al., 2013). Indeed, Edel et al. (1986) consider the Koenigsberger ratio in this area to be generally scattered around 0.3 except for a few samples with a ratio superior to 1 from the Steige-Villé schists, Kagenfels granites and a few dioritic samples (part of the Southern unit). The higher values of K anisotropy (still < 1.2) are found in the Andlau granite, diorites and BM in the Southern unit. In the South, susceptibility values of the Moldanubian domain and unit geometries at depth are both badly constrained and the modelling cannot bring meaningful information. Susceptibility and geometry are chosen so that the overall fit of the model is acceptable. Even so, the contact between the CdF massif and the Steige-Villé schists is well marked in the magnetic profile (red line, figure 6 & 7). In contrast, there is no major variation at the contact between Steige-Villé schists and the Moldanubian domain, in accordance with a LLFZ that is believed to be restricted to shallow deformation (black line, figures 6 & 7) as stated by Skrzypek et al. (2014).
The main observation resulting from the model is the large wavelength anomaly in the North that cannot be explained with a shallow geological contact as observed on the field. The thickness of the Permian cover is constrained here by the outcrop of the Northern unit in the bottom of the Nideck Valley near the profile. Considering that and the wavelength of the anomaly, the latter is associated with a deep structural contact that cannot be properly modelled with the available constraints. It could be explained by the presence of a NW-dipping fault zone that does not outcrop as discussed in the section 3.1 (green line, Figures 6 & 7).
4.2 The URG – Northern Vosges limit
At the eastern side of the Northern Vosges, the limit with the URG is usually divided into two parts: 1) a fault zone called the Rhenish fault with the main offset of the basement rocks under the Cenozoic sediments, and 2) a transitional zone called the “Saverne Fractured Field” between the Rhenish and Vosgian faults. Here, rift-related faults occur in a highly
fractured area and Mesozoic pre-rift sediments are outcropping (Eisbacher & Fielitz, 2010) (Figure 8a).
In the studied area, the Rhenish fault trace fits well with the end of the outcropping basement rocks at the South of Saint-Nabor and is marked by a large wavelength anomaly on the RTP map (Figures 8b & c). Making the hypothesis on the continuity of the lithological bands toward the URG, this anomaly is probably due to an increase of distance (i.e. of burial) of the Southern unit east of the Rhenish fault. Further to the North the trace of the Rhenish fault in the aeromagnetic data disappears and a deepening of the granites is well known at the Vosgian fault trace where there is 300 m thickness of the Triassic sediments (Blanalt et al., 1972; Theobald et al., 1975).
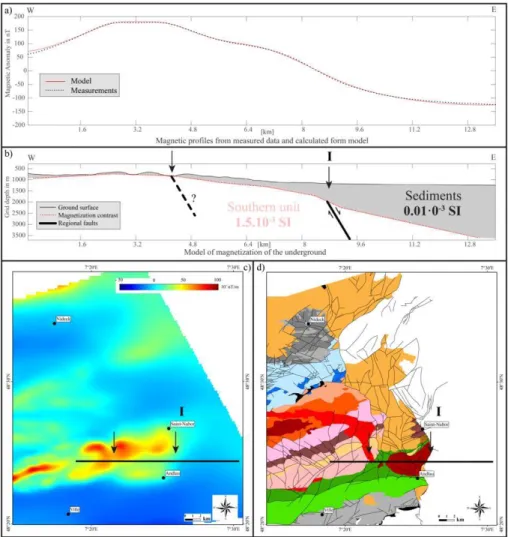
Three profiles are extracted to extend the interpretation of the outcropping basement/sediments interface. The first profile is E-W oriented through the Southern unit and the Andlau granite and crosscuts the Rhenish fault at roughly the center of the positive anomaly with the aim to limit the 3D effects due to the lithological bands (Figure 9). With a simple hypothesis of unit burial assuming a constant magnetic susceptibility, the measured data and the model fit perfectly (Figure 9a). The K value for the Southern unit is set at 2·10-3 to be consistent with susceptibility measurements (Edel et al., 2013), while the magnetization of the sediments is estimated around 0.01·10-3 SI in literature (Edel et al., 2013, 2018). Modelling tests have proven this value to be low enough compared with other formations to be considered as null: the presence of this formation has no effect on the resulting magnetic curve. In the model, the burial is mainly accommodated by the Rhenish fault trace, expressed with a single main throw within a general deepening (I on Figure 9b, c & d). On the western side, the Andlau granite outcrops and there is no deepening. This difference with the model is explained by susceptibility variations due to the presence of the granite that is not taken into account in this model. The Andlau granite is not modelled due to lack of constraints (K values and depth). Nonetheless, this does not influence the main conclusions of the model. Two effects could explain the progressive burial of the model on its eastern side. First, at this scale successive normal faults create several steps that can produce a mean slope when modelled. This can be combined with variations of susceptibility that are not taken into consideration in this model.
In the third profile, the best fit between data and model is obtained with two faults that bury the basement rocks in the graben (Figure 10a & b). This model is obtained through step by step forward modelling to fit the overall geometry of the magnetic profile. The anomaly of magnetic intensity can be divided into three separate effects. Each of these three effects can be considered a modelling step. 1-The mean decrease of the magnetic curve is obtained with a large-scale deepening of the basement material eastward. 2-Then, the first inflexion point can be obtained with a first fault and its associated throw corresponding to the Vosgian fault (I on figure 10). 3-Finally, the eastern part of the profile is explained with a second fault in the East. This last fault is shifted to the East in comparison to the outcropping Renish fault trace (II on figure 10) and cannot be moved to the West if the data is to be explained. Also, it can be noticed that the modelled basement surface must be shifted upward to fit with the outcropping areas because of susceptibility variations, as on the first E-W profile. The approximate throws are in agreement with the 300 m thick Triassic sediments outcropping between the Saint-Nabor and the CdF basement outcrops. The model only deals with general values of susceptibilities and dip and subtleties concerning those values are beyond the resolution of the modelling effort. Indeed, the model shows only the burial of a unit with a susceptibility of 0.5·10-3 SI, which in this case could correspond to the susceptibility of the Northern granites (as explained in section 4.1), whereas the lithological map shows that the Southern unit may appear under
the sediments in the east. The general conclusion of burial through two faults will however not change because the susceptibility of the Southern unit (1.5·10-3 SI in the previous model of
Figure 7 and according to Edel et al., 2013) is higher than the Northern granites.
The last profile is not strictly E-W in order to limit the effects of the anomaly appearing at the border of the map North of Nideck (Figure 11). The Bruche unit magnetic susceptibility is set to be consistent with published mean values at 1·10-3 SI. However, this volcano-
sedimentary unit has substantial rock facies changes from the lower part to the summit (Skrzypek et al., 2014), that may cause large variation of the magnetic susceptibility. By applying a mean susceptibility to the whole unit without more constraints, the general geometry of the modelled data will stay the same whatever the chosen susceptibility value. Indeed, doubling or halving the susceptibility value in this case will respectively increase or decrease the westward burial. The absence of a break in slope in the magnetic profile infers that the model cannot display a fault throw consistent with surface lithologies. The thickness of the Permian & Triassic cover could be constrained by the basement outcrop in the Nideck Valley, but its deepening further to the West is unkown. With no further constraints on the susceptibilities or on the deep geometry of the units, it is not possible to propose an alternative model that would both fit the geological observations and geophysical data. However, while the gently westward deepening of the basement surface is consistent below the Permian sediments in the Nideck valley, the exhumation of the basement toward the East where Triassic and younger sediments outcrop has no sense from a geological point of view. Indeed, the basement is necessarily buried at the East of the Vosgian fault that marks the URG limit. This misfit between magnetic and geological data is probably due to a main change in the basement lithologies at the East of the outcropping Bruche unit.
In summary, the comparison between the three profiles shows a clear compartmentalization of the main rift-related fault-throw and the basement/sediment interface. In the northern part of the map, the Vosgian fault is less visible in the aeromagnetic surveys. This could be explained by a change in the lithological units of the basement rocks, and therefore a change of magnetization contrast. The Rhenish fault is also segmented between the southern and the central profile. The decoupling of these structures occurs likely on the faults between the ENE-WSW units, inherited from the Hercynian orogeny. Examples include the Bruche unit/granites interface in the North and the granites/Southern unit boundary in the CdF. The faults targeted by the geothermal projects in the URG are second order faults (i.e. with less throw and length) compared to the N-S faults like the Vosgian and the Rhenish faults. These may also be segmented by the inherited basement structures as shown by the forward modelling of the profiles. The presence of these ENE-WSW faults, and also of the NE-SW and NW-SE faults documented in outcropping basement in the Central block (section 3.2), therefore serves as a guide for interpreting the deeply buried basement in the URG where the data are not precise enough to map these second order faults. These directions crosscut the targeted N-S faults and could act as impermeable barriers or create fluid conduits; an important aspect for the understanding of the fluid flows that are expected in the deepest part of the URG.
5 Synthesis and conclusions
Two recent magnetic surveys were conducted in the Northern Vosges to explore the structures of the deep basement rocks on the URG shoulders in the Northern Vosges. They were merged with a new interpolation method described in Gavazzi et al. (this issue), developed for producing interpretative maps while taking into consideration the complex topography and
the difference in data acquisition parameters of the two surveys. It appears that outcropping rock units and maxima of the RTP can be directly compared which enables new constraints on the structural network of this area.
At a regional scale, the basement rocks of the Hercynian orogeny and the magnetic anomalies show a direct correlation as known from literature data (Edel & Schulmann, 2009). Thus, the magnetic anomalies associated to granites as well as other magmatic and metamorphic units are clearly distinguished, and the organization in ENE-WNW almost vertical lithological units is confirmed. Despite some small differences, this agrees with the recent reviews on the geological data (Elsass et al., 2008; Skrzypek et al., 2014), including the expression of the LLFZ whose extent and significance in the Hercynian orogeny is still largely debated.
In detail, the aeromagnetic data show new constraints on the structural features of the main rift-related faults in the area (i.e. Rhenish and Vosgian faults) and the basement structuration. The inherited structures from the Hercynian orogeny, i.e. the ENE-WSW faults, are shown as the main features that partitioned the basement in first order structural blocks and compartmentalized the N-S rift-related faults. In these blocks, secondary N-S and NE-SW or NE-SW faults are also delineated by the aeromagnetic data; moreover, they are recognized in a recent field study into the fault and fracture network (Bertrand et al., 2018). These faults with N-S direction are typically the target of the current geothermal prospects (Vidal & Genter, 2018). Our study highlights the importance of the other fault directions, especially considering the geothermal fluid flows. The partitioning of the basement by the ENE-WNW inherited structures can likely act as fluid barrier or create preferential conduits between the structural blocks, as the NE-SW or NW-SE faults can do at a more local scale. For the geophysical prospections through the graben and the pre-drilling resource estimations in the basement rocks, these structures have to be considered as important as the rift-related fault system.
In the near future, more detailed surveys (i.e. conducted closer to the ground using a drone) are planned to highlight more detailed geological features. This additional exploration should help to delineate the importance of the whole secondary fault network, that currently is still incomplete due to the smaller dimensions and vertical throw.
Acknowledgments, Samples, and Data
Some of the results presented in this paper rely on the data collected at Chambon-La-Forêt observatory. We thank Centre de Recherche en Astronomie, Astrophysique et Géophysique as well as Institut de Physique du Globe de Paris, for supporting its operation and INTERMAGNET for promoting high standards of magnetic observatory practice (www.intermagnet.org). The authors would also like to thank Fonroche Géothermie for providing the data of the survey carried out by GPR International. The data used in the paper are available at https://doi.org/10.5281/zenodo.3520870.
References
Bailleux, P. (2012). Multidisciplininary approach to understand the localization of
geothermal anomalies in the Upper Rhine Graben regional to local scale. PhD Thesis, Neuchâtel University, 131 p.
Baptiste, J. (2016). Cartographie structurale et lithologique du substratum du bassin Parisien et sa place dans la chaîne varisque de l’Europe de l’Ouest. PhD Thesis, Orléans University, 367 p.
Baranov, V. (1957). A new method for interpretation of aeromagnetic maps: pseudo- gravimetric anomalies. Geophysics 22: 359–383. https://doi.org/10.1190/1.1438369 Bertrand, L., Jusseaume, J., Géraud, Y., Diraison, M., Damy, P.-C., Navelot, V. & Haffen, S.
(2018). Structural heritage, reactivation and distribution of fault and fracture network in a rifting context: case study of the western shoulder of the Upper Rhine Graben. Journal of Structural Geology, 198, 243-255.
http://dx.doi.org/10.1016/j.jsg.2017.09.006
Biedermann, A.R. & McEnroe S.A. (2017). Effects of Magnetic Anisotropy on Total
Magnetic Field Anomalies. Journal of Geophysical Research: Solid Earth, 122, 8628 - 8644. https://doi.org/10.1002/2017JB014647
Blanalt, J.G., von Eller, J.P., Fluck, P., Geffroy, J., Jeannette, D., Ruhland, M., et al. (1972). Carte géologique de Sélestat. BRGM geological map n°307, scale 1:50,000.
Boissavy, C., Rocher, P., Laplaige, P. & Brange, C. (2016). Geothermal energy use, country update for ́France. In: European Geothermal ̀Congress 2016 Proceedings, Strasbourg, 19-24 Sept 2016.
Bossennec, C., Géraud, Y., Moretti, I., Mattioni, L. & Stemmelenc, D. (2018). Pore network properties of sandstones in a fault damage zone. Journal of Structural Geology, 110, 24-44. https://doi.org/10.1016/j.jsg.2018.02.003
Bourgeois, O., Ford, M., Diraison, M., Le Carlier de Veslud, C., Gerbault, M., Pik, et al. (2007). Separation of tifting and lithospheric folding signature in the NW-Alpine foreland. International Journal of Earth Science, 96, 1003-1031.
https://doi.org/10.1007/s00531-007-0202-2
Bourquin, S., Peron, S. & Durand, M. (2006). Lower Triassic sequence stratigraphy of the western part of the Germanic Basin (west of Black Forest): Fluvial system evolution through time and space. Sedimentary Geology, 186, 187-211.
https://doi.org/10.1016/j.sedgeo.2005.11.018
Boutin, R., Montigny, R. & Thuizat, R. (1995). Chronologie K-Ar et 39Ar-40Ar du métamorphisme et du magmatisme des Vosges. Comparaison avec les massifs varisques voisins. Géologie de la France, 1, 3-25.
Brun, J.P., Gutscher, M.A. & Dekorp-Ecors teams (1992). Deep crustal structure of the Rhine Graben from DEKORP-ECORS seismic reflexion data: a summary. Tectonophysics, 208, 139-147.
Cocherie, A. (2007). Datations U-Pb (laser-ICPMS-MC) sur zircons des Vosges (projet carte 50 000). Note N° MMA/ISO-2007/262, p. 15.
Cooper, G. & Cowan, D. (2003). The application of fractional calculus to potential field data. Exploration Geophysics, 34, 51-56. https://doi.org/10.1071/EG03051
Dèzes, P., Schmid, S.M. & Ziegler, P.A. (2004). Evolution of the European Cenozoic Rift System: interaction of the Alpine and Pyrenean orogens with their foreland
lithosphere. Tectonophysics, 389, 1-33. https://doi.org/10.1016/j.tecto.2004.06.011 Edel, J.B., Montigny, R., Royer, J.Y., Thuizat, R. & Trolard, F. (1986). Paleomagnetic
investigations and K-Ar dating on the variscan plutonic massif of the Champ du Feu and its volcanic-sedimentary environment, Northern Vosges, France. Tectonophysics, 122, 165-185.
Edel, J.B. & Schulmann, K. (2009). Geophysical constraints and model of the
“Saxothuringian and Rhenohercynian subductions - magmatic arc system” in NE France and SW Germany. Bulletin de la Société Géologique de France. 180 (n°6), 545-558.
Edel J.B., Schulmann, K., Skrzypek, E. & Cocherie, A. (2013). Tectonic evolution of the European Variscan belt constrained by palaeomagnetic, structural and anisotropy of magnetic susceptibility data from the Northern Vosges magmatic arc (eastern France). Journal of the Geological Society, London, 170, 2013, 785–804.
http://dx.doi.org/10.1144/jgs2011-138
Eisbacher, G.H. & Fielitz, W., (2010). Karlsruhe und seine Region - Nordschwarzwald, Kraichgau, Neckartal, südlicher Odenwald, Oberrhein-Graben, Pfälzerwald und westliche Schwäbische Alb., Sammlung g. Schweizerbart Science Publishers, Stuttgart, Germany, 342p.
Elsass, P., von Eller, J.P.& Stussi, J.M. (2008). Géologie du massif du Champ du Feu et de ses abords. Eléments de notice pour la feuille géologique 307 Sélestat. Rapport Bureau des Ressources Géologiques et Minières, RP-56088-FR, 187 p.
Ford, M., Le Carlier de Veslud, C. & Bourgeois, O. (2007). Kinematic and geometric analysis of fault-related folds in a rift setting: The Dannemarie basin, Upper Rhine Graben. Journal of Structural Geology, 29, 1811-1830.
https://doi.org/10.1016/j.jsg.2007.08.001
Freymark, J., Sippel, J., Scheck-Wenderoth, M., Bär, K., Stiller, M., Fritsche, J.G. & Kracht,
M. (2017). The deep thermal field of the Upper Rhine Graben. Tectonophysics, 694,
114-129. https://doi.org/10.1016/j.tecto.2016.11.013
Gavazzi, B., Bertrand, L., Munschy, M., Mercier de Lépinay, J., Diraison, M., Géraud, Y. (submitted). On the use of aeromagnetism for geological interpretation part I: comparison of 1 scalar and vector magnetometers for aeromagnetic surveys and an equivalent source 2 interpolator for combining, gridding and transform fixed altitude and draping 3 datasets. Journal of Geophysical Research: Solid Earth (this issue). Genter, A., Guillou-Frottier, L., Breton, J.P., Denis, L., Dezayes, C., Egal, E., et al. (2004).
Typologie des systèmes géothermiques HDR-HFR en Europe, Rapport Bureau des Ressources Géologiques et Minières, RP-53452-FR, 165p.
Guillocheau, F., Robin, C., Allemand, P., Bourquin, S., Brault, N., Dromart, N. et al. (2000). Meso-Cenozoic geodynamic evolution of the Paris basin: 3D stratigraphic constraints. Geodynamica Acta, 13, 189–245. https://doi.org/10.1016/S0985-3111(00)00118-2 Hess, J.C., Lippolt, H.J. & Kober, B. (1995). The age of the Kagenfels granite (northern
Vosges) and its bearing on the intrusion schem of late Variscan granitoids. Geologische Rundschau, 84, 568–577.
Jung, S. (1999). The role of crustal contamination during the evolution of continental rift- related basalts: A case study from the Vogelsberg area (central Germany). GeoLines, 9, 48–58.
Khair, H.A., Cooke, D. & Hand, M. (2015). Seismic mapping and geomechanical analyses of faults within deep hot granites, a workflow for Enhanced Geothermal System
projects. Geothermics, 53, 46-56. https://doi.org/10.1016/j.geothermics.2014.04.007 McCaffrey, K.J.W., Sleight, J.M., Pugliese, S. & Holdsworth, R.E. (2003). Fracture
formation and evolution in crystalline rocks: Insights from attribute analysis. In: Petford, N., McCaffrey, K.J.W. (Eds.), Hydrocarbons in Crystalline Rocks. Geological Society, London, pp. 109-124. Special Publications 214.
https://doi.org/10.1144/GSL.SP.2003.214.01.07
Menillet, F., Durand, M., Maïaux, C. & Lougnon, J. (1978). Carte géologique de Cirey-sur- Vezouze. BRGM geological map n°270, scale 1:50,000.
Reitz, E. & Wickert, F. (1989). Late Cambrian to early Ordovician acritarchs from the Villé unit, northern Vosges Mountains (France). Neues Jahrbuch für Geologie und
Paläontologie, Monatshefte, 6, 375-384.
Schumacher, M.E. (2002). Upper Rhine Graben: Role of preexisting structures during rift evolution. Tectonophysics, 21, 1006.
Sissingh, W. (2001). Tectonostratigraphy of the West Alpine Foreland: correlation of Tertiary sedimentary sequences, changes in eustatic sea-level and stress regimes.
Tectonophysics, 333, 361–400.
Skrzypek, E. (2011). Contribution structurale, pétrologique et géochronologique à la tectonique intracontinentale de la chaîne hercynienne d’Europe (Sudètes, Vosges). PhD Thesis, Strasbourg University, 412 p.
Skrzypek, E., Schulmann, K., Tabaud, A.S. & Edel, J.B. (2014). Palaeozoic evolution of the Variscan Vosges Mountains. In : Schulmann, K., Martinez, Catalan J.R., Lardeaux, J.M., Janousěk, V., Oggiano, G., The Variscan Orogeny: Extent, Timescale and the Formation of the European Crust. Geological Society of London, Special
Publications, 405, 45-75. http://dx.doi.org/10.1144/SP405.8
Tabaud, A.S., Whitechurch, H., Rossi, P., Schulmann, K., Guerrot, C. & Cocherie, A. (2014). Devonian-Permian magmatic pulses in the northern Vosges Mountains (NE France): result of continuous subduction of the Rhenohercynien Ocean and Avalonian passive margin. In: Schulmann, K., Martinez, Catalan J.R., Lardeaux, J.M., Janousěk, V., Oggiano, G., The Variscan Orogeny: Extent, Timescale and the Formation of the European Crust. Geological Society of London, Special Publications, 405, 187-223. http://dx.doi.org/10.1144/SP405.12
Taktak, A.G. & Lauer, J.P. (1972). Les apports de la géophysique à la connaissance des Vosges. Bulletin du Service de la Carte Géologique d’Alsace Lorraine 25, 21-25. Thébault, E., Finlay, C.C., Beggan, C.D., Canet, E., Chulliat, A., Langlais, B., Lesur, V.,
Lowes, F.J., Chandrasekharan, M., Rother, M., Schachtschneider, R., (2015). International Geomagnetic Reference Field: the 12th generation. Earth, Planets and Space 67.
Theobald, N., Menillet, F., Vogt, H., Thevenin, A., Schwoerer, P. & Lougnon, J. (1975). Carte géologique de Molsheim. BRGM geological map n°271, scale 1:50,000.
Vergés, J., Fernandez, M. & Martinez, A. (2002). The Pyrenean orogen: pre-, syn- and post- collisionnal evolution. Journal of the Virtual Explorer, 8, 55-74.
Vidal, J. & Genter, A. (2018). Pverview of naturally permeable fractured reeservoirs in the central and southern Upper Rhine Graben: Insighs from geothermal wells.
Geothermics, 74, 57-73. https://doi.org/10.1016/j.geothermics.2018.02.003
von Eller, J.P., Menillet, F., Hollinger, J., Guillaume, C., Billoret, R., Fluck, P. & Maïaux, C. (1975). Carte géologique de Saint-Dié. BRGM geological map n°306, scale 1:50,000. Ziegler, P.A., Schumacher, M.E., Dezès, P., Van Wees, J.D. & Cloetingh, S. (2006). Post-
Variscan evolution of the lithosphere in the area of the European Cenozoic Rift System. Geological Society, London, Memoirs, 32, 97-112.
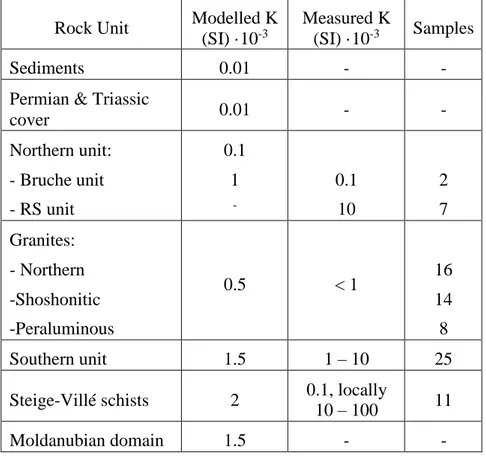
Table 1. Table of magnetic susceptibility used in the profile modelling for the different
lithologies and comparison with published data measured on core samples (Edel et al., 1986, 2013).
Rock Unit Modelled K (SI) ·10-3
Measured K
(SI) ·10-3 Samples
Sediments 0.01 - -
Permian & Triassic
cover 0.01 - - Northern unit: - Bruche unit - RS unit 0.1 1 - 0.1 10 2 7 Granites: - Northern -Shoshonitic -Peraluminous 0.5 < 1 16 14 8 Southern unit 1.5 1 – 10 25
Steige-Villé schists 2 0.1, locally
10 – 100 11 Moldanubian domain 1.5 - -
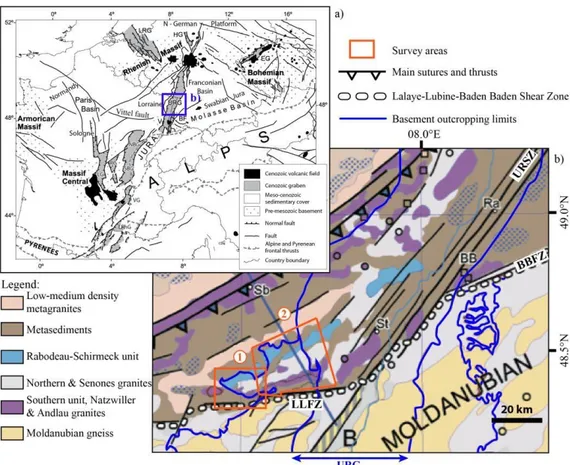
Figure 1. a) General map of the West European Rift System with the associated basins : URG
& LRG : Upper & Lower Rhine Graben, NBG & SBG : Northern & Southern Bresse Graben, RG : Roanne Graben, VG : Valance Graben, LRhG : Lower Rhône Grabens, HG : Hessian grabens, EG : Eger Graben V : Vosges and BF : Black Forest (Bourgeois et al., 2007), b) Interpretative map of the basement rock units from density and gravimetric data within the studied areas, LLFZ : Lalaye-Lubine Fault Zone, BBFZ : Baden-Baden Fault Zone, URSZ : Upper Rhine Shear Zone, St : Strasbourg, Ra : Karlsruhe, Sb : Saarbrucken, BB : Baden-Baden modified after Edel and Schulmann (2009).
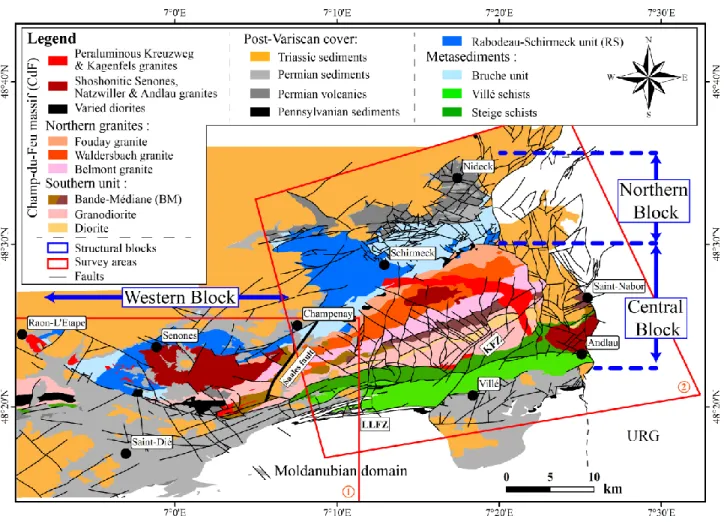
Figure 2. Simplified geological map of the Northern Vosges, redrawn after Blanalt et al.
(1972), Theobald et al. (1975), von Eller et al. (1975), Menillet et al. (1978) and Elsass et al. (2008), with the survey areas and the structural blocks after Bertrand et al. (2018); LLFZ : Lalaye-Lubine Fault Zone, KFZ : Kreuzweg Fault Zone, URG : Upper Rhine Graben.
Figure 3. Computed aeromagnetic maps at 1400 m altitude: a) Total Magnetic Intensity
anomalies (TMI), b) Reduction to the Pole (RTP), c) Horizontal derivative of the RTP (HD) and d) Fractional vertical derivative of the RTP (order 0.5, VD).
Figure 4. Structural and lithotectonic interpretations of the Western block, a) on the RTP map,
Figure 5. Structural and lithotectonic interpretations of the Central and Northern blocks, a) on
RTP map, b) on Fractional vertical derivative map, c) on the HD of the RTP and d) overlain on the geological map.
Figure 6. a) Geological map of the Central and Northern block with interpretation of the main
lineaments and correlation with b) the tectonic reconstitution of the Northern Vosges (modified after Skrzypek, 2011).
Figure 7. Profile 1: a) Magnetic profiles extracted from the grid and calculated from model, b)
topography and model of the main magnetic contrasts. The ordinate is the distance from the measurement plane (1400 m AMSL), in meters. c) Profile position shown on the VD map at the order 0.5 of the RTP, d) profile position shown on the geological map. Black arrows on the cross section in panel b are also indicated on the maps in panels c and d.
Figure 8. a) General map of the URG with the main structural features: Vosgian and Rhenish
faults, Saverne FF: Saverne Fractured Field, LLFZ: Lalaye-Lubine Fault Zone, BBFZ: Baden- Baden Fault Zone (modified after Bossennec et al., 2018), zoom-in on the boundary zone between the Northern Vosges and the URG on b) the RTP map and c) the geological map.
Figure 9. Profile 2: a) magnetic profiles extracted from the grid and calculated from model, b)
topography and model of the main magnetic contrasts. The ordinate is the distance from the measurement plane (1400 m AMSL), in meters. c) Profile position shown on the VD map at the order 0.5 of the RTP, d) profile position shown on the geological map. Black arrows on the cross section in panel b are also indicated on the maps in panels c and d.
Figure 10. Profile 3: a) magnetic profiles extracted from the grid and calculated from model,
b) topography and model of the main magnetic contrasts. The ordinate is the distance from the measurement plane (1400 m AMSL), in meters. c) Profile position shown on the VD map at the order 0.5 of the RTP, d) profile position shown on the geological map. Black arrows on the cross section in panel b are also indicated on the maps in panels c and d.
Figure 11. Profile 4: a) magnetic profiles extracted from the grid and calculated from model,
b) topography and model of the main magnetic contrasts. The ordinate is the distance from the measurement plane (1400 m AMSL), in meters. c) Profile position shown on the VD map at the order 0.5 of the RTP, d) profile position shown on the geological map. Black arrow on the cross section in panel b is also indicated on the maps in panels c and d.