HAL Id: hal-02868245
https://hal-enpc.archives-ouvertes.fr/hal-02868245
Submitted on 29 Jun 2020
HAL is a multi-disciplinary open access
archive for the deposit and dissemination of
sci-entific research documents, whether they are
pub-lished or not. The documents may come from
teaching and research institutions in France or
abroad, or from public or private research centers.
L’archive ouverte pluridisciplinaire HAL, est
destinée au dépôt et à la diffusion de documents
scientifiques de niveau recherche, publiés ou non,
émanant des établissements d’enseignement et de
recherche français ou étrangers, des laboratoires
publics ou privés.
Determination of 18 Biocides in Both the Dissolved and
Particulate Fractions of Urban and Surface Waters by
HPLC-MS/MS
Claudia Paijens, Bertrand Frere, Emilie Caupos, Régis Moilleron, Adèle
Bressy
To cite this version:
Claudia Paijens, Bertrand Frere, Emilie Caupos, Régis Moilleron, Adèle Bressy. Determination of 18
Biocides in Both the Dissolved and Particulate Fractions of Urban and Surface Waters by
HPLC-MS/MS. Water, Air, and Soil Pollution, Springer Verlag, 2020, 231 (5), pp.210.
�10.1007/s11270-020-04546-6�. �hal-02868245�
Water Air Soil Pollut (2020) 231:210 https://doi.org/10.1007/s11270-020-04546-6
Determination of 18 biocides in both the dissolved and particulate
fractions of urban and surface waters by HPLC-MS/MS
Claudia Paijens
1,2, Bertrand Frère
2, Emilie Caupos
3, Régis Moilleron
3, and Adèle Bressy
1,*1
Ecole des Ponts, Univ Paris Est Creteil, Leesu, Champs-sur-Marne, France
2Laboratoire Central de la Préfecture de Police, Paris, France
3
Univ Paris Est Creteil, Ecole des Ponts, Leesu, Creteil, France
*corresponding author: adele.bressy@enpc.fr
Abstract
A robust method is provided to analyze 18 hydrophilic and hydrophobic biocides in both dissolved and particulate fractions of five types of urban and surface waters using high performance liquid chromatography coupled to tandem mass spectrometry. The linearity, accuracy and intermediate precision were validated. The target biocides were enriched by solid phase extraction using Chromabond HR-X 200 mg cartridges and eluted with methanol, ethyl acetate and dichloromethane. Suspended matter was extracted by microwave-assisted extraction in methanol and dichloromethane. Recoveries and variability (respectively >75% and < 30% for most of the target biocides and matrices) made it possible to quantify biocides at trace level in all matrices. LOQs were in the range of ng/L in the dissolved fraction and in the range of ng/g.dw in the particulate fraction for most of the biocides and matrices and were generally lower than those reported in previous studies. The method was successfully applied to surface water, treated and untreated wastewater, combined sewer overflows, and stormwater providing, unique data in these matrices for some substances, in particular with respect to particle contamination. In urban waters, concentrations of most of the biocides ranged from 10 to 200 ng/L. Diuron, isothazolinone and benzalkonium concentrations could reach 0.9, 0.9 and 20 µg/L respectively. In rivers, most of the biocides were measured at less than 10 ng/L, but higher concentrations were observed for benzalkoniums (up to 200 ng/L) or after rain events, which indicates biocide transfer from urban surfaces into the aquatic environment during wet weather.
Keywords
Water Air Soil Pollut (2020) 231:210 https://doi.org/10.1007/s11270-020-04546-6
Introduction
In recent years, biocidal substances in the aquatic environment have received an increasing attention because of (i) their many uses especially in urban areas (Bester et al. 2008; Bollmann et al. 2014b; Paijens et al. 2020; Wieck et al. 2018), (ii) their transfer into the aquatic environment via wastewater or stormwater discharges (Bollmann et al. 2014a; Burkhardt et al. 2011; Juksu et al. 2019; Wicke et al. 2015), and (iii) their negative effect on aquatic organisms (Mohr et al. 2008; Vermeirssen et al. 2018). Indeed, biocides are toxic and may cause long-term adverse effects to aquatic ecosystems even at low concentrations, such as endocrine disruption in zebrafish larvae (Jiang et al., 2015) or behavioural disturbance in zebrafish embryos (Andrade et al., 2016). The predicted no effect concentrations (PNEC) of these substances are in the range of ng/L: 1 ng/L for cybutryn (Burkhardt et al., 2011), 8 ng/L for dichloro-octylisothiazolinone (Burkhardt et al., 2009), and 40 ng/L for benzalkonium C12 (Uhl et al., 2005) for instance. This work focuses on 18 biocides, which were previously prioritized (Paijens et al. 2019) according to (i) their use in urban areas, and especially as preservatives in building materials such as paints, renders, wood or bitumen membranes, (ii) their emission into runoff and the receiving waters, and (iii) their risk for aquatic organisms: diuron, isoproturon, methylisothiazolinone (MIT), benzisothiazolinone (BIT), chloro-methylisothiazolinone (CMIT), octylisothiazolinone (OIT), dichloro-octylisothiazolinone (DCOIT), benzalkonium compounds (BZK C12-C16), terbutryn, cybutryn (irgarol 1051), terbuthylazine, carbendazim, iodopropynyl butylcarbamate (IPBC), thiabendazole, tebuconazole and mecoprop. A state-of-the-art review (Paijens et al. 2020) identified many knowledge gaps, preventing the full assessment of the risks associated with biocides originating from buildings. Most of these biocides are also used as plant protection products and thus have been monitored in rural areas but more rarely in urban waters (Paijens et al. 2020). For other compounds not used as pesticides (isothiazolinones, benzalkonium compounds, IPBC), data in receiving and urban waters are scarcer (Paijens et al. 2020). A few studies have shown that these substances can be emitted at high concentrations in building runoff (Bollmann et al. 2016; Bollmann et al. 2017; Burkhardt et al. 2011, 2012; Van de Voorde et al. 2012). Runoff concentrations and cumulative emissions have been reported in Paijens et al. (2020). For example, diuron was measured between 1 and 25 mg/L (Burkhardt et al. 2012; Bollmann et al. 2016) and benzalkonium compounds between 0.04 and 27 mg/L (Van de Voorde et al. 2012). However, their transfer to the aquatic environment and the contribution of building materials to the contamination of receiving waters by biocides have been little studied (Paijens et al. 2020). Although these substances are also used in domestic products such as detergents, cosmetics, and textiles or as insecticides (Bester et al. 2008; Wieck et al. 2016), their urban sources have been overlooked in terms of health and environmental risk assessment (Merel et al. 2018; Paijens et al. 2020; Wieck et al. 2016). So far, biocides are still poorly regulated in the aquatic environment, and are therefore not included in monitoring programs (Dulio et al. 2015; Geissen et al. 2015). It is therefore important to address the lack of knowledge about their dynamics in urban waters and to prioritize emission pathways into the aquatic media. Several multi-residue analytical procedures have been reported in the literature for the determination of biocides and pesticides (Bester and Lamani 2010; Chen et al. 2012; Cotton et al. 2016; Moschet et al. 2014; Singer et al. 2010; Van de Voorde et al. 2012; Wick et al. 2010; Wieck et al. 2018). However only Wieck et al. (2018) have considered hydrophilic and cationic/hydrophobic biocides, such as isothiazolinones (excepting MIT) and benzalkonium compounds (only BZK C12). These methods are based on high performance liquid chromatography coupled to tandem mass spectrometry (HPLC-MS/MS). Most of the currently available methods for dissolved extraction are based on solid phase extraction (SPE). Polymeric phases such as divynylbenzene (Hydrophobic DVB, Baker), polystyrene-divinylbenzene (Strata-X from Phenomenex or Chromabond HR-X from Macherey-Nagel) or vinylpyrrolidinone-divinylbenzene (Oasis HLB, Waters), are widely used for all the selected compounds, as they provide mixed retention (Bester and Lamani 2010; Chen et al. 2012; Singer et al. 2010; Wieck et al. 2018). Benzalkonium cations can be extracted using a cationic exchange phase (Van de Voorde et al. 2012). Cartridges that combine several phases are also used for multi-residue analysis (Moschet et al. 2014; Rafoth et al. 2007). Concerning the particulate fraction, most studies focus on soils (Chitescu et al. 2012; Hildebrandt et al. 2007; Huang et al. 2018; Shah et al. 2011; Stipičević et al. 2015) or sediments (Kalogridi et al. 2014; Masiá et al. 2015; Sánchez-Rodríguez et al. 2011) and only on a limited number of compounds. To the best of the authors’ knowledge, only three studies have investigated and therefore pointed out the contamination of suspended matter by biocides (Östman et al. 2017; Van de Voorde et al. 2012; Wieck et al. 2018). Benzalkoniums were measured in stormwater and wastewater particles by Van de Voorde et al. (2012) and Östman et al. (2017) using microwave assisted extraction (MAE) or bead beater with zirconium/silica beads, and 14 biocides were analyzed by Wieck et al. (2018) using ultrasounds.
The aim of this study was to develop a sensitive and robust method for the quantification of the 18 targeted biocides in both dissolved and particulate fractions of a wide range of matrices: rainwater, stormwater, combined sewer overflows (CSOs), treated and untreated wastewater, and surface waters. The first objective was to optimize a suitable method for a wide range of matrices and concentrations, with detection and quantification limits in surface
Water Air Soil Pollut (2020) 231:210 https://doi.org/10.1007/s11270-020-04546-6
waters below predicted no effect concentrations (PNECs) in order to assess the environmental risk. The second objective was to apply the validated method to real samples in order to assess the contamination of urban waters and the respective contribution of dry and wet weather water discharges to the pollution of the receiving aquatic environment.
1. Materials and methods
1.1. Chemicals and reagents
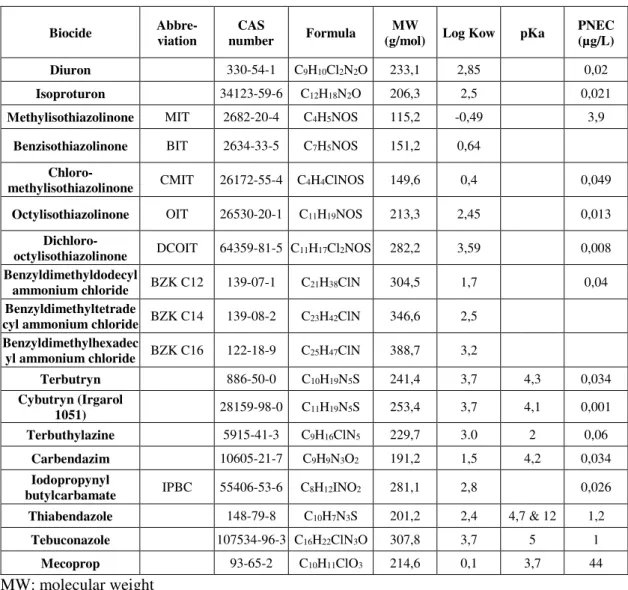
Information about the 18 targeted compounds are listed in the electronic supplementary material (ESM) Table S1. All standards of high purity (> 90%) were commercially available. Carbendazim, IPBC, tebuconazole, terbutryn, thiabendazole, 2-methyl-4-isothiazolin-3-one, 4,5-dichloro-2-n-octylisothiazol-3(2H)-one and 5-chloro-2-methyl-4-isothiazolin-3-one were purchased from A2S (France). Cybutryn, isoproturon, mecoprop, terbuthylazine, 1,2-benzisothiazol-3(2H)-one, 2-octylisothiazol-3(2H)-one and the isotope labelled standard isoproturon-d6 was obtained from Dr. Ehrenstorfer (Germany). Three benzalkonium chlorides (benzyldimethyldodecyl ammonium chloride C12, benzyldimethyltetradecyl ammonium chloride C14, and benzyldimethylhexadecyl ammonium chloride C16) were purchased from Sigma Aldrich (France). The isotope-labelled standards terbuthylazine-d5 and mecoprop-d3 were obtained from CDN Isotopes (Canada).
HPLC-grade methanol (MeOH), dichloromethane (DCM), ethyl acetate (EtAc) and formic acid (HCOOH) were purchased from ThermoFisher Scientific (France). Deionized water was produced by an Elix Essential 3 system and ultrapure (UP) water was produced by Milli-Q IQ 7000 system, both from Merck Millipore (France). Individual stock solutions of all compounds were prepared in MeOH at 1 mg/mL except for MIT (20 mg/mL), terbuthylazine (0.25 mg/mL), carbendazim (in acetone at 0.1 mg/mL), and terbuthylazine-d5 (in acetone at 1 mg/mL). Standard mixture solutions were prepared in MeOH at 5 mg/L, 50 µg/L and 10 µg/L. Internal standard (IS) mixture solution (isoproturon-d6, mecoprop-d3 and terbuthylazine-d5) was prepared in MeOH at 10 mg/L. All solutions were stored in 15 mL amber glass bottles and kept at 4 °C.
1.2. Sample collection and preparation
1.2.1. Sample collection
Surface water samples were collected upstream of the Paris conurbation in the Marne River, in the middle of the channel and at around one meter deep (5 L grab sample). Dry and wet atmospheric depositions were collected using an amber glass bottle (20 L) connected to a 1 m2 stainless pyramidal funnel located on the roof of the Central Laboratory of the Police Prefecture. Wastewater treatment plant (WWTP) influents and effluents were collected from the Seine centre WWTP (24 h composite samples). CSOs samples (mix of wastewater and stormwater) were collected in Paris (flow-dependent samples). Stormwater was sampled in an underground stormwater storage pond in Paris (time-dependent samples).
1.2.2. Preparation of samples
In order to remove any traces of organic impurities, all glassware was successively hand-washed with detergent (24 h), rinsed with tap water and deionized water, and heated at 500 °C for 2 h. Samples were filtered within 24 h after sampling through 0.7 µm glass fiber filters (GF/F, Whatman, UK) previously heated at 500 °C for 2 h. In order to obtain enough particles, 250 mL of CSO sample, 300 mL of stormwater, 400 mL of wastewater, 1 L of WWTP effluents, and 2 L of surface waters and rainwater were filtered. The dissolved fraction was stored in a glass bottle at 4 °C and extracted within 48 h after sampling. Before extraction, the sample pH was adjusted to 2.5 with 0.1% (v/v) of HCOOH (98-100%). The GF/F filter containing the particulate fraction was frozen and then freeze-dried for 24 h. The filter was then stored in a desiccator until its extraction.
1.3. Sample extraction
1.3.1. Dissolved fraction
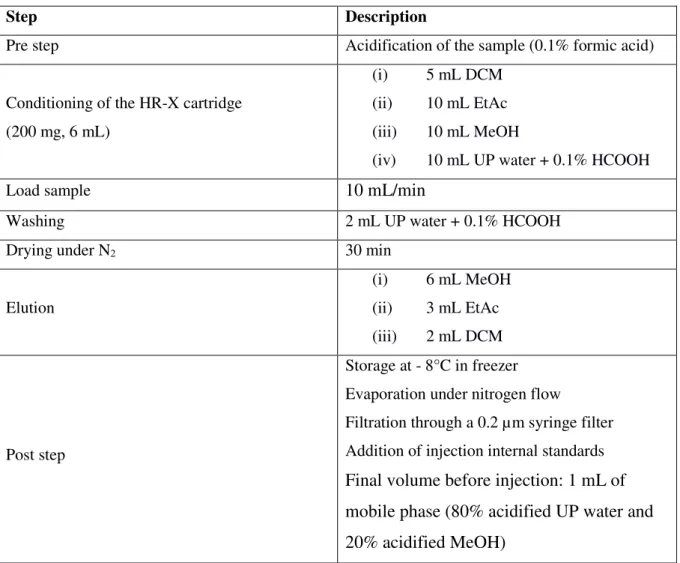
The dissolved fraction was extracted by SPE on a semi-automatic device, AutoTrace (AT280) from Caliper Life Sciences (France). The protocol is summarized in ESM Table S2. Samples were extracted on a Chromabond HR-X cartridge (200 mg, 6 mL) from Macherey-Nagel (France). First, the cartridge was successively conditioned with 5 mL of DCM, 10 mL of EtAc, 10 mL of MeOH, and 10 mL of acidified UP water (pH 2.5). The sample was then
Water Air Soil Pollut (2020) 231:210 https://doi.org/10.1007/s11270-020-04546-6
loaded onto the cartridge: 100 mL for CSOs and wastewater, 200 mL for treated wastewater and stormwater, and 500 mL for surface waters and rainwater. After loading, the cartridge was washed with 2 mL of acidified UP water and dried under nitrogen flow. The compounds were then successively eluted with 6 mL of MeOH, 3 mL of EtAc, and 2 mL of DCM. The extract was collected in a 15 mL amber glass bottle and stored at -8 °C prior to analysis. Before injection, the solvents were evaporated under a nitrogen flow up to 500 µL, corresponding to the volume of acidified UP water added before evaporation. The extract was then completed to 1 mL with the mobile phase in order to obtain 80% acidified UP water and 20% acidified MeOH in the final extract. Lastly, the extract was filtered through a 0.2 µm syringe filter and 5 µL of injection IS solution were added.
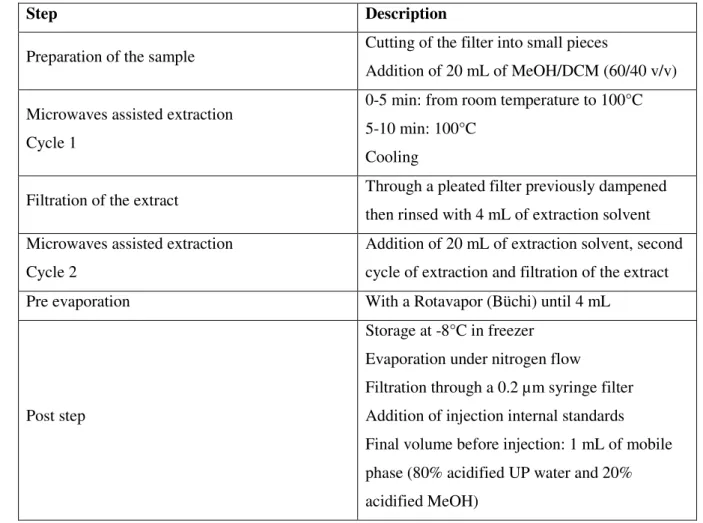
1.3.2. Particulate fraction
Particles were extracted using a closed glassware Multiwave 3000 microwave from Anton Paar (France). The protocol is described in ESM Table S3. First, the filter containing the particles was cut into small pieces and introduced into a PTFE tube. The sample was then extracted by microwaves and using 20 mL of MeOH/DCM (60/40, v/v). The temperature program was set as follows: rise in temperature up to 100 °C for 5 min, then temperature kept at 100 °C for 10 min, and cooling. The extract was then filtered through a pleated filter previously dampened with 4 mL of extraction solvent and collected in a flat-bottom flask. After filtration, the filter was rinsed with 4 mL of extraction solvent in order to avoid any losses. The sample was then extracted a second time with the same protocol and both extracts were combined. The solvent was then pre-evaporated with a Rotavapor from Büchi (France) to 4 mL. The final volume was transferred to a 15 mL amber glass bottle and the flat-bottom flask was rinsed with 2 mL of solvent. The extract was stored at -8 °C and was prepared for injection in the same was as SPE extracts.
1.4. Analysis by HPLC-MS/MS
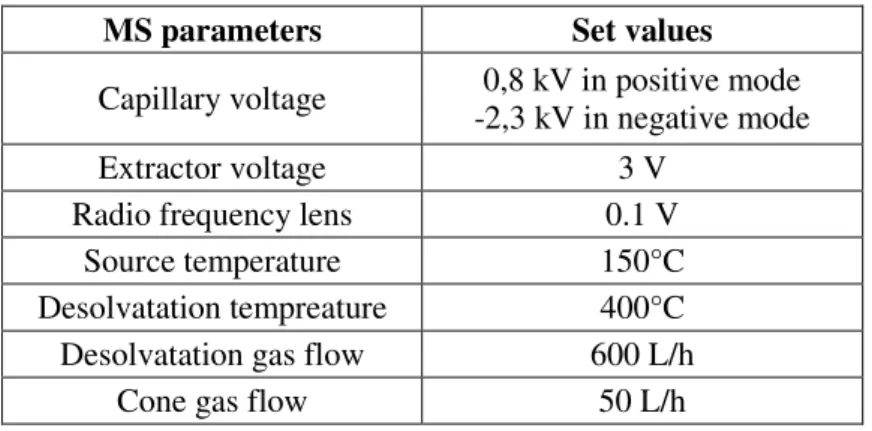
After extraction, the analysis was conducted by Ultra Performance Liquid Chromatography (Waters Acquity®) coupled with triple quadripole mass spectrometry (Waters TQD®). Chromatographic separation was performed on a 100 x 2.1 mm i.d. (1.7 µm) Acquity UPLC® HSS T3 column with its corresponding VanGuard™ pre-column (5 x 2.1 mm, 1.7 µm) from Waters. The flow rate was set at 0.4 mL/min and the column temperature maintained at 40 °C. The injection volume was 10 µL. The mobile phase contained (A) MeOH acidified with HCOOH (0.1% in volume) and (B) UP water acidified with HCOOH (0.1% in volume). The gradient program was: 5% B at 0 min and held for 2 min, increased to 20% B at 2 min, increased to 100% B in 17 min and held for 10 min, decreased to 5% B in 1 min and held for 5 min for column equilibration before the next injection.
Ionization was performed with an ESI source in positive mode for all targeted biocides except for mecoprop, which is only ionized in negative mode. The acquisition was achieved in multiple reaction monitoring. The MS parameters are reported in ESM Table S4. For all biocides, precursor ions were the protonated or deprotonated molecular ion. Compound identification was based on the retention time (RT; ± 0.05 s) and the selected two MS/MS transitions serving as quantifier (the most intense) and qualifier. Information relating to mass transitions, which were optimized by direct infusion, is reported in Table 1. The chromatograms obtained are shown in ESM (Fig. S1, Fig. S2 and Fig. S3).
1.5. Quantification, quality control and method validation
1.5.1. Quantification and quality controlThree isotopically-labelled IS were used to quantify the targeted compounds in order to compensate for any matrix effects or experimental issues. They were added before injection. Mecoprop-d3 was used for the quantification of mecoprop, which is the only compound ionized in negative mode. Other biocides were distributed between the two other internal standards in order to obtain the best linearity. Isoproturon-d6 was used for the quantification of BIT, diuron, IPBC, isoproturon and OIT. Terbuthylazine-d5 was used for the quantification of benzalkonium compounds (C12-C16) carbendazim, CMIT, DCOIT, cybutryn, MIT, tebuconazole, terbuthylazine, terbutryn, thiabendazole. Calibration curves were obtained from spiked standards in mobile phase (A/B, 80/20, v/v) at 0.05, 0.1, 0.25, 0.5, 0.75, 1, 2.5, 5, 10, 25, 75, 150, 250 µg/L and 5 µL of the internal standard solution was added (final concentration of 50 µg/L). The calibration curves were produced by calculating the ratio between each standard area and its corresponding IS area, using quantification transitions. Blanks were injected every 5-6 samples and a 10 µg/L-control was injected at the beginning of the analytical sequence, at mid-sequence and at the end.
Water Air Soil Pollut (2020) 231:210 https://doi.org/10.1007/s11270-020-04546-6
Table 1 Retention times and information relating to mass transitions for the 18-targeted biocides and the three IS
Biocides Retention time (min)
Optimal voltages Precursor
ion Quantification Confirmation Capillary (kV) Cone (V) m/z m/z CE (eV) m/z CE (eV) MIT 2.12 2.5 44 115.98 100.91 22 58.02 20 Carbendazim 4.36 0.6 32 192.09 160.05 18 132.04 30 CMIT 4.75 0.5 40 149.97 115.96 20 57.9 24 Thiabendazole 4.99 0.4 45 202.02 175.05 24 131.01 32 BIT 5.98 2.5 48 152 108.88 21 104.94 22 IPBC 10.44 0.6 28 281.94 164.81 20 56.98 10 Isoproturon 10.67 3.5 32 207.17 71.96 18 165.06 16 Diuron 10.78 3.5 38 233.05 71.97 24 46.03 16 Terbutryn 10.82 0.7 38 242.13 186.04 18 90.93 26 Cybutryn 11.41 0.4 38 254.15 198.07 18 82.97 30 Terbuthylazine 12.08 0.5 28 230.15 174.06 16 96.01 28 Mecoprop 12.11 2.4 28 212.99 140.92 12 70.93 14 OIT 12.94 0.6 32 214.09 101.38 14 56.98 18 Benzalkonium C12 13.6 0.5 55 304.34 90.99 28 212.3 22 Tebuconazole 13.8 0.7 36 308.18 69.94 2 124.99 32 Benzalkonium C14 14.8 0.5 40 332.36 90.95 30 240.3 22 DCOIT 15.53 0.6 32 282.89 169.89 14 57.04 18 Benzalkonium C16 15.76 0.5 48 360.39 90.95 30 268.28 24 Isoproturon-d6 10.63 0.6 32 213.18 77.99 18 51.99 18 Terbuthylazine-d5 12.05 0.5 36 235.13 179 18 100.99 29 Mecoprop-d3 12.08 2.2 30 216.09 143.89 14 70.86 18 1.5.2. Determination of HPLC-MS/MS performances
System repeatability was evaluated from seven replicate injections of solutions at 10 µg/L and 75 µg/L containing all selected biocides. Relative standard deviations (RSD) were calculated for both concentrations. To evaluate the linearity and the intermediate precision of the HPLC-MS/MS method, the calibration curve was repeated five times by changing at least one parameter (day of analysis, preparation of the solutions or mobile phase). Linearity was validated in accordance with the French norm “NF T-90-210”: for each point of the curve, the concentration was re-calculated by using the peak area and that of its corresponding IS. The linearity was validated if the error between the value calculated and the corresponding theoretical value was below 20%. Instrumental limit of detection (LODi) was determined as the lowest concentration for which both quantification and confirmation transitions were detected. LOQi was defined as the concentration from which the analytical method gives a guarantee that RSD was below a targeted value, between 10% and 35% depending on the compound (Mompelat et al. 2015; Slimani et al. 2017; Vial et al. 2003).
1.5.3. Determination of recoveries, LOD and LOQ in the dissolved fraction
To validate the overall method, including extraction step, samples were spiked at least three times at three different concentrations (given in the Table S5 in ESM) with the standard mixture solutions. Relative recoveries were determined using the ratio between the measured concentration in the extract (concentration in spiked sample – concentration in sample without spiking) and the theoretical value. To determine biocide concentrations in real
Water Air Soil Pollut (2020) 231:210 https://doi.org/10.1007/s11270-020-04546-6
samples, each measured concentration was corrected by the recovery in the corresponding matrix. LODD was calculated in accordance with equation 1. Similarly, LOQD was calculated using LOQi.
= ×100×
Equation 1 Calculation of the LOD in the dissolved fraction, where LODi is the instrumental LOD (ng/L), VS
the sample volume (mL), R the recovery (%) and VE the final volume of the extract (always 1 mL)
1.5.4. Determination of recoveries, LOD and LOQ in the particulate fraction
Regarding the particulate fraction, the spiking method is not appropriate. Spiking compounds are more easily mobilized than those absorbed into particles in real samples (Miege et al. 2003). Also, no certified samples are available. Thus, in most studies, standards are added to the extraction solvent and are not linked to particles. In this case, the recoveries obtained may not be representative. On the basis of Geara-Matta’s (2012) validation method and in order to take into account substance-particle interactions, six wastewater samples (matrix containing the most suspended solids, SS) were successively extracted four times and each fraction was separately analyzed. Recoveries of the first two fractions (F1 + F2) were calculated with respect to the total quantity extracted in the four fractions. LODP was calculated in accordance with equation 2. Similarly, LOQP were calculated using to LOQi.
= ×100×
Equation 2 Calculation of the LOD in the particulate fraction, where LODiis the instrumental LOD in (ng/g.dw
dry weight), mssthe quantity of suspended solid (g), R the recovery (%) and VE the final volume of the extract
(always 1 mL) 1.5.5. Determination of matrix effects
Matrix effects were determined for the three IS in all samples by comparing peak areas in mobile phase (AMP) and
in the extracts (AE) in accordance with equation 3. For both, 5 µL of a 10 mg/L solution of IS were added to 1 mL
of mobile phase (acidified UP water/acidified MeOH, 80/20) or to the 1 mL extract.
% = − ! × !""
Equation 3 Calculation of matrix effects where AMP is the area of the IS in the mobile phase and AEthe area of
the IS in the extract
2. Results and discussion
2.1. Method development
2.1.1. UPLC-MS/MS optimization
Two columns were compared: (i) 100 x 2.1 mm i.d. (1.7 µm) Acquity UPLC® BEH C18, selected for its highly apolar nature, and (ii) 100 x 2.1 mm i.d. (1.7 µm) Acquity UPLC® HSS T3, selected for its mixed retentive properties, both from Waters. The HSS T3 column was finally chosen for the following reasons: (i) it allows slightly better retention of the most polar compound MIT (RT of 2.13 min) compared with the BEH C18 column (RT of 1.49 min); (ii) the RT of the last compounds, BZK C16, is almost 5 min lower, which reduces the analysis time; (iii) for compounds with close RT, a slightly better separation is observed on the HSS T3 column (ESM Fig. S4).
The operating conditions for MS (capillary and cone voltages, collision energy, acquisition time and product ions) were optimized for each compound to maximize the response. They are reported in Table 1.
2.1.2. Optimization of SPE
Two different SPE cartridges were tested: Chromabond HR-X (6 mL, 200 mg, Macherey-Nagel), which is made of a divinylbenzene-polystyrene copolymer and with a specific surface area of 1000 m2/g (Wieck et al. 2018), and
Water Air Soil Pollut (2020) 231:210 https://doi.org/10.1007/s11270-020-04546-6
Oasis HLB (6 mL, 200 mg, Waters), which is made of a divinylbenzene-vinyl pyrrolidinone copolymer and with a specific surface area of 810 m2/g (Chen et al. 2012; Cotton et al. 2016; Wick et al. 2010). UP water (100 mL) was spiked at 100 ng/L and loaded on both cartridges. Six replicates were extracted following the protocol reported in ESM Table S2. Recoveries and RSDs were compared (Fig. 1) and statistical tests were performed according to the scheme given in ESM Fig. S5. Fig. 1 shows recoveries between 70% and 90% on both cartridges for most of the biocides, with RSD between 1% and 15%, but a few issues were observed. Lower recoveries were obtained for MIT, which is a small hydrophilic molecule. It is therefore eluted by the sample water. A more hydrophilic stationary phase or a cartridge with a higher specific surface area and phase quantity would have been more appropriate for MIT but not suitable for hydrophobic compounds such as benzalkoniums. Bester and Lamani (2010) reported very low recoveries for MIT (5%) in tap water with a similar cartridge (Hydrophobic DVB, Baker) for similar reasons. Lower recoveries were also obtained for benzalkonium cations. These compounds have long carbon chains and might remain sorbed on the cartridge or on the analytical system. A cationic exchange cartridge such as Strata-X® CW (Phenomenex) would have been more appropriate (Van de Voorde et al. 2012) but not suitable for the other targeted biocides. ESM Table S6 reports the results of the statistical tests. Recoveries were significantly higher with the Chromabond HR-X cartridge for CMIT, MIT, cybutryn, terbuthylazine, thiabendazole and BZK C14, probably because of a higher specific surface area. Also, variability slightly decreased with this cartridge (RSDs from 1% to 53%) compared with the Oasis HLB cartridge (RSD from 5% to 97%), especially for benzalkonium compounds. Therefore, the Chromabond HR-X cartridge was chosen.
Fig. 1 Recoveries of the targeted biocides on the two tested SPE cartridges (mean ± standard deviation)
To determine whether DCM was necessary for the elution, and thus to reduce solvent consumption, three spiked solutions of UP water (100 mL at 100 ng/L) were extracted following the protocol reported in Table S3, except for the elution. Compounds were eluted with (i) 6 mL of MeOH, 3 mL of EtAc, and 2 mL of DCM or (ii) 6 mL of MeOH and 3 mL of EtAc. For most of the biocides, elution without DCM led to slightly higher recoveries but they remained similar (ESM Fig. S6): less than 5% of difference was observed for most of the biocides. Higher differences were obtained for DCOIT (recovery of 42% with DCM vs. 68% without) and tebuconazole (recovery of 64% with DCM vs. 79% without). However, a higher variability was observed for DCOIT and mecoprop without DCM (RSD of 47% and 33% respectively) compared with the elution with DCM (RSD of 17% and 8%
Water Air Soil Pollut (2020) 231:210 https://doi.org/10.1007/s11270-020-04546-6
respectively). A 10-20% increase in recoveries was obtained with DCM for BIT, CMIT, BZK C14 and C16. Consequently, DCM was kept as the third elution solvent.
2.1.3. Optimization of MAE
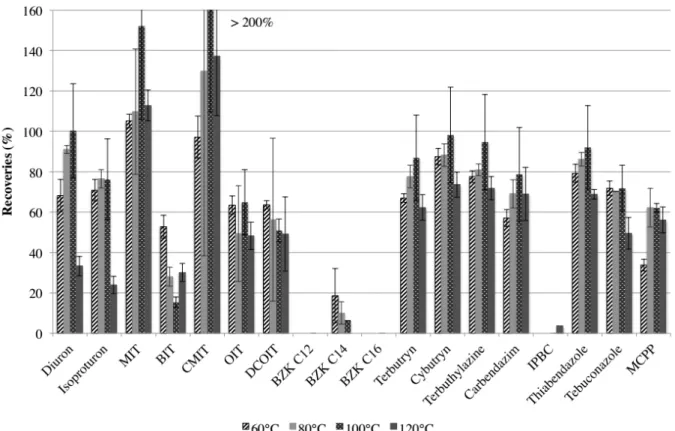
To optimize the MAE procedure, virgin glass fiber filters were spiked with 200 µL of a solution containing all the targeted biocides at 50 µg/L (10 ng on the filter, ESM Fig. S7) and extracted according to the protocol described in ESM Table S3 by varying some parameters. Four different extraction temperatures were tested: 60 °C, 80 °C, 100 °C and 120 °C. Three replicates were extracted for each temperature. Recoveries (with respect to the spiked values)at different temperatures are reported in Fig. 2. For most of the biocides, the optimal extraction temperature was 100 °C: recoveries were between 60% and 90% and RSDs were below 20%. However, low recoveries (from undetected to 40%) were obtained for benzalkonium compounds and IPBC. Thus, a longer temperature plateau and another extraction solvent were tested.
Fig. 2 MAE recovery rates at four different temperatures (mean ± standard deviation)
Three replicates were extracted with a longer temperature plateau (15 min instead of 10 min). For most of the biocides, recoveries were similar (less than 10% of difference) or higher with a shorter extraction time (ESM Fig. S8). Unfortunately, benzalkonium cations remained undetected in the extracts. The shortest temperature plateau of 10 min was thus kept.
Two different solvents were then tested: MeOH/DCM (60/40; v/v) and MeOH + 0.1% HCOOH (v/v) in order to increase benzalkonium recoveries. Three replicates were extracted and recoveries are shown in ESM Fig. S9. Except for DCOIT, slightly lower recoveries were obtained with acidified MeOH (less than 20% lower) and no difference was observed for benzalkonium compounds, which remained undetected. Similar RSDs were observed with MeOH/DCM (1 - 24%) mixture or acidified MeOH (2 - 30%). Thus, MeOH/DCM (60/40; v/v) was kept as extraction solvent.
Although some optimizations were performed, benzalkonium compounds and IPBC remained undetected in the extracts although filters had been spiked. This problem may come from the spiking step. Indeed, the filter was placed in a Petri dish (PTFE) in order to be spiked with 200 µL of a solution containing all the targeted biocides (50 µg/L in MeOH). It was assumed that benzalkonium compounds and IPBC tend to adsorb on the Petri dish instead of the glass fiber filter, which could explain their very low recoveries in all extracts. Consequently, the method was not validated with spiked samples as explained in the materials and methods section, paragraph 1.5.4.
Water Air Soil Pollut (2020) 231:210 https://doi.org/10.1007/s11270-020-04546-6
2.2. Method validation
2.2.1. UPLC-MS/MS
Analytical blanks were analyzed in order to check the absence of any contamination during the analysis. Benzalkonium cations were detected in all analytical blanks. These compounds have long carbon chains and develop strong interactions with the column stationary phase. In order to remove this contamination, the column was rinsed with isopropanol, which has greater elution power for these compounds, for a couple of hours, but to no avail. Hence, only higher concentrations than those measured in blanks were considered. A few studies have reported this contamination, which may come, for example, from the mobile phase, but did not provide any solutions (Friedle et al. 2008; Hepperle et al. 2002; Slimani et al. 2017).
ESM Table S7 reports linearity ranges for all biocides. For isoproturon, BIT, OIT, DCOIT, terbutryn, cybutryn, terbuthylazine, carbendazim, IPBC, thiabendazole, tebuconazole and mecoprop, the linearity range was divided into two calibration curves: from the lowest detected concentration to 10 µg/L and from 10 µg/L to 150 µg/L. For CMIT and benzalkonium compounds, the whole linearity range (up to 150 or 250 µg/L) was validated. For diuron and MIT, smaller linearity ranges were observed (from the lowest detected concentration to 50 µg/L).
Concerning instrumental repeatability, ESM Table S8 reports RSDs of the ratio between compound area and its corresponding IS area for the 18-targeted biocides. They ranged from 2% (isoproturon) to 25% (mecoprop). Generally, RSDs were below 10%, showing a good repeatability.
Concerning intermediate precision, RSDs were satisfactory (< 20%) for the lowest concentration of the linearity range for several biocides (terbutryn, cybutryn, terbuthylazine, carbendazim, thiabendazole, and tebuconazole). This value was thus considered as the LOQi. For MIT and DCOIT, the targeted RSDs were higher than for the other compounds, 35% and 30% respectively. For CMIT and benzalkonium compounds (C12-C16), the targeted value was fixed at 25% as RSDs remained higher than 20% for the whole linearity range.
All instrumental LOQi values are reported in ESM Table S9. LOQi were 0.05 µg/L for isoproturon, terbutryn, cybutryn, terbuthylazine, carbendazim, thiabendazole and tebuconazole, and were hence equal to LODi; between 0.25 and 0.75 µg/L for diuron, MIT, BIT, OIT and DCOIT; 1 µg/L for IPBC and mecoprop; 2.5 µg/L for CMIT and benzalkonium compounds.
2.2.2. SPE recoveries
First, extraction blanks were analyzed: 100 mL, 200 mL and 500 mL of UP water were loaded following the SPE protocol described in ESM Table S2. No contamination was observed in blanks, except for benzalkonium compounds but this contamination did not exceed that observed in analytical blanks.
Mean SPE recoveries and the corresponding RSDs are presented in Table 2 for each matrix. Globally, good recoveries (> 70%) and low variation (< 25%) were observed. However, low recoveries were obtained for benzalkonium compounds: lower than 58% in surface water and WWTP influents/effluents, and than 34% in stormwater and CSOs. Also, significant variability was observed, as RSDs were up to 58% in CSOs for BZK C12. Therefore, only one significant digit was considered for benzalkonium compounds, which is enough to observe differences between matrices and to study the distribution between dissolved and particulate fractions. MIT recoveries ranged from 10% to 26%. The lowest value was obtained in surface waters with a variability of 45%, because of a higher volume load.
Matrix effects were observed as recoveries varied from one matrix to another. For instance, OIT recoveries were close to 100% in surface waters and WWTP effluents, but were lower (76% - 79%) in wastewater, stormwater and CSOs. Wick et al. (2010) also observed such a result for OIT. For some compounds (isoproturon, DCOIT, terbutryn, terbuthylazine, IPBC, tebuconazole and mecoprop), the signal may be exacerbated, leading to recoveries higher than 100% (Chen et al. 2012).
Water Air Soil Pollut (2020) 231:210 https://doi.org/10.1007/s11270-020-04546-6
Table 2 SPE recoveries and RSDs for all the matrices
Biocides Surface waters/rainwater WWTP effluents WWTP
influents Stormwater CSOs SPE recovery (%) RSD (%) SPE recovery (%) RSD (%) SPE recovery (%) RSD (%) SPE recovery (%) RSD (%) SPE recovery (%) RSD (%) Diuron 75 8 100 15 82 33 70 28 79 10 Isoproturon 91 13 118 18 113 26 122 10 89 15 MIT 10 45 15 17 20 67 24 62 26 39 BIT 73 21 87 18 150 44 101 23 74 15 CMIT 62 42 80 28 46 37 52 17 66 31 OIT 97 18 102 11 79 30 78 13 76 17 DCOIT 224 31 234 25 128 66 48 36 184 35 BZK C12 30 51 24 55 34 33 24 58 34 42 BZK C14 32 46 27 22 55 50 20 48 30 41 BZK C16 42 34 58 6 58 55 5 31 7 32 Terbutryn 80 11 110 22 98 38 76 26 79 11 Cybutryn 72 13 94 17 81 33 64 19 74 18 Terbuthylazine 89 23 111 27 97 46 77 33 75 10 Carbendazim 59 14 80 38 82 37 86 9 70 17 IPBC 82 15 116 18 100 40 94 42 98 16 Thiabendazole 67 10 92 22 87 31 81 18 72 22 Tebuconazole 129 42 136 19 122 34 89 25 90 18 Mecoprop 98 28 123 21 110 24 88 13 108 24
2.2.3. MAE recoveries
For each extraction, the absence of contamination was verified by an extraction blank (20 mL of extraction solvent). Again, contamination by benzalkonium compounds was observed but did not exceed that observed in analytical blanks. Only ten biocides among the 18 targeted were quantified in the six samples of wastewater (Fig. 3). Most of them showed good recoveries (> 75%) in the first two fractions (F1 + F2) and RSDs were below 20%. Lower recoveries (equal to 50%) and higher variability (35%) were observed for terbutryn and tebuconazole. For these two compounds, concentrations in real samples were corrected by these recoveries. For the others, concentrations were not corrected by their recovery rates.
2.2.4. Matrix effects
Matrix effects were determined for the three IS and are reported in ESM Table S9. For the dissolved fraction, average matrix effects ranged from -26% in wastewater to -3% in surface waters for isoproturon-d6, from -18% in wastewater to +9% in both treated wastewater and surface waters for terbuthylazine-d5, and from -33% in surface waters to +36% in CSOs for mecoprop-d3. In MAE extracts, they ranged from -8% in treated wastewater to +21% in stormwater for isoproturon-d6, from -4% in treated wastewater to +16% in stormwater for terbuthylazine-d5, and from -31% in treated wastewater to +19% in stormwater for mecoprop-d3.
2.2.5. Limits of detection and quantification
LOD and LOQ are provided in ESM (Table S10 and Table S11, respectively). In the dissolved fraction, LOQD range from 0.08 ng/L to 189 ng/L depending on the compound and the matrix. LODD and LOQD of diuron, isoproturon, OIT, DCOIT, terbutryn, cybutryn, terbuthylazine, carbendazim, thiabendazole and tebuconazole are below 1 ng/L; LODD and LOQD of MIT, BIT, CMIT, IPBC and mecoprop are between 1 and 50 ng/L, and LODD and LOQD of benzalkonium compounds can be higher than 50 ng/L because of higher instrumental limits and lower recoveries. However, all LOQ remain below PNEC values in surface waters and are thus suitable for environmental analysis. In the literature, LOQD vary from one study to another but most of the studies can quantify biocides at concentrations in the range of ng/L or lower (Chen et al. 2012; Moschet et al. 2013; Singer et al. 2010; Van de Voorde et al. 2012; Wieck et al. 2018). In this study, LOQD of BIT, OIT and DCOIT are lower than those
Water Air Soil Pollut (2020) 231:210 https://doi.org/10.1007/s11270-020-04546-6
previously reported by Rafoth et al. (2007), Singer et al. (2010), Wick et al. (2010), and Wieck et al. (2018). For CMIT, Singer et al. (Singer et al. 2010) obtained LOQD of the same order of magnitude (35-40 ng/L) and Wieck et al. (2018) slightly lower (10 ng/L). With regard to benzalkonium compounds, they were quantified by Van de Voorde et al. (2012) at lower concentrations (between 0.07 and 0.09 ng/L). This latter study focused on the analysis of only five quaternary ammonium compounds, whereas the present study describes a multi-residue analysis and extraction issues were encountered.
In the particulate fraction, LODP and LOQP values rely on the mass of extracted particles, which varies from one sample to another: from 10 to 51 mg in rainwater, from 8.5 to 103 mg in surface waters, from 4.3 to 11 mg in WWTP effluents, from 54 to 84 mg in WWTP influents, from 27 to 130 mg in CSOs, and from 28 to 84 mg in stormwater. Consequently, LODP and LOQP values can also vary from one order of magnitude to another, especially in surface waters. Minimum and maximum values are reported in ESM Table S11. For most of the biocides, LOQP values are in the range of few ng/g.dw. As in the dissolved fraction, limits are higher for benzalkonium compounds and isothiazolinones due to higher instrumental limits.
Fig. 3 Amount of biocides collected in each particulate fraction of the six wastewater samples (F1 + F2, F3, F4) compared to the total amount collected (F1 + F2 + F3 + F4)
3. Application to environmental samples
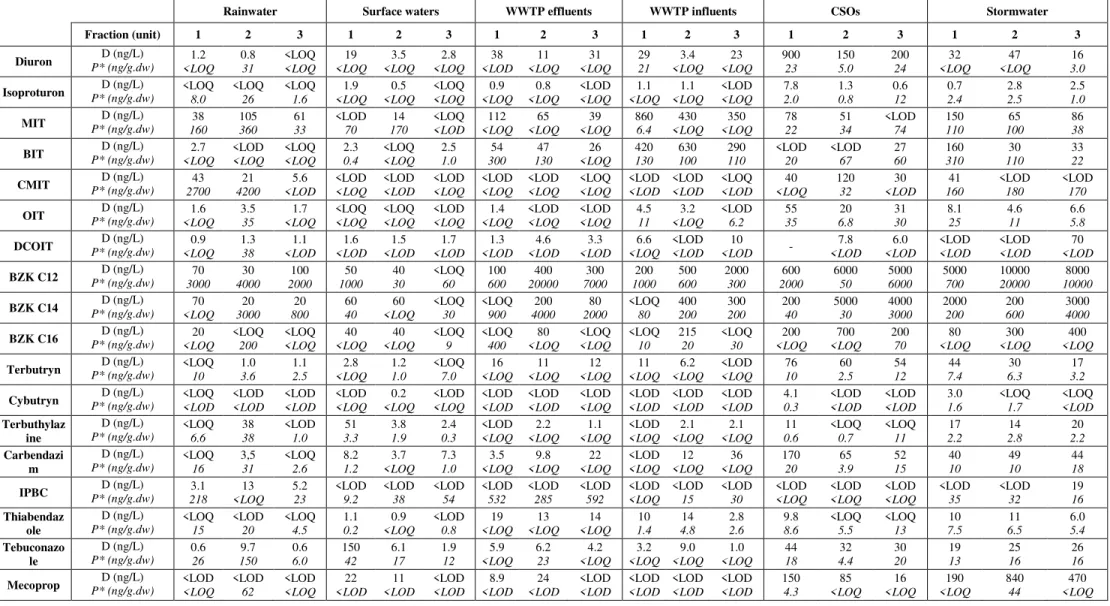
The analytical method was successfully applied to many urban and surface waters. Three sampling campaigns were conducted for each sampling site. The measured concentrations in both dissolved (D ng/L) and particulate (P* ng/g.dw) fractions are reported in Table 3. Results are discussed in terms of total concentrations (sum of dissolved (D) and particulate concentrations (P, P = P* x Css where CSS is the SS concentration in g/L)).
In rainwater, biocides were frequently detected and quantified. Most of them were measured with a total concentration below 5 ng/L (see ESM Table S12). However, some biocides were quantified at higher concentrations: terbuthylazine, IPBC and tebuconazole were once measured at 38, 13 and 10 ng/L respectively and all samples were contaminated by MIT (39-106 ng/L), CMIT (5.6-57 ng/L), BZK C12 (38-149 ng/L), and BZK C14 (19-68 ng/L). Few data are available in the literature concerning biocide concentrations in urban rainwater. A few studies (Bressy et al. 2012; Potter and Coffin 2017; Scheyer et al. 2007; Zgheib et al. 2012) have
Water Air Soil Pollut (2020) 231:210 https://doi.org/10.1007/s11270-020-04546-6
reported dissolved concentrations of diuron, isoproturon, mecoprop and tebuconazole (because of their use as pesticides) much higher than in this work, up to 1.7 µg/L for diuron. A more recent study measured similar dissolved concentrations of terbutryn (0.3-10 ng/L) in Singapore (Zhang et al. 2018).
Three levels of total concentration were observed in WWTP influents: concentrations of MIT, BIT and benzalkonium compounds were significantly higher than 100 ng/L, concentrations of terbutryn, carbendazim, thiabendazole and mecoprop were between 10 and 100 ng/L, and concentrations of isoproturon, CMIT, OIT, DCOIT, cybutryn and IPBC were below 10 ng/L. Concentrations in effluents were of the same order of magnitude, which highlights the limited effects of such treatments to remove those micropollutants. Only MIT and BIT concentrations were significantly lower in effluents compared to influents.
In CSOs, BZK C12 and C14 were measured up to 6 µg/L, diuron up to 0.9 µg/L and BZK C16 up to 0.7 µg/L. Only IPBC was never quantified in both fractions. Concentrations can vary from one order of magnitude to another for MIT, BIT, terbuthylazine, thiabendazole and mecoprop. This could be explained by the variability of storm events (rain intensity, runoff quantity, etc.). In stormwater, BZK C12 was measured with the highest concentrations, up to 20 µg/L. For most of the biocides, concentrations were between 10 and 100 ng/L. Concentrations above 100 ng/L were systematically observed for BZK C14, BZK C16 mecoprop and occasionally for MIT and BIT. Only a few studies have reported some biocide concentrations in stormwater or CSOs (Birch et al. 2011; Gasperi et al. 2008, 2013; Launay et al. 2016; Van de Voorde et al. 2012; Wicke et al. 2015) and only Launay et al. (2016) and Van de Voorde et al. (2012) considered both dissolved and particulate fractions. Significant inter- and intra-study variability was observed, as concentrations depend on the study site, the impervious surface area, or rain intensity. Globally, the concentrations are in agreement with those measured in the present study.
In surface waters, total concentrations were generally below 10 ng/L, but higher concentrations were measured during the first sampling campaign for diuron, BZK C12, terbuthylazine, tebuconazole, and mecoprop. These peaks in concentration might be due to weather and hydrological conditions, as this campaign was conducted during a rainy and flood period. It was also conducted in June, i.e. during a period of pesticide application. Biocides might have leached from soils and building materials. Measured dissolved concentrations occasionally exceeded PNEC values (reported in ESM Table S1) for BZK C12 and diuron. Concentrations of terbuthylazine were of the same order of magnitude as its PNEC. These biocides might therefore represent a risk for aquatic organisms. Generally, most of the biocides were measured in both dissolved and particulate fractions, but they remain mostly dissolved. Only IPBC was rarely quantified in the dissolved fraction while being frequently measured in the particles. The partition between the particulate and the dissolved fractions is reported in ESM Table S13. The particulate proportion were lower than 20% in most of the samples but they were variable and some compounds could occasionally be most present in particles. For example, particulate proportions of MIT, which is the most hydrophilic compound in this study, varied from 0% in WWTP influents/effluents to 100% in surface waters or CSOs. The particulate proportions of terbutryn, the biocide with the highest octanol/water-partitioning coefficient (log Kow of 3.7) in this study, were below 5% in most of the samples and never exceeded 48%. Proportions of biocides in the particulate fraction depend on the matrix and do not seem to be related to the compound’s hydrophobicity. For benzalkonium compounds in particular, their cationic character could also play a role in the sorption mechanisms, as they remained mostly in the dissolved fraction (See ESM Table S13). These results highlight the presence of biocides in particles and thus the need to analyze both dissolved and particulate fractions of water samples in order to assess the transfer of biocides to sediments.
Water Air Soil Pollut (2020) 231:210 https://doi.org/10.1007/s11270-020-04546-6
Table 3 Concentrations of biocides in dissolved (D, in ng/L) and particulate (P*, in ng/g.dw) fractions of different urban waters and surface waters
Rainwater Surface waters WWTP effluents WWTP influents CSOs Stormwater
Fraction (unit) 1 2 3 1 2 3 1 2 3 1 2 3 1 2 3 1 2 3 Diuron P* (ng/g.dw) D (ng/L) 1.2 <LOQ 0.8 31 <LOQ <LOQ 19 <LOQ 3.5 <LOQ 2.8 <LOQ 38 <LOD 11 <LOQ 31 <LOQ 29 21 3.4 <LOQ 23 <LOQ 900 23 150 5.0 200 24 32 <LOQ 47 <LOQ 16 3.0 Isoproturon P* (ng/g.dw)D (ng/L) <LOQ 8.0 <LOQ 26 <LOQ 1.6 1.9 <LOQ 0.5 <LOQ <LOQ <LOQ 0.9 <LOQ 0.8 <LOQ <LOD <LOQ 1.1 <LOQ 1.1 <LOQ <LOD <LOQ 7.8 2.0 1.3 0.8 0.6 12 0.7 2.4 2.8 2.5 2.5 1.0 MIT P* (ng/g.dw)D (ng/L) 38 160 105 360 61 33 <LOD 70 14 170 <LOQ <LOD 112 <LOQ 65 <LOQ 39 <LOQ 860 6.4 430 <LOQ 350 <LOQ 78 22 51 34 <LOD 74 150 110 65 100 86 38 BIT P* (ng/g.dw)D (ng/L) 2.7 <LOQ <LOD <LOQ <LOQ <LOQ 2.3 0.4 <LOQ <LOQ 2.5 1.0 54 300 47 130 26 <LOQ 420 130 630 100 290 110 <LOD 20 <LOD 67 27 60 160 310 30 110 33 22 CMIT P* (ng/g.dw)D (ng/L) 43 2700 21 4200 5.6 <LOD <LOD <LOQ <LOD <LOD <LOD <LOQ <LOD <LOQ <LOD <LOQ <LOQ <LOQ <LOD <LOD <LOD <LOD <LOQ <LOD 40 <LOQ 120 32 30 <LOD 41 160 <LOD 180 <LOD 170 OIT P* (ng/g.dw)D (ng/L) 1.6 <LOQ 3.5 35 1.7 <LOQ <LOQ <LOQ <LOQ <LOQ <LOD <LOQ 1.4 <LOQ <LOD <LOQ <LOD <LOQ 4.5 11 3.2 <LOQ <LOD 6.2 55 35 20 6.8 31 30 8.1 25 4.6 11 6.6 5.8 DCOIT P* (ng/g.dw)D (ng/L) 0.9 <LOQ 1.3 38 1.1 <LOD 1.6 <LOD 1.5 <LOD 1.7 <LOD 1.3 <LOD 4.6 <LOD 3.3 <LOD 6.6 <LOQ <LOD <LOD 10 <LOD - 7.8 <LOD 6.0 <LOD <LOD <LOD <LOD <LOD 70 <LOD BZK C12 P* (ng/g.dw)D (ng/L) 70 3000 30 4000 100 2000 50 1000 40 30 <LOQ 60 100 600 400 20000 300 7000 200 1000 500 600 2000 300 600 2000 6000 50 5000 6000 5000 700 10000 20000 8000 10000 BZK C14 P* (ng/g.dw)D (ng/L) <LOQ70 300020 80020 4060 <LOQ60 <LOQ 30 <LOQ 900 4000200 200080 <LOQ 80 400 200 300 200 200 40 5000 30 4000 3000 2000 200 200 600 3000 4000 BZK C16 P* (ng/g.dw)D (ng/L) 20 <LOQ <LOQ 200 <LOQ <LOQ 40 <LOQ 40 <LOQ <LOQ 9 <LOQ 400 80 <LOQ <LOQ <LOQ <LOQ 10 215 20 <LOQ 30 200 <LOQ 700 <LOQ 200 70 80 <LOQ 300 <LOQ 400 <LOQ Terbutryn P* (ng/g.dw)D (ng/L) <LOQ 10 1.0 3.6 1.1 2.5 2.8 <LOQ 1.2 1.0 <LOQ 7.0 16 <LOQ 11 <LOQ 12 <LOQ 11 <LOQ 6.2 <LOQ <LOD <LOQ 76 10 60 2.5 54 12 44 7.4 30 6.3 17 3.2 Cybutryn P* (ng/g.dw)D (ng/L) <LOQ <LOD <LOD <LOD <LOD <LOD <LOD <LOQ 0.2 <LOQ <LOD <LOQ <LOD <LOD <LOD <LOD <LOD <LOQ <LOD <LOD <LOD <LOD <LOD <LOD 4.1 0.3 <LOD <LOD <LOD <LOD 3.0 1.6 <LOQ 1.7 <LOQ <LOD Terbuthylaz ine D (ng/L) P* (ng/g.dw) <LOQ 6.6 38 38 <LOD 1.0 51 3.3 3.8 1.9 2.4 0.3 <LOD <LOQ 2.2 <LOQ 1.1 <LOQ <LOD <LOQ 2.1 <LOQ 2.1 <LOQ 11 0.6 <LOQ 0.7 <LOQ 11 17 2.2 14 2.8 20 2.2 Carbendazi m D (ng/L) P* (ng/g.dw) <LOQ 16 3,5 31 <LOQ 2.6 8.2 1.2 3.7 <LOQ 7.3 1.0 3.5 <LOQ 9.8 <LOQ 22 <LOQ <LOD <LOQ 12 <LOQ 36 <LOQ 170 20 65 3.9 52 15 40 10 49 10 44 18 IPBC P* (ng/g.dw)D (ng/L) 3.1 218 13 <LOQ 5.2 23 <LOD 9.2 <LOD 38 <LOD 54 <LOD 532 <LOD 285 <LOD 592 <LOD <LOQ <LOD 15 <LOD 30 <LOD <LOQ <LOD <LOQ <LOD <LOQ <LOD 35 <LOD 32 19 16 Thiabendaz ole D (ng/L) P* (ng/g.dw) <LOQ 15 <LOD 20 <LOQ 4.5 1.1 0.2 0.9 <LOQ <LOD 0.8 19 <LOQ 13 <LOQ 14 <LOQ 10 1.4 14 4.8 2.8 2.6 9.8 8.6 <LOQ 5.5 <LOQ 13 10 7.5 11 6.5 6.0 5.4 Tebuconazo le D (ng/L) P* (ng/g.dw) 0.6 26 9.7 150 0.6 6.0 150 42 6.1 17 1.9 12 5.9 <LOQ 6.2 23 4.2 <LOQ 3.2 <LOQ 9.0 <LOQ 1.0 <LOQ 44 18 32 4.4 30 20 19 13 25 16 26 16 Mecoprop P* (ng/g.dw)D (ng/L) <LOD <LOQ <LOD 62 <LOD <LOQ 22 <LOD 11 <LOD <LOD <LOD 8.9 <LOD 24 <LOD <LOD <LOD <LOD <LOD <LOD <LOD <LOD <LOD 150 4.3 85 <LOQ 16 <LOQ 190 <LOQ 840 44 470 <LOQ
Water Air Soil Pollut (2020) 231:210 https://doi.org/10.1007/s11270-020-04546-6
Conclusion
A fast, sensitive and accurate method was developed to analyze by HPLC-MS/MS 18 biocides employed, among other things, in building materials in both dissolved and particulate fractions of many water samples. The dissolved fraction was extracted by SPE, which provides good recoveries for most of the biocides (> 70%), except for MIT (< 25%) and benzalkonium compounds (often lower than 35%), because of their respectively strong hydrophilic and hydrophobic properties. The method developed allows the particulate fraction of diverse water samples to be extracted by MAE, which has rarely been done in previous studies. Thanks to this procedure, biocides can be quantified in samples at trace level, in the range of ng/L in the dissolved fraction and in the range of ng/g.dw in the particulate fraction for most of the biocides and matrices. This method is thus suitable for biocide monitoring in urban and surface waters. It was successfully applied to rainwater, surface waters, WWTP influents and effluents, CSOs, and stormwater. The results highlighted the presence of biocides in both fractions and the relevance of measuring these substances in the particulate fraction. In rainwater, biocides are less frequently quantified. In urban waters, concentrations of biocides ranged from few ng/L to hundreds of ng/L depending on the compound and the sampling campaign. Finally, in surface waters, most of the biocides were measured at less than 10 ng/L, but peaks in concentration were observed after rain events, exceeding PNEC levels. These first results point to a significant transfer of biocides from the urban environment to surface waters via stormwater and treated wastewater discharges, and a potential risk to aquatic organisms.
Author contributions
The manuscript was written through contributions of all authors. All authors have given approval to the final version of the manuscript.
Notes
The authors declare no competing financial interest.
Acknowledgment
The authors gratefully acknowledge the Central Laboratory of the Police Prefecture of Paris (LCPP) for the funding of this work. The study has been performed within the framework of the OPUR research program funded by the Seine-Normandy Water Agency, the City of Paris, the greater Paris sanitation authority (SIAAP), the Hauts-de-Seine Departmental Council, the Hauts-de-Seine Saint-Denis Departmental Council and the Val-de-Marne Departmental Council. The authors also thank the Brigade Fluviale de la Préfecture de Police (Major Bizeray) and the Brigade Fluviale de la Gendarmerie Nationale des Yvelines (Major Duquesnois), the SIAAP (in particular Vincent Rocher, Romain Mailler and Céline Briand) and the City of Paris (in particular Pascale Neveu and Frédéric Béthouart) for their assistance during sampling campaigns.
Water Air Soil Pollut (2020) 231:210 https://doi.org/10.1007/s11270-020-04546-6
Bibliography
Andrade, T. S., Henriques, J. F., Almeida, A. R., Machado, A. L., Koba, O., Giang, P. T., Soares, A. M.V.M., & Domingues, I. (2016). Carbendazim Exposure Induces Developmental, Biochemical and Behavioural Disturbance in Zebrafish Embryos. Aquatic Toxicology, 170, 390–99. https://doi.org/10.1016/j.aquatox.2015.11.017.
Bester, K., & Lamani, X. (2010). Determination of biocides as well as some biocide metabolites from facade run-off waters by solid phase extraction and high performance liquid chromatographic separation and tandem mass spectrometry detection. Journal of Chromatography A, 1217(32), 5204–5214. https://doi.org/10.1016/j.chroma.2010.06.020
Bester, K., Scholes, L., Wahlberg, C., & McArdell, C. S. (2008). Sources and Mass Flows of Xenobiotics in Urban Water Cycles—an Overview on Current Knowledge and Data Gaps. Water Air Soil Pollut, 17.
Birch, H., Mikkelsen, P. S., Jensen, J. K., & Lützhøft, H.-C. H. (2011). Micropollutants in stormwater runoff and combined sewer overflow in the Copenhagen area, Denmark. Water Science & Technology, 64(2), 485–493. https://doi.org/10.2166/wst.2011.687
Bollmann, U. E., Minelgaite, G., Schlüsener, M., Ternes, T., Vollertsen, J., & Bester, K. (2016). Leaching of Terbutryn and Its Photodegradation Products from Artificial Walls under Natural Weather Conditions. Environmental Science & Technology, 50(8), 4289–4295. https://doi.org/10.1021/acs.est.5b05825
Bollmann, U. E., Vollertsen, J., Carmeliet, J., & Bester, K. (2014a). Dynamics of biocide emissions from buildings in a suburban stormwater catchment – Concentrations, mass loads and emission processes. Water Research, 56, 66–76. https://doi.org/10.1016/j.watres.2014.02.033
Bollmann, U. E., Tang, C., Eriksson, E., Jönsson, K., Vollertsen, J., & Bester, K. (2014b). Biocides in urban wastewater treatment plant influent at dry and wet weather: Concentrations, mass flows and possible sources. Water Research, 60, 64–74. https://doi.org/10.1016/j.watres.2014.04.014
Bollmann, U. E., Minelgaite, G., Schlüsener, M., Ternes, T. A., Vollertsen, J., & Bester, K. (2017). Photodegradation of octylisothiazolinone and semi-field emissions from facade coatings. Scientific Reports, 7, 41501-1–9. https://doi.org/10.1038/srep41501
Bressy, A., Gromaire, M.-C., Lorgeoux, C., Saad, M., Leroy, F., & Chebbo, G. (2012). Towards the determination of an optimal scale for stormwater quality management: Micropollutants in a small residential catchment. Water Research, 46(20), 6799–6810. https://doi.org/10.1016/j.watres.2011.12.017
Burkhardt, M., Junghans, M., Zuleeg, S., Boller, M., Schoknecht, U., Lamani, X., Bester, K., Vonbank, R., & Simmler, S. (2009). Biozide in Gebäudefassaden – ökotoxikologische Effekte, Auswaschung und Belastungsabschätzung für Gewässer. Umweltwissenschaften und Schadstoff-Forschung, 21(1), 36–47. https://doi.org/10.1007/s12302-008-0033-1.
Burkhardt, M., Zuleeg, S., Vonbank, R., Bester, K., Carmeliet, J., Boller, M., & Wangler, T. (2012). Leaching of Biocides from Façades under Natural Weather Conditions. Environmental Science & Technology, 46(10), 5497– 5503. https://doi.org/10.1021/es2040009
Burkhardt, M., Zuleeg, S., Vonbank, R., Schmid, P., Hean, S., Lamani, X., et al. (2011). Leaching of additives from construction materials to urban storm water runoff. Water Science & Technology, 63(9), 1974–1982. https://doi.org/10.2166/wst.2011.128
Chen, Z.-F., Ying, G.-G., Lai, H.-J., Chen, F., Su, H.-C., Liu, Y.-S., et al. (2012). Determination of biocides in different environmental matrices by use of ultra-high-performance liquid chromatography–tandem mass spectrometry. Analytical and Bioanalytical Chemistry, 404(10), 3175–3188. https://doi.org/10.1007/s00216-012-6444-2
Chitescu, C. L., Oosterink, E., de Jong, J., & Stolker, A. A. M. L. (2012). Ultrasonic or accelerated solvent extraction followed by U-HPLC-high mass accuracy MS for screening of pharmaceuticals and fungicides in soil and plant samples. Talanta, 88, 653–662.
Cotton, J., Leroux, F., Broudin, S., Poirel, M., Corman, B., Junot, C., & Ducruix, C. (2016). Development and validation of a multiresidue method for the analysis of more than 500 pesticides and drugs in water based on on-line and liquid chromatography coupled to high resolution mass spectrometry. Water Research, 104, 20–27. https://doi.org/10.1016/j.watres.2016.07.075
Water Air Soil Pollut (2020) 231:210 https://doi.org/10.1007/s11270-020-04546-6
Dulio, V., von der Ohe, P. C., Botta, F., Ipolyi, I., Ruedel, H., & Slobodnik, J. (2015). The NORMAN Network - Special view on biocides as emerging substances, présentation Workshop NORMAN, 25-26 juin 2015, Berlin, Allemagne. Berlin. http://www.norman-network.net/?q=node/230
Friedle, A., Thumulla, J., & Snepvangers, K. (2008). Quaternary ammonium compounds (QUAT) in house dust. Indoor Air, 4, 17–22.
Gasperi, J., Garnaud, S., Rocher, V., & Moilleron, R. (2008). Priority pollutants in wastewater and combined sewer overflow. Science of The Total Environment, 407(1), 263–272. https://doi.org/10.1016/j.scitotenv.2008.08.015 Gasperi, J., Sebastian, C., Ruban, V., Delamain, M., Percot, S., Wiest, L., et al. (2013). Micropollutants in urban stormwater: occurrence, concentrations, and atmospheric contributions for a wide range of contaminants in three French catchments. Environmental Science and Pollution Research, 21(8), 5267–5281. https://doi.org/10.1007/s11356-013-2396-0
Geara-Matta, D. (2012). Flux et sources des parabènes, du triclosan et du triclocarban en milieux urbains denses: comparaison entre Paris et Beyrouth. Thèse de doctorat (Sciences de l’Univers et Environnement). Université Paris-Est, 178 p.
Geissen, V., Mol, H., Klumpp, E., Umlauf, G., Nadal, M., van der Ploeg, M., et al. (2015). Emerging pollutants in the environment: A challenge for water resource management. International Soil and Water Conservation Research, 3(1), 57–65. https://doi.org/10.1016/j.iswcr.2015.03.002
Hepperle, J., Schüle, E., Kolberg, D., & Scherbaum, E. (2002). Determination of quaternary ammonium compound residues in fruits and vegetables by QuEChERS following LC-MS/MS analysis. 5 p. https://pdfs.semanticscholar.org/9f07/d9f1ae9b695391792d05fb5027df23225585.pdf
Hildebrandt, A., Lacorte, S., & Barceló, D. (2007). Assessment of priority pesticides, degradation products, and pesticide adjuvants in groundwaters and top soils from agricultural areas of the Ebro river basin. Analytical and Bioanalytical Chemistry, 387, 1459–1468.
Huang, O., Zhang, J., Xiong, S., Peng, X., Wei, G., Liu, L., et al. (2018). Development of Ultrasound-Assisted Extraction of Commonly Used Azole Antifungals in Soils. Analytical Methods, 10(44), 5265–5272.
Jiang, J., Wu, S., Wang, Y., An, X., Cai, L., Zhao, X., & Wu, C. (2015). Carbendazim Has the Potential to Induce Oxidative Stress, Apoptosis, Immunotoxicity and Endocrine Disruption during Zebrafish Larvae Development. Toxicology in Vitro, 29 (7), 1473–81. https://doi.org/10.1016/j.tiv.2015.06.003.
Juksu, K., Zhao, J.-L., Liu, Y.-S., Yao, L., Sarin, C., Sreesai, S., et al. (2019). Occurrence, fate and risk assessment of biocides in wastewater treatment plants and aquatic environments in Thailand. Science of The Total Environment, 690, 1110–1119.
Kalogridi, E.-C., Christophoridis, C., Bizani, E., Drimaropoulou, G., & Fytianos, K. (2014). Part II: temporal and spatial distribution of multiclass pesticide residues in lake sediments of northern Greece: application of an optimized MAE-LC-MS/MS pretreatment and analytical method. Environmental Science and Pollution Research, 21(12), 7252–7262.
Launay, M. A., Dittmer, U., & Steinmetz, H. (2016). Organic micropollutants discharged by combined sewer overflows – Characterisation of pollutant sources and stormwater-related processes. Water Research, 104, 82–92. https://doi.org/10.1016/j.watres.2016.07.068
Masiá, A., Vásquez, K., Campo, J., & Picó, Y. (2015). Assessment of two extraction methods to determine pesticides in soils, sediments and sludges. Application to the Túria River Basin. Journal of Chromatography A, 1378, 19–31. https://doi.org/10.1016/j.chroma.2014.11.079
Merel, S., Benzing, S., Gleiser, C., Di Napoli-Davis, G., & Zwiener, C. (2018). Occurrence and overlooked sources of the biocide carbendazim in wastewater and surface water. Environmental Pollution, 239, 512–521. https://doi.org/10.1016/j.envpol.2018.04.040
Miege, C., Dugay, J., & Hennion, M. C. (2003). Optimization, validation and comparison of various extraction techniques for the trace determination of polycyclic aromatic hydrocarbons in sewage sludges by liquid chromatography coupled to diode-array and fluorescence detection. Journal of Chromatography A, 995(1–2), 87– 97.
Water Air Soil Pollut (2020) 231:210 https://doi.org/10.1007/s11270-020-04546-6
antifouling booster biocide Irgarol 1051 on periphyton, plankton and ecosystem function in freshwater pond mesocosms. Aquatic Toxicology, 90(2), 109–120. https://doi.org/10.1016/j.aquatox.2008.08.004
Mompelat, S., Fourmond, M.-P., Laurentie, M., Verdon, E., Hurtaud-Pessel, D., & Abjean, J.-P. (2015). Validation of a liquid chromatography–high-resolution mass spectrometry method for the analysis of ceftiofur in poultry muscle, kidneys and plasma: A unique accuracy profile for each and every matrix. Journal of Chromatography A, 1407, 119–129. https://doi.org/10.1016/j.chroma.2015.06.043
Moschet, C., Piazzoli, A., Singer, H., & Hollender, J. (2013). Alleviating the reference standard dilemma using systematic exact mass suspect screening approach with liquid chromatography-high resolution mass spectrometry. Analytical Chemistry, 85, 10312–10320.
Moschet, C., Wittmer, I., Simovic, J., Junghans, M., Piazzoli, A., Singer, H. P., et al. (2014). How a Complete Pesticide Screening Changes the Assessment of Surface Water Quality. Environmental Science & Technology, 48(10), 5423–5432. https://doi.org/10.1021/es500371t
Östman, M., Lindberg, R. H., Fick, J., Björn, E., & Tysklind, M. (2017). Screening of biocides, metals and antibiotics in Swedish sewage sludge and wastewater. Water research, 115, 318–328.
Paijens, C., Bressy, A., Frère, B., & Moilleron, R. (2019). Prioritization of leached biocides from building materials towards aquatic environment monitoring (in French). Techniques Sciences Méthodes, 12 2019.
https://doi.org/10.36904/tsm/201912197
Paijens, C., Bressy, A., Frère, B., & Moilleron, R. (2020). Biocide emissions from building materials during wet weather: identification of substances, mechanism of release and transfer to the aquatic environment. Environmental Science and Pollution Research. https://doi.org/10.1007/s11356-019-06608-7
Potter, T. L., & Coffin, A. W. (2017). Assessing pesticide wet deposition risk within a small agricultural watershed in the Southeastern Coastal Plain (USA). Science of The Total Environment, 580, 158–167.
Rafoth, A., Gabriel, S., Sacher, F., & Brauch, H.-J. (2007). Analysis of isothiazolinones in environmental waters by gas chromatography–mass spectrometry. Journal of Chromatography A, 1164(1–2), 74–81. https://doi.org/10.1016/j.chroma.2007.07.040
Sánchez-Rodríguez, A., Sosa-Ferrera, Z., & Santana-Rodríguez, J. J. (2011). Applicability of microwave-assisted extraction combined with LC–MS/MS in the evaluation of booster biocide levels in harbour sediments. Chemosphere, 82, 96–102.
Scheyer, A., Morville, S., Mirabel, P., & Millet, M. (2007). Pesticides analysed in rainwater in Alsace region (Eastern France): Comparison between urban and rural sites. Atmospheric Environment, 41, 7241–7252.
Shah, J., Jan, M. R., Ara, B., & Shehzad, F.-N. (2011). Quantification of triazine herbicides in soil by microwave-assisted extraction and high-performance liquid chromatography. Environmental Monitoring and Assessment, 178(111–119).
Singer, H. P., Jaus, S., Hanke, I., Lück, A., Hollender, J., & Alder, A. C. (2010). Determination of biocides and pesticides by on-line solid phase extraction coupled with mass spectrometry and their behaviour in wastewater and surface water. Environmental Pollution, 158(10), 3054–3064. https://doi.org/10.1016/j.envpol.2010.06.013 Slimani, K., Féret, A., Pirotais, Y., Maris, P., Abjean, J.-P., & Hurtaud-Pessel, D. (2017). Liquid chromatography-tandem mass spectrometry multiresidue method for the analysis of quaternary ammonium compounds in cheese and milk products: Development and validation using the total error approach. Journal of Chromatography A, 1517, 86–96. https://doi.org/10.1016/j.chroma.2017.08.034
Stipičević, S., Galzina, N., Udiković-Kolić, N., Jurina, T., Mendaš, G., Dvoršćak, M., et al. (2015). Distribution of terbuthylazine and atrazine residues in crop-cultivated soil: The effect of herbicide application rate on herbicide persistence. Geoderma, 259–260, 300–309.
Uhl, M., Gans, O., Grillitsch, B., Fürhacker, M., & Kreuzinger, N. (2005). Grundlagen Zur Risikoabschätzung Für Quaternäre Ammoniumverbindungen, 157 p.
http://www.academia.edu/download/40282155/Grundlagen_zur_Risikoabschtzung_fr_quate20151122-11272-eisz97.pdf.
Van de Voorde, A., Lorgeoux, C., Gromaire, M.-C., & Chebbo, G. (2012). Analysis of quaternary ammonium compounds in urban stormwater samples. Environmental Pollution, 164, 150–157.