HAL Id: hal-02672550
https://hal.inrae.fr/hal-02672550
Submitted on 31 May 2020HAL is a multi-disciplinary open access
archive for the deposit and dissemination of sci-entific research documents, whether they are pub-lished or not. The documents may come from teaching and research institutions in France or abroad, or from public or private research centers.
L’archive ouverte pluridisciplinaire HAL, est destinée au dépôt et à la diffusion de documents scientifiques de niveau recherche, publiés ou non, émanant des établissements d’enseignement et de recherche français ou étrangers, des laboratoires publics ou privés.
Copyright
composition traits in pigs.
Denis Milan, Jean Pierre Bidanel, Nathalie Iannuccelli, Juliette Riquet, Yves
Amigues, Joseph Gruand, Pascale Le Roy, Christine Renard, Claude Chevalet
To cite this version:
Denis Milan, Jean Pierre Bidanel, Nathalie Iannuccelli, Juliette Riquet, Yves Amigues, et al.. De-tection of quantitative trait loci for carcass composition traits in pigs.. Genetics Selection Evolution, BioMed Central, 2002, 34, pp.705-728. �hal-02672550�
DOI: 10.1051/gse:2002026
Original article
Detection of quantitative trait loci
for carcass composition traits in pigs
Denis M
ILANa∗, Jean-Pierre B
IDANELb∗, Nathalie I
ANNUCCELLIa,
Juliette R
IQUETa, Yves A
MIGUESc, Joseph G
RUANDd,
Pascale L
ER
OYb, Christine R
ENARDe, Claude C
HEVALETa aLaboratoire de génétique cellulaire, Institut national de la recherche agronomique,31326 Castanet-Tolosan Cedex, France
bStation de génétique quantitative et appliquée,
Institut national de la recherche agronomique, 78352 Jouy-en-Josas Cedex, France
cLABOGENA, Institut national de la recherche agronomique,
78352 Jouy-en-Josas Cedex, France
dStation expérimentale de sélection porcine,
Institut national de la recherche agronomique, 86480 Rouillé, France
eLaboratoire de radiobiologie et d’étude du génome,
Institut national de la recherche agronomique, 78352 Jouy-en-Josas Cedex, France (Received 9 January 2002; accepted 9 April 2002)
Abstract – A quantitative trait locus (QTL) analysis of carcass composition data from a three-generation experimental cross between Meishan (MS) and Large White (LW) pig breeds is presented. A total of 488 F2 males issued from six F1 boars and 23 F1 sows, the progeny of six LW boars and six MS sows, were slaughtered at approximately 80 kg live weight and were submitted to a standardised cutting of the carcass. Fifteen traits, i.e. dressing percentage, loin, ham, shoulder, belly, backfat, leaf fat, feet and head weights, two backfat thickness and
one muscle depth measurements, ham+ loin and back + leaf fat percentages and estimated
carcass lean content were analysed. Animals were typed for a total of 137 markers covering the entire porcine genome. Analyses were performed using a line-cross (LC) regression method where founder lines were assumed to be fixed for different QTL alleles and a half/full sib (HFS) maximum likelihood method where allele substitution effects were estimated within each half-/full-sib family. Additional analyses were performed to search for multiple linked QTL and imprinting effects. Significant gene effects were evidenced for both leanness and fatness traits in the telomeric regions of SSC 1q and SSC 2p, on SSC 4, SSC 7 and SSC X. Additional significant QTL were identified for ham weight on SSC 5, for head weight on SSC 1 and SSC 7, for feet weight on SSC 7 and for dressing percentage on SSC X. LW alleles were associated with a higher lean content and a lower fat content of the carcass, except for the fatness trait on
∗Correspondence and reprints
SSC 7. Suggestive evidence of linked QTL on SSC 7 and of imprinting effects on SSC 6, SSC 7, SSC 9 and SSC 17 were also obtained.
pig / gene mapping / quantitative trait locus / carcass composition
1. INTRODUCTION
The development of genetic maps in livestock species over the last ten years has allowed genomic regions contributing to the genetic variation of quantitative traits to be detected. A number of experiments have been set up in pigs to identify quantitative trait loci (QTL) associated with major economically important traits (e.g. [1, 13, 33, 40–42, 45]).
An F2 cross between Large White and Chinese Meishan pig breeds was developed at Inra in order to map QTL that affect a large number of traits of interest [7]. These two breeds exhibit large differences in growth performance, body composition, meat quality and behaviour (e.g. [4]), so that genes with large and intermediate effects are likely to segregate in second-generation crosses between the two breeds. A genome-wide scan using a panel of 137 markers was performed in this F2 population with 530 males and 573 females. The analysis of growth traits and ultrasonic backfat thickness revealed the existence of several genomic regions that significantly contribute to the genetic variation of these traits [7]. This second paper reports the results obtained for carcass composition traits, i.e. dressing percentage, carcass cut weights and carcass lean and fat content.
2. MATERIALS AND METHODS 2.1. Animals and data recording
A three-generation resource population was developed at the Inra experi-mental research farm of Le Magneraud (Surgères, Charente-Maritime, referred to as Le Magneraud hereafter) by first mating six unrelated Large White boars to six lowly related Meishan sows (one boar/sow). The 12 founder animals were tested and were found to be free of the mutation at the ryanodyne receptor locus that is responsible for halothane susceptibility. One boar and four gilts were kept for breeding in each of the six litters produced (except in one litter were only three females were available). Three or four F1 females were assigned to each of the F1 boars and were mated to produce as large as possible families of F2 piglets. Assignments were performed so as to minimise the relationships. Six F1 females were culled early and were removed from the experiment. The 17 remaining sows were allowed to produce up to 13 litters. Two of the six males were culled before the end of the experiment. Their females were reassigned to the four remaining males in order to produce new
full-sib families. A total of 573 F2 females and 530 males were used for QTL mapping.
The F1 sows were managed under a batch farrowing system, with a 3-week interval between the contiguous batches. These batches then became postwean-ing and fattenpostwean-ing batches of growpostwean-ing pigs. The piglets were weaned at 4 weeks of age and placed in collective pens in a postweaning unit until 10 weeks of age. Male piglets were not castrated and were transferred at 10 weeks of age to another Inra experimental herd (SESP, Rouillé, Vienne, hereafter referred to as Rouillé).
When arriving in Rouillé, male piglets were allotted to pens of about 10 animals in a semi-open building. They were given a diet ad libitum containing 17% crude protein, 0.85% lysine and 3 100 kcal digestible energy during the whole testing period from 10 to 22 weeks of age. They were then slaughtered when they reached 90 kg live weight or 180 days of age at an Inra experimental slaughterhouse located in Saint-Gilles (Ille-et-Vilaine). Pigs weighing less than 50 kg were discarded from the carcass measurement protocol, which would have been meaningless. A total of 488 male pigs were hence dissected. The size of full-sib families were in the range 7–46 and sire half-sib families in the range 59–123.
Two backfat thickness (X2and X4) and one muscle depth (X5) measurements
were taken shortly after slaughter using a “Fat-o-Meater” probe. X2 was
measured between the 3rd and the 4th lumbar vertebrae at 8 cm from the spine. X4and X5measurements were taken simultaneously three vertebrae beneath
the last rib at 6 cm from the mid-dorsal line. The day after slaughter, the whole carcass and the right carcass side were weighed. This latter measurement was considered as the net half-carcass weight on which all subsequent calculations were based. The kidney and leaf fat were removed and the half-carcass was divided into seven cuts. The front and back feet were separated from the limbs at the levels of the carpal bones and tibio-tarsal joint, respectively. The ham was isolated along a first line parallel to the general direction of the sacrum and a second line perpendicular to the long axis of the carcass between the last lumbar and the first sacral vertebrae. The loin was separated from the belly and the shoulder with a cut starting under the psoas muscle at the level of the last lumbar vertebra and ending under the blade bone. The belly and the shoulder were separated with a cut perpendicular to the long axis of the carcass between the 5th and the 6th rib. The backfat was dissected from the loin, but the other cuts remained untrimmed.
2.2. Traits analysed
Fifteen traits were defined and analysed from the above-mentioned measurements, i.e.:
• dressing percentage, computed as the ratio of carcass to live weight multi-plied by 100;
• loin, ham, shoulder, belly, backfat, leaf fat, feet and head weights; • X2, X4and X5measurements;
• (ham + loin) and (back + leaf fat) proportions in the carcass, expressed as percentages;
• estimated carcass lean content (ECLC), estimated from the weight of 5 carcass cuts, expressed as a proportion of half carcass weight, according to the following equation [30]: ECLC= −3.539 + 75.1 (proportion of ham) + 121.6 (proportion of loin) − 61 (proportion of backfat) − 45.3 (proportion of leaf fat)+ 32.8 (proportion of belly).
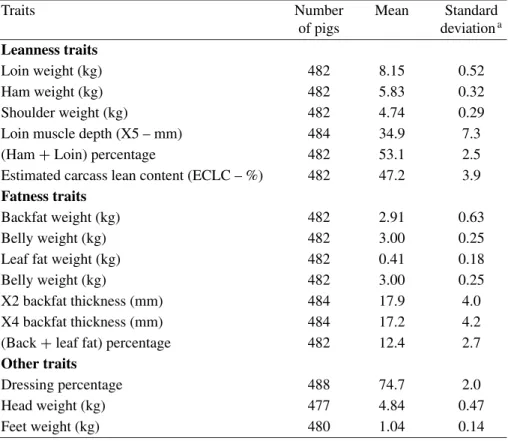
The number of records, overall means and “residual” (i.e. corrected for environmental effects) phenotypic standard deviations of the 15 traits studied are shown in Table I. Phenotypic correlations between the traits corrected for environmental effects are given in Table II.
Table I. Overall means and phenotypic standard deviations of the 15 traits studied.
Traits Number Mean Standard
of pigs deviationa
Leanness traits
Loin weight (kg) 482 8.15 0.52
Ham weight (kg) 482 5.83 0.32
Shoulder weight (kg) 482 4.74 0.29 Loin muscle depth (X5 – mm) 484 34.9 7.3 (Ham+ Loin) percentage 482 53.1 2.5 Estimated carcass lean content (ECLC – %) 482 47.2 3.9
Fatness traits
Backfat weight (kg) 482 2.91 0.63
Belly weight (kg) 482 3.00 0.25
Leaf fat weight (kg) 482 0.41 0.18
Belly weight (kg) 482 3.00 0.25
X2 backfat thickness (mm) 484 17.9 4.0 X4 backfat thickness (mm) 484 17.2 4.2 (Back+ leaf fat) percentage 482 12.4 2.7
Other traits
Dressing percentage 488 74.7 2.0
Head weight (kg) 477 4.84 0.47
Feet weight (kg) 480 1.04 0.14
T a ble II. Phenotypic correlations between the 15 traits studied a, b . Ham S houlder X 5 L oin (Ham + loin) E CLC B ackf at L eaf fa t B elly X2 X4 (Back + leaf) D ressing Head F eet wt wt depth % (%) w t w t w t b ackf at b ackf at fat % % wt wt L o in wt 0.42 ∗∗∗ − 0. 07 0.18 ∗∗∗ 0.85 ∗∗∗ 0.83 ∗∗∗ − 0. 64 ∗∗∗ − 0. 31 ∗∗∗ − 0. 35 ∗∗∗ − 0. 57 ∗∗∗ − 0. 59 ∗∗∗ − 0. 61 ∗∗∗ − 0. 04 − 0. 00 0.01 Ham w t – 0.17 ∗∗∗ 0.11 ∗ 0.71 ∗∗∗ 0.65 ∗∗∗ − 0. 64 ∗∗∗ − 0. 42 ∗∗∗ − 0. 40 ∗∗∗ − 0. 53 ∗∗∗ − 0. 54 ∗∗∗ − 0. 63 ∗∗∗ 0.05 0.12 ∗∗ 0.24 ∗∗∗ S houlder w t – − 0. 21 ∗∗∗ 0.09 0.21 ∗∗∗ − 0. 43 ∗∗∗ − 0. 50 ∗∗∗ − 0. 28 ∗∗∗ − 0. 43 ∗∗∗ − 0. 41 ∗∗∗ − 0. 48 ∗∗∗ − 0. 06 0.50 ∗∗∗ 0.51 ∗∗∗ X5 L o in depth – 0.12 ∗∗ 0.06 0.00 0.23 ∗∗∗ 0.03 0.12 ∗∗ 0.05 0.07 0.03 − 0. 28 ∗∗∗ − 0. 28 ∗∗∗ (Ham + loin)% – 0 .97 ∗∗∗ − 0. 83 ∗∗∗ − 0. 51 ∗∗∗ − 0. 54 ∗∗∗ − 0. 73 ∗∗∗ − 0. 75 ∗∗∗ − 0. 83 ∗∗∗ 0.00 0.21 ∗∗∗ 0.26 ∗∗∗ ECLC(%) – − 0. 92 ∗∗∗ − 0. 60 ∗∗∗ − 0. 45 ∗∗∗ − 0. 80 ∗∗∗ − 0. 83 ∗∗∗ − 0. 92 ∗∗∗ − 0. 02 0.31 ∗∗∗ 0.35 ∗∗∗ Backf at w t – 0.65 ∗∗∗ 0.42 ∗∗∗ 0.84 ∗∗∗ 0.88 ∗∗∗ 0.96 ∗∗∗ 0.02 − 0. 48 ∗∗∗ − 0. 50 ∗∗∗ L eaf fa t w t – 0.35 ∗∗∗ 0.63 ∗∗∗ 0.66 ∗∗∗ 0.77 ∗∗∗ − 0. 01 − 0. 58 ∗∗∗ − 0. 62 ∗∗∗ Belly wt –0 .4 6 ∗∗∗ 0.44 ∗∗∗ 0.42 ∗∗∗ − 0. 03 − 0. 32 ∗∗∗ − 0. 39 ∗∗∗ X2 back fa t –0 .8 5 ∗∗∗ 0.85 ∗∗∗ 0.00 − 0. 47 ∗∗∗ − 0. 47 ∗∗∗ X4 backf at –0 .8 8 ∗∗∗ 0.03 − 0. 49 ∗∗∗ − 0. 51 ∗∗∗ (Back + leaf) fat % –0 .0 2 − 0. 52 ∗∗∗ − 0. 56 ∗∗∗ Dressing % – − 0. 07 − 0. 05 Head wt 0.73 ∗∗∗ aAdjusted for m ajor en vironmental ef fects (see te x t). b ∗; ∗∗; ∗∗∗ = P < 0. 05; P < 0. 01; P < 0. 001, respecti v ely .
2.3. Genotyping and map construction
A whole-genome scan was performed using a panel of 123 microsatellite markers and the major histocompatibility complex (SLA). The panel was complemented by 13 additional microsatellite markers used in families with homozygous markers in QTL chromosomal regions. The panel of markers covered all 18 autosomes and the X chromosome. The number of markers per chromosome ranged from 3 (SSC 18) to 12 (SSC 7). Genotypes were obtained for all F0, F1 and F2 pigs as described by Bidanel et al. [7]. Multipoint linkage analyses were carried out for males, females and both sexes with the 2.4 version of the CriMap software [20]. Recombination units were then transformed to map distances using the Haldane mapping function. A graphic representation of the average map obtained is shown in Bidanel et al. [7].
2.4. Statistical analyses
Phenotypic data were first adjusted for systematic environmental effects. Adjustment factors were obtained using a mixed linear model, i.e. assuming a polygenic inheritance, as described in Bidanel et al. [7]. The model included the contemporary group as a fixed effect, birth litter, the additive genetic value of each animal and a residual error term as random effects and slaughter weight as a covariate. The data˜y used for QTL mapping were obtained by subtracting estimates of environmental effects from the data y, i.e. as: ˜y = y − Xˆb − Wˆp. Estimates of fixed effects ( ˆb) and of common birth litter effects (ˆp) were obtained as backsolutions from restricted maximum likelihood analyses [35]. The computations were performed using VCE software [31].
Two types of interval mapping analyses were performed: (1) a line cross analysis assuming that founder populations are fixed for different QTL alleles (referred to as the LC model hereafter); (2) a model assuming that the F2 population is a mixture of full and half-sib families and making no assumption about the number of QTL alleles and allele frequencies within the founder populations (referred to as the HFS model hereafter).
The LC analysis was performed using the software developed by Haley
et al. [21]. The model used assumed a diallelic QTL with alternative alleles
fixed in founder breeds, i.e. QQ in Meishan (with effect a) and qq in Large White (with effect−a) animals. The adjusted performance ˜yi of an F2 offspring i
could be written as:
˜yi= µ + caia+ cdid+ ei (1)
whereµ is the population mean, caiand cdiare the coefficients of additive (a) and
dominance (d) components, respectively, for animal i at a given position and ei
is the residual error. caiand cdiwere computed as cai= Prob(QQi) − Prob(qqi)
the genotype XXi. The genotype probabilities were computed as described in
Haley et al. [21] considering only the most probable phase. At each location (each cM), an F ratio was computed comparing the model with one QTL (1) to an equivalent model without any linked QTL. Estimates for a and d were calculated at the location with the highest F ratio.
Additional line cross analyses were performed to test the presence of family × QTL interactions, of imprinting effects and of linked QTL. Models with either sire× QTL or dam × QTL interactions were run to test the differences in QTL effects between families, which would suggest the existence of different QTL alleles in founder populations. Models with sire× QTL and dam × QTL interactions were first compared with a no-QTL model, giving F-tests with 12 and 46 degrees of freedom, respectively. They were then compared to the best single QTL model, giving F-tests with 10 and 44 degrees of freedom, respectively.
The presence of imprinting effects was investigated as suggested by Knott
et al. [25] by adding a third effect in the model in order to test the differences
between the two classes of heterozygotes, defined according to the paternal or maternal origin of grandparental (MS or LW) alleles. This model was first contrasted with a no QTL model (F test with 3 d.f. in the numerator). When significant, it was compared with the best one-QTL model to test the significance of imprinting effects.
The presence of two QTL in the same linkage group was tested by adding additive and dominance effects for a second QTL in the model and carrying out a two-dimensional search, fitting the coefficients for all possible combinations of two positions on the chromosome. Two F-statistics were computed. The first F-value, with 4 d.f. in the numerator, was obtained by contrasting the two-QTL with a no-QTL model. When F4df was significant, a second F-value
(with 2 d.f.) was computed by contrasting the two-QTL model with the best single-QTL model.
To better investigate the possibility that a QTL segregates in one or both founder populations, we also carried out analyses under an HFS approach with a single QTL model [27]. The F2 population was supposed to be structured in 24 full-sib families nested within six independent sire families. Hence, a dam mated to different sires was considered as a different dam for each sire. The test statistics was computed as the ratio of likelihoods under the hypotheses of one (H1) vs. no (H0) QTL linked to the set of markers considered. Under the H1 hypothesis, a QTL with a gene substitution effect for each sire and each dam was fitted to the data. Sire genotypes were considered as correctly rebuilt due to the large family size, so that only the most probable sire phase was considered. Conversely, all dam phases with a probability higher than 0.10 were considered, so that the likelihood could not be entirely linearised.
Further details on the likelihood computation procedures can be found in Le Roy et al. [27] and Bidanel et al. [7]. Average substitution effects, which in the present case are equivalent to additive values (a), were estimated within each sire and dam families as explained by Bidanel et al. [7] at the location with the highest likelihood ratio.
Three significance levels, i.e. suggestive and genome-wide significant and highly significant linkages were defined as proposed by Lander and Kruglyak [26]. Suggestive linkage was defined as the probability to obtain, by chance, one significant result per genome analysis. Considering that 19 independent chromosomes were analysed and assuming the number of signi-ficant chromosomes to follow a binomial distribution, the required threshold on a chromosome level Pc is such that 19Pc = 1, i.e. Pc ∼ 0.05 [25]. The
chromosomal test significance level Pc corresponding to a genome-wide test
probability Pgwas obtained using the Bonferroni correction, i.e. as a solution
to: Pg= 1 − (1 − Pc)19, which gives Pc= 0.0027 and 5.3 10−5, respectively,
for Pg= 0.05 and 0.001 [25].
Significance thresholds were determined empirically by data permutation as described by Churchill and Doerge [10] for the line cross analyses and by simulating the data assuming a polygenic infinitesimal model and a normal distribution of performance traits for the half/full sib analysis [27]. A total of 10 000 to 50 000 permutations or simulations were performed for each chromosome× trait combination. Approximate confidence intervals of QTL position were determined empirically by the “drop-off” method [26].
Models with imprinting, with two QTL and with sire× QTL or dam within sire× QTL interactions were tested using approximate significance thresholds obtained as described by Knott et al. [25]. The threshold F ratio obtained from the null hypothesis was converted into a probability of the F ratio under a standard F distribution with two degrees of freedom in the numerator. It was then possible to obtain the F ratio that would give the same probability under a distribution with one, three or four degrees of freedom from standard F tables. Genome-wide suggestive and significant (P< 0.05) thresholds were, respectively, 9.0, 4.7, 4.1, 2.7, 1.8 and 14.3, 6.8, 5.7, 3.5 and 2.1 for F ratios with 1, 3, 4, 10, and 44 degrees of freedom.
3. RESULTS
The results showing associations with at least a suggestive level of sig-nificance obtained using both line-cross and half/full sib models are given in Tables III, IV and V, respectively, for leanness, fatness and the remaining traits. Chromosomal regions affecting leanness and fatness traits were generally the same, so that the results will be commented jointly.
T a ble III. Results of QTL analyses for leanness traits. P osition and estimated QTL ef fects at the higher test statistics v alue. L ine cross m odel H alf/full sib m odel Tr ai t a SSC Position and confi dence interv al (cM) F -ratio S ignifi cance le v el b Additi v e va lu e c (± S.E.) Dominance va lu e (± S.E.) Position and confi dence interv al (cM) LR d S ignifi cance le v el b Additi v e va lu e c % v ariance e L o in wt (kg) 1 169 (163–175) 13.8 ∗∗∗ − 0. 15 ± 0. 03 0. 17 ± 0. 05 – f –n s – 6 .8 Ham w t (kg) 1 175 (161–175) 12.2 ∗∗ − 0. 08 ± 0. 02 0. 05 ± 0. 03 – – ns – 4 .1 (Ham + loin)% 1 175 (165–175) 17.8 ∗∗∗ − 0. 79 ± 0. 16 0. 76 ± 0. 23 – – ns – 7 .5 E C L C (%) 1 175 (165–175) 15.3 ∗∗∗ − 1. 11 ± 0. 25 1. 23 ± 0. 36 – – ns – 6 .7 L o in wt (kg) 2 0 (0–18) 14.6 ∗∗∗ − 0. 17 ± 0. 03 0. 01 ± 0. 05 2 (0–43) 63.6 +− 0. 18 5.3 (Ham + loin)% 2 0 (0–22) 12.3 ∗∗ − 0. 76 ± 0. 16 0. 31 ± 0. 23 0 (0–23) 58.3 +− 0. 85 5.1 E C L C (%) 2 0 (0–20) 14.2 ∗∗∗ − 1. 29 ± 0. 25 0. 51 ± 0. 37 0 (0–25) 61.8 +− 1. 42 5.9 Ham w t (kg) 5 118 (102–127) 14.7 ∗∗∗ − 0. 11 ± 0. 02 0. 02 ± 0. 04 109 (94–121) 76.2 ∗∗ − 0. 10 6.4 (Ham + loin)% 5 118 (89–127) 6.6 +− 0. 67 ± 0. 18 0. 16 ± 0. 33 – – ns – 3 .7 (Ham + loin)% 6 – – n s – – 2 7 (8–40) 57.8 +− 0. 28 0.6 L o in wt (kg) 7 9 7 (81–111) 11.4 ∗∗ − 0. 13 ± 0. 03 0. 16 ± 0. 05 141 (127–159) 72 ∗ − 0. 13 6.7 Ham w t (kg) 7 7 1 (54–96) 6.5 + 0. 05 ± 0. 02 0. 06 ± 0. 03 14 (119–154) 56.1 + 0.01 2.2 S houlder w t (kg) 7 6 7 (61–82) 70.7 ∗∗∗ 0. 20 ± 0. 02 0. 01 ± 0. 03 66 (61–72) 183.3 ∗∗∗ 0.18 22.8 (Ham + loin)% 7 6 4 (53–73) 9.6 ∗ 0. 48 ± 0. 17 0. 82 ± 0. 26 139 (125–156) 65.2 +− 0. 27 4.6 E C L C (%) 7 63 (55–70) 18.3 ∗∗∗ 1. 24 ± 0. 26 1. 36 ± 0. 40 138 (125–157) 65.2 +− 0. 40 8.2 X5 (mm) 7 6 8 (60–86) 17.2 ∗∗∗ − 2. 85 ± 0. 49 − 0. 22 ± 0. 75 67 (32–83) 78.4 ∗∗ − 2. 81 7.6 Ham w t (kg) 8 6 0 (46–82) 8.8 +− 0. 07 ± 0. 02 − 0. 08 ± 0. 04 71 (34–79) 54.6 +− 0. 08 4.4 S houlder w t (kg) 9 9 1 (65–108) 6.3 + 0. 03 ± 0. 02 − 0. 13 ± 0. 04 – – ns – 5 .3 Ham w t (kg) 12 – – ns – – 110 (93–113) 58.2 +− 0. 05 1.2 L o in wt (kg) 14 96 (83–112) 7.1 +− 0. 13 ± 0. 04 − 0. 13 ± 0. 07 – – ns – 5 .6 L o in wt (kg) X 8 6 (78–92) 64.0 ∗∗∗ − 0. 40 ± 0. 05 – 8 4 (69–94) 97.2 ∗∗∗ − 0. 43 36.2 Ham w t (kg) X 7 5 (68–83) 58.6 ∗∗∗ − 0. 20 ± 0. 03 – 7 7 (67–87) 75.8 ∗∗∗ − 0. 20 19.5 S houlder w t (kg) X – – n s – – 123 (110–136) 60.5 ∗ − 0. 05 1.5 (Ham + loin)% X 8 2 (76–88) 88.9 ∗∗∗ − 2. 31 ± 0. 25 – 8 4 (75–91) 118.6 ∗∗∗ − 2. 48 43.7 E C L C (%) X 82 (76–88) 83.8 ∗∗∗ − 3. 57 ± 0. 39 – 8 3 (74–91) 113.7 ∗∗∗ − 3. 81 42.3 X5 (mm) X – – n s – – 3 3 (5–77) 55.9 +− 0. 79 0.6 aSee T able II for the definition o f the traits. b ∗; ∗∗; ∗∗∗ = 5%, 1 % and 0.1% genome-wide signifi cance le v els, respecti v ely; += suggesti v e linkage; n s = no suggesti v e linkage. c Meishan – L ar ge White allele. d LR = lik elihood ratio. e Genetic v ariance at the Q TL based o n estimated additi v e and dominance ef fects and allele frequencies o f 1/ 2, as a p ercentage of the residual phenotypic v ariance in the F 2 . fNot estimated.
Ta b le IV . Results of QTL analyses for fatness traits. P osition and estimated QTL ef fects at the higher test statistics v alue. L ine cross m odel H alf/full sib m odel Tr ai t a SSC Position and confi dence interv al (cM) F -ratio S ignifi cance le v el b Additi v e va lu e c (± S.E.) Dominance va lu e (± S.E.) Position and confi dence interv al (cM) LR d S ignifi cance le v el b Additi v e va lu e c % v ariance e Backf at w t (kg) 1 175 (160–175) 6.8 + 0. 11 ± 0. 04 − 0. 15 ± 0. 06 – f –n s – 3 .1 L eaf fa t w t (kg) 1 175 (163–175) 9.8 ∗ 0. 02 ± 0. 01 − 0. 07 ± 0. 02 – – ns – 4 .2 (Back + leaf fa t)% 1 175 (162–175) 9.6 ∗ 0. 54 ± 0. 18 − 0. 82 ± 0. 25 – – ns – 4 .3 Backf at w t (kg) 2 0 (0–28) 9.3 ∗ 0. 17 ± 0. 04 − 0. 09 ± 0. 06 – – ns – 4 .1 (Back + leaf fa t)% 2 4 (0–28) 10.1 ∗ 0. 78 ± 0. 19 − 0. 54 ± 0. 30 – – ns – 5 .2 x2 (mm) 2 0 (0–33) 6.9 + 0. 90 ± 0. 26 − 0. 39 ± 0. 37 – – ns – 2 .7 x4 (mm) 2 0 (0–30) 7.1 + 0. 95 ± 0. 26 − 0. 29 ± 0. 37 – – ns – 2 .7 Backf at w t (kg) 4 7 4 (54–84) 6.3 + 0. 15 ± 0. 04 0. 02 ± 0. 06 65 (13–86) 54.9 + 0.17 2.8 Belly wt (kg) 4 – – n s – – 7 5 (46–92) 70.6 ∗ 0.02 0.3 x2 (mm) 4 7 5 (60–81) 7.5 + 0. 95 ± 0. 25 − 0. 16 ± 0. 36 – – ns – 2 .8 x4 (mm) 4 7 5 (62–81) 12.3 ∗∗ 1. 23 ± 0. 25 − 0. 06 ± 0. 36 65 (43–83) 75.4 ∗∗ 1.45 4.4 x2 (mm) 5 6 4 (32–80) 8.9 + 1. 24 ± 0. 29 0. 13 ± 0. 48 37 (19–46) 59.5 + 1.11 4.7 Belly wt (kg) 5 110 (90–127) 6.8 + 0. 06 ± 0. 02 − 0. 01 ± 0. 03 – – ns – 3 .2 Belly wt (kg) 6 – – n s – – 1 5 (2–32) 62.5 +− 0. 03 0.6 Backf at w t (kg) 7 6 5 (57–73) 39.0 ∗∗∗ − 0. 33 ± 0. 04 − 0. 20 ± 0. 06 65 (56–73) 94.4 ∗∗∗ − 0. 32 16.3 L eaf fa t w t (kg) 7 6 6 (61–70) 80.2 ∗∗∗ − 0. 12 ± 0. 01 − 0. 07 ± 0. 02 65 (51–72) 139.6 ∗∗∗ − 0. 12 28.2 Belly wt (kg) 7 6 5 (57–80) 18.2 ∗∗∗ − 0. 10 ± 0. 02 − 0. 02 ± 0. 02 59 (52–85) 91.7 ∗∗∗ − 0. 10 7.4 (Back + leaf fa t)% 7 65 (59–71) 55.4 ∗∗∗ − 1. 65 ± 0. 17 − 0. 95 ± 0. 26 65 (57–71) 119.4 ∗∗∗ − 1. 64 21.9 x2 (mm) 7 6 5 (57–73) 38.6 ∗∗∗ − 2. 07 ± 0. 25 − 0. 93 ± 0. 38 61 (54–69) 101.6 ∗∗∗ − 2. 10 14.5 x4 (mm) 7 6 7 (60–74) 40.5 ∗∗∗ − 2. 00 ± 0. 25 − 1. 43 ± 0. 39 64 (55–74) 97.1 ∗∗∗ − 2. 19 14.5 Belly wt (kg) 8 6 1 (46–77) 8.2 + 0. 07 ± 0. 02 0. 04 ± 0. 03 128 (90–148) 54.2 + 0.04 4.4 Backf at w t (kg) 11 9 (0–47) 6.1 + 0. 12 ± 0. 04 − 0. 17 ± 0. 07 – – ns – 3 .6 (Back + leaf fa t)% 1 1 1 4 (0–44) 6.5 + 0. 54 ± 0. 19 − 0. 63 ± 0. 30 – – ns – 3 .4 Belly wt (kg) 11 106 (76–113) 6.4 + 0. 04 ± 0. 02 0. 07 ± 0. 03 1 (0–9) 54.5 + 0.03 3.6 x2 (mm) 11 23 (5–47) 6.2 + 0. 85 ± 0. 27 − 0. 73 ± 0. 45 36 (16–49) 59.1 + 1.29 3.0 Backf at w t (kg) X 7 9 (71–85) 89.2 ∗∗∗ 0. 57 ± 0. 06 – 8 (69–87) 112.5 ∗∗∗ 0.57 40.9 L eaf fa t w t (kg) X 124 (109–138) 9.9 ∗ 0. 06 ± 0. 02 – 121 (109–137) 54.9 + 0.08 5.6 Belly wt (kg) X 8 2 (71–90) 31.6 ∗∗∗ 0. 14 ± 0. 02 – 8 3 (64–115) 57.1 + 0.14 15.7 (Back + leaf fa t)% X 80 (71–87) 70.0 ∗∗∗ 2. 23 ± 0. 27 – 8 1 (68–98) 88.8 ∗∗∗ 2.20 34.4 x2 (mm) X 7 7 (69–85) 56.5 ∗∗∗ 2. 73 ± 0. 36 – 8 3 (71–100) 71.6 ∗∗∗ 2.79 22.8 x4 (mm) X 8 3 (76–89) 74.0 ∗∗∗ 3. 42 ± 0. 40 – 8 4 (75–94) 92.5 ∗∗∗ 3.48 33.8 aSee T able II for the definition o f the traits. b *; ∗∗; ∗∗∗ = 5%, 1 % and 0.1% genome-wide signifi cance le v els, respecti v ely; += suggesti v e linkage; n s = no suggesti v e linkage. c Meishan – L ar ge White allele. d LR = lik elihood ratio. e Genetic v ariance at the Q TL based o n estimated additi v e and dominance ef fects and allele frequencies o f 1/ 2, as a p ercentage of the residual phenotypic v ariance in the F 2 . fNot estimated.
Ta b le V . Results of QTL analyses for the other traits. P osition and es timated QTL ef fects at the higher test statistics v alue. Line cross m odel H alf/full sib m odel Tr ai t a SSC Position and confidence inte rv al (c M) F-rat io Si gni ficance le v el b Additi v e va lu e c (± S.E.) Dominance va lu e (± S.E.) Position and confidence inte rv al (c M) LR d Si gni ficance le v el b Additi v e va lu e c % v ari ance e Head wt (kg) 1 9 2 (80–105) 14.5 ∗∗∗ 0. 16 ± 0. 03 0. 13 ± 0. 06 80 (56–99) 56.1 + 0.16 7.8 Head wt (kg) 2 122 (106–140) 6.5 + 0. 06 ± 0. 03 − 0. 16 ± 0. 05 – f – n s – 3.6 Feet wt (kg) 2 118 (106–129) 6.3 + 0. 01 ± 0. 01 − 0. 05 ± 0. 01 – – ns – 3 .3 Dressing % 4 – – ns – – 19 (5–40) 58.5 + 0.08 0.1 Head wt (kg) 7 6 6 (62–70) 149.8 ∗∗∗ 0. 43 ± 0. 03 0. 08 ± 0. 04 66 (62–71) 287.7 ∗∗∗ 0.42 42.3 Feet wt (kg) 7 6 5 (61–69) 186.5 ∗∗∗ 0. 13 ± 0. 01 0. 06 ± 0. 01 65 (61–70) 294.9 ∗∗∗ 0.13 49.7 Head wt (kg) 8 – – n s – – 8 5 (55–104) 56.4 +− 0. 02 0.1 Feet wt (kg) 8 2 9 (16–70) 8.2 +− 0. 04 ± 0. 01 − 0. 02 ± 0. 02 65 (47–83) 57.2 +− 0. 03 4.6 Dressing % X 131 (82–125) 10.5 ∗ − 0. 95 ± 0. 22 – – – n s – 11.6 a Se e T ab le II for the de finition o f the tra its. b ∗; ∗∗; ∗∗∗ = 5% , 1 % and 0.1% genome-wide significance le v els, respecti v ely; += suggesti v e linkage; ns = no suggesti v e linkage. c Me isha n – L ar g e W hite alle le . d LR = lik elihood ratio. e Genet ic v ari ance at th e Q TL based o n est im at ed addi ti v e and domi n ance ef fect s and al le le frequenci es o f 1/ 2, as a p ercentage of the residual phenotypic v ariance in the F2. f Not est im at ed.
3.1. Fatness and leanness traits
Six different chromosomal regions reached genome-wide significance for at least one fatness/leanness trait. Five of these regions located on SSC 1, 2, 5, 7 and X were highly significant (Pg < 0.001). LC and HFS analyses often
led to similar QTL effects and positions, but lower significance levels were generally obtained with HFS as compared to LC analyses. A QTL explaining, respectively, 3–5% and 1–2% of the phenotypic variance of leanness and fatness traits was located at the end of the long arm of SSC 1, close to the SW1301 marker. Large White alleles were associated with higher lean cut weights and lower fat cut weights. They exhibited complete dominance over Meishan alleles for leanness traits and overdominance for fatness traits. The QTL located near the SW2443 marker at the extremity of the short arm of SSC 2 had similar additive effects (5% of the phenotypic variance) on loin weight and (ham+ loin) percentage. Yet, it did not significantly affect ham weight and had stronger effects than the SSC 1 QTL on fatness traits (3–4% vs. 1–2% of the phenotypic variance) and, as a consequence, ECLC. Large White alleles were also favourable, but without any significant dominance effect.
The SSC 5 QTL significantly affected ham weight and, as a consequence (ham+ loin) percentage, with a favourable additive effect of the Large White alleles. Its most likely position was in the interval between markers SW378 and SW967. It also had suggestive effects on belly weight, Large White alleles being associated with a lower belly weight. Another suggestive association was obtained for backfat thickness (X2measurement), but at a rather different
most likely position (64 vs. 118 cM).
Both LC and HFS models evidenced a highly significant QTL for all fatness traits in the SLA-S0102 interval on SSC 7. The QTL explained 12–24% of the phenotypic variance of fatness traits. Meishan alleles were associated with reduced carcass fatness and were partially dominant over Large White alleles. A QTL explaining respectively 7, 8 and 23% of the phenotypic variance of X5,
belly and shoulder weights was also located in the SLA-S0102 interval with both models. Meishan alleles had purely additive effects and led to an increased shoulder weight, but decreased belly weight and X5measurements. HFS and
LC models gave less consistent results for the remaining leanness traits. QTL located at different positions were obtained for loin (at 97 and 141 cM using LC and HFS models, respectively) and for ham weight, (ham+ loin)% and ECLC (at 63–71 and 138–140 cM, respectively, using LC and HFS models).
A QTL explaining 20, 36, 41, 23, 34, 42 and 44% of the phenotypic variance of, respectively, ham, loin and backfat weights, X2, X4, (ham+ loin)% and
ECLC values was evidenced near the SW1994 marker on SSC X. Large White alleles led to decreased fatness trait and increased leanness trait values. The same chromosomal region also had highly significant effects on belly weight, but with a positive effect of the Meishan alleles. Finally, a suggestive QTL
with positive effects of Meishan alleles on leaf fat weight was evidenced at a somewhat different position (between markers SW1943 and S0218).
The last QTL with genome-wide significant effects leanness and fatness traits was located in the S0001–SW1089 interval on SSC 4. The QTL had a significant effect on X4 measurement and suggestive effects on X2 values,
backfat and belly weights. Meishan alleles had positive, i.e. unfavourable, purely additive effects on fatness traits.
Six additional chromosomal regions on SSC 6, 8, 9, 11, 12 and 14 reached a suggestive level of significance (Pc < 0.05). Favourable effects of Large
White alleles were obtained for ham weight on SSC 6, 8, 11 and 12, for loin weight on SSC 14 and for backfat measurements on SSC 11, whereas Meishan alleles led to increased belly weights on SSC 8 and 11.
3.2. Other traits
Two chromosomal regions located on SSC 1 and SSC 7 had highly significant effects on head weight (Tab. V). The SSC 1 QTL was located in the S0396– S0113 interval and explained 6% of the phenotypic variance of head weight. Meishan alleles were partially dominant over Large White alleles and were associated with heavier heads. The SSC 7 QTL was located in the SLA– S0102 interval and had a very large effect on head weight, but also on feet weight (respectively, 42 and 46% of the phenotypic variance). Meishan alleles had purely additive effects and led to increased head weights. An additional suggestive QTL was detected on SSC 8, but LC and HFS models gave different most likely positions. Large White alleles were associated with heavier heads and feet.
Two QTL were identified on dressing percentage. The first one was a suggestive QTL explaining 1% of the phenotypic variance and located in the S0227–SW2547 interval on the short arm of SSC 4. Meishan alleles were associated with a larger dressing percentage. The second QTL was located on chromosome X in the SW1943–S0218 interval. It explained 12% of the phenotypic variance of dressing percentage, with favourable Large White alleles.
3.3. Additional analyses
Additional genome scans using more complex models did not reveal any sire× QTL or dam × QTL interactions. Conversely, as shown in Table VI, suggestive evidence of imprinting effects was obtained for the SSC 7 QTL on belly weight. A second imprinted QTL was suggested for belly weight and (ham+ loin)% on SSC 9 near the suggestive QTL affecting shoulder weight (see Tab. III). Two additional imprinted QTL that had not previously been detected were suggested for X4 on chromosome 6 and dressing percentage
Ta b le V I. Results from fi tting a m odel with imprinting. T rait a SSC Location F3df b F1df c i± S. E . d a ± S. E . d ± S. E . Belly wt (kg) 7 6 3 16.0 ∗∗∗ 10.5 +− 0. 05 ± 0. 02 − 0. 09 ± 0. 02 − 0. 01 ± 0. 02 Belly wt (kg) 9 105 6.7 + 9.2 +− 0. 08 ± 0. 02 − 0. 04 ± 0. 02 0. 03 ± 0. 03 x4 (mm) 6 5 5 5 .5 9.3 +− 1. 0 ± 0. 3 − 0. 4 ± 0. 3 − 0. 7 ± 0. 3 (Ham + loin)% 9 92 4.6 8 .2 + 0. 7 ± 0. 2 − 0. 3 ± 0. 2 − 0. 1 ± 0. 4 Dressing % 1 7 2 4 3 .16 8 .54 +− 0. 5 ± 0. 2 − 0. 2 ± 0. 20 .4 ± 0. 3 a See T able II for the definition of the traits. b Model { 4} vs. Model without QTL; ∗∗∗ 0.1% genome-wide significance le v el; + suggesti v e linkage. c Model { 4} vs. Model { 1} with best single QTL. d i, a, d = estimates of imprinting, additi v e and dominance ef fects, respecti v ely ± standard error; a and i are computed as the ef fects o f m aternal (Meishan) – p aternal (Lar g e W hite) alleles. A ne g ati v e i v alue thus indicates a higher expression of the paternally inherited allele.
on chromosome 17. Estimated imprinting effects indicated that heterozygous individuals that had received the Large White allele from the male parent had larger shoulder weight, X4and dressing percentage values, but a lower (ham
+ loin)% than those who had received it from the female parent. Estimates of additive and dominance effects on belly weight on SSC 7 remained similar to those obtained using the model without imprinting.
Results from the two-QTL genome scan are shown in Table VII. A single trait × chromosome combination, i.e. shoulder weight on SSC 7, reached a suggestive level of significance. The first QTL (QTL1) had almost the same most likely position as that obtained using a single QTL model. The second QTL (QTL2) was located in the S0102–SW352 interval, 17 cM apart from QTL1. The estimated additive effect for QTL1 and QTL2 were very similar. The QTL1 estimate was halved as compared to the estimate from the single QTL model. Contrary to single QTL results, where close to zero dominance effects were obtained, significant dominance effects were detected for both QTL. Estimates were of the same magnitude, but with opposite signs. It should be noted that the sum of additive and dominance effects of the two QTL was very similar to the estimates from the single QTL model.
4. DISCUSSION
The present study confirmed the existence of several QTL contributing to large differences in carcass composition between Chinese Meishan and Large White pig populations and accurately estimated their effects on carcass cut weights. The telomeric region of SSC 1q was shown to influence loin eye area and trimmed wholesale product weight by Rohrer and Keele [41]. The present study shows that Large White alleles have favourable effects on both lean and fat cut weights, with slightly larger effects on lean cuts than on fat cut weight. This genomic area has also been identified as affecting backfat thickness [6, 13, 39, 40], postweaning growth rate [6, 34, 39], as well as vertebra number in a Meishan × Göttingen cross [44]. Two candidate genes, i.e. steroidogenic factor 1 and a LIM homeodomain transcription factor (Lhx3) were recently identified in this region [43].
Similarly, the QTL located in the telomeric area of SSC 2p affected both lean and, to a lesser extent, fat tissue weights. Its most likely position was very similar to those of the QTL evidenced by Jeon et al. [23] and Nezer et al. [32] in, respectively, Wild Boar × Large White and Piétrain × Large White F2 populations. Yet, the QTL evidenced in the present study had a much lower effect than these two QTL (around 5% vs. 30% of the phenotypic variance in Jeon et al., [23] and, contrary to the two other studies, did not exhibit any significant imprinting effect. Hence, the IGF2 locus, which was shown to
T a ble V II. Results from fi tting tw o Q TL. Position c Estimates d T rait SSC F4df a F2df b LQTL1 LQTL2 aQTL1 ± S. E . aQTL2 ± S. E . dQTL1 ± S. E . dQTL2 ± S. E . Shoulder w t (kg) 7 38.5 ∗∗∗ 6.1 + 63 80 0. 10 ± 0. 03 0. 10 ± 0. 04 0. 10 ± 0. 03 − 0. 12 ± 0. 04 a Model { 3} vs. Model without QTL; + P < 0. 05 at a chromosome-wide le v el; ∗∗∗ P < 0. 001 at a g enome-wide le v el. b Model { 3} vs. Model { 1} with best single QTL. c Most lik ely position of QTL1 and Q TL2, respecti v ely . d Estimates of additi v e (a) and dominance ef fects o f Q TL1 and Q TL2, respecti v ely ,± standard error .
be paternally imprinted and is considered as a strong positional candidate by Nezer et al. [32], might not be involved in our population. Another possible explanation would be that the imprinting effects at the IGF2 locus are population (or haplotype) dependent.
The SSC 4 QTL had significant or suggestive effects on subcutaneous fat measurements, but did not affect lean deposition. This result was consistent with the available literature results which indicate significant QTL effects for fatness traits in several populations [1, 2, 6, 25, 29, 36, 45]. Significant effects on leanness traits were reported in Wild Boar× Large White [2] and Iberian × Landrace [36] F2 pigs, but not in Meishan× Large White crosses. This fatness QTL, called FAT1 by Marklund et al. [29], was shown in a joint analysis of several QTL experiments to have a larger effect in Wild boar× Large White crosses than in the other populations [46]. The effects of this chromosomal region were also evidenced on intramuscular fat content by de Koning et al. [13] and Rattink et al. [38] and on fatty acid composition by Pérez-Enciso et al. [36], who hypothesised that these effects might be pleiotropic effects of the FAT1 locus. Some studies also detected growth QTL in the same chromosomal area [1, 6, 36, 45, 47]. Yet, their most likely positions do not exactly coincide with that of FAT1. The difference is generally small (around 10 cM), so that confidence intervals overlap, but is consistent across studies. Growth and fatness effects might thus be due to different QTL. No obvious positional candidate locus has so far been identified for FAT1. Gerbens et al. [17] localised the adipocyte fatty acid-binding protein (A-FABP) gene on SSC 4 and suggested it might control fat distribution in pigs. Yet, further studies [18] did not support this hypothesis.
The SSC 7 QTL located in the SLA region primarily affected fatness traits, with favourable effects of the Meishan alleles on both subcutaneous and internal fat. It explained a much larger fraction of the phenotypic variance than SSC 1, SSC 2 and SSC 4 QTL (14 and 24% for backfat and leaf fat weights, respectively, vs. less than 5% for the other 3 QTL). The QTL position and the effects of Meishan alleles are in agreement with the results obtained by Rohrer and Keele [40] on leaf fat weight and those evidenced for backfat thickness in Meishan× Large White crosses by several authors [6,13,39,40,42,44,45, 47]. Numerous genes can be proposed as positional candidates in this region which has a high gene density and is highly polymorphic (e.g. see [8]). SSC 7 effects on leanness traits were less clear. Significant effects were obtained using both LC and HFS models, but with different most likely positions for some of the traits investigated (in particular ham and loin weights). Moreover, Meishan alleles had both favourable (ham, shoulder) and unfavourable (loin, belly) effects on carcass cut weights. No leanness QTL had been reported before on SSC 7. In particular, Rohrer and Keele [41] did not obtain any evidence of a QTL on SSC 7 for trimmed whole sale product weight.
Several studies have reported effects of SSC X on backfat thickness [6, 22, 39, 40], but only Rohrer and Keele [40, 41] reported significant effects on leanness traits, i.e. loin eye area and trimmed whole sale product weight. Our study shows that backfat, ham and loin weights are all affected, with favourable effects of Large White alleles. These effects are particularly important, explaining for instance 36 and 41% of the phenotypic variances of loin and backfat weight, respectively.
New QTL were evidenced for ham weight on SSC 5, head weight on SSC 1 and SSC 7, feet weight on SSC 7 and dressing percentage on SSC X. Conversely, the QTL with genome-wide significant effects on backfat thickness detected by Bidanel et al. [7] on SSC 5 and SSC 6 were not confirmed in the present study. QTL were found to affect ham and, to a lesser extent, belly weight on SSC 5 at a position which is close to that obtained by Malek et al. [28], but widely differs from the position obtained by Bidanel et al. [7] – 110 vs. 40 cM –, for backfat thickness. Similarly, the QTL with suggestive effects on belly weight and (ham+ loin) percentage on SSC 6 are located at about 40 cM from the backfat thickness QTL detected by Bidanel et al. [7]. The significant QTL evidenced on SSC 1, SSC 7 and the suggestive one on SSC 8 for head and feet weights, which are indicators of skeletal development, had not been previously reported. Andersson-Eklund et al. [3] showed suggestive evidence of a QTL affecting femur dimensions on SSC 2, but its most likely position somewhat differs (around 20 cM) from that of the QTL suggested in our study. The strong effects of the SSC 7 QTL (respectively, 42 and 46% of the phenotypic variance of head and feet weights) has to be emphasised. Its most likely position is the same as those of growth and fatness QTL evidenced in the SLA region (Bidanel et al. , [7] and the present study). It is unfortunately impossible to know from available results whether the observed effects were due to pleiotropic effects of a single locus or to effects of closely linked genes. Yet, it should be mentioned that, on the contrary to growth and fatness traits, Meishan alleles at the SSC 7 QTL were associated with heavier feet and head weights, i.e. were in the same direction as breed differences [5, 6]. Several suggestive QTL were also identified on SSC 6, SSC 8, SSC 9, SSC 11, SSC 12 and SSC 14. However, their positions do not correspond to previously reported leanness or fatness positions on these chromosomes.
It has to be noticed that the QTL located on chromosomes 7 and X are the only ones that influence all carcass cuts measurements. The other QTL consequently affect specific parts of the carcass and it is of interest to see that their effects are generally consistent with correlations between traits. As shown in Table II, the largest correlations (above 0.8 in absolute values) were obtained between backfat weight and depths, (back+ leaf) fat % and estimated carcass lean content. It can be seen in Tables III and IV that all these traits were generally affected by the same QTL (except for chromosome 1 QTL
which does not seem to affect backfat depths). Correlations between external (backfat) and internal fat (leaf fat) are slightly lower (0.6 to 0.7) and some of the QTL affecting backfat thickness (on SSC 2 and SSC 4 and SSC 11) did not seem to influence leaf fat weight. This tends to indicate that the genetic control of metabolic pathways associated with external and internal fat deposition may partly differ. Similarly, correlations between carcass lean cuts are only low to moderate (−0.07 to 0.42 between loin, ham and shoulder weights) and only two of the leanness QTL identified (i.e. SSC 7 and X QTL) seemed to affect all carcass lean cuts. SSC 2 and SSC 14 QTL only influenced loin weight, whereas SSC 5, SSC 8 and SSC 12 QTL only affected ham weight.
With the exception of chromosome 7, the chromosomal regions influencing head and feet weights, which have low to moderate correlations with lean cuts, but stronger ones with fat cuts, differed from those affecting carcass lean and fat content. The negative correlations between carcass fatness and head or feet weight may have partly been due to the joint effects of the SLA region on SSC 7 on both traits, with strongly negative effects of Meishan alleles on fatness traits and positive ones on head and feet weights. Finally, in spite of close to zero correlations with the other traits, the largest QTL influencing dressing percentage has the same most likely position on chromosome X as the QTL influencing both carcass lean and fat cuts.
The second objective of this study was to compare the different genetic models in order to better understand the characteristics of the detected QTL and their mode of action. As discussed by Bidanel et al. [7], the use of line-cross (LC) and half-/full sib (HFS) allows different assumptions about QTL geno-types in founder populations to be compared. The simplest LC model assumes fixed biallelic QTL in parental populations, whereas the HFS model estimates within-family QTL effects and consequently allows for multiple alleles and QTL allele segregation in parental populations. Additional investigations on allele fixation in parental populations were performed by testing sire× QTL and dam× QTL interactions. The absence of significant family × QTL interaction and the similarity of LC and HFS estimates of additive genetic effects do not provide any evidence that QTL alleles are segregating in parental populations. Two-QTL analyses suggested the existence of linked QTL for a single chro-mosomal region on SSC 7 and a single trait, i.e., shoulder weight. Although the artifactual nature of this result cannot be excluded, it should be noted that positions and estimated QTL effects from one and two-QTL models were rather consistent. Suggestive evidence of linked growth QTL had already been obtained on SSC 7 for growth traits [37] and cortisol levels [16], but with slightly different QTL positions. A “double peak” in the F-ratio profile was also reported by Rohrer [39], with a different most likely position of the second QTL. Other reports of linked QTL in pigs remain rather limited. Knott
abdominal fat and small intestine length on SSC 5 in Wild Boar× Large White crosses. De Koning et al. [14] reported two imprinted linked QTL with different parental expression affecting intramuscular fat content on SSC6. Other linked QTL were also suggested in the French QTL experiment on SSC 1 and SSC 3 for growth traits [37].
Four chromosomal regions located on SSC 6, SSC 7, SSC 9 and SSC 17 showed suggestive evidence for parent-of-origin specific expression. Imprint-ing effects were also reported by de KonImprint-ing et al. [14] for two linked QTL affecting intramuscular fat content on SSC 6, but in different chromosomal regions than in our study, and on SSC 7 for a QTL affecting muscle depth, in the same centromeric region as in the present case. Conversely, there does not seem to be any previous report of imprinting effects on SSC 9 and SSC 17. Yet, these results are only suggestive and thus represent a rather weak indication of imprinting effects. Moreover, currently available comparative mapping results do not give any indication that orthologous regions in humans or mice contain imprinted genes.
5. CONCLUSION
The primary aim of this study was to perform a whole genome scan of a Large White× Meishan F2 population for carcass composition traits. It has allowed the effects of SSC 1, SSC 2, SSC 4, SSC 7 and SSC X chromosomal regions on the different parts of the carcass to be confirmed and indicated precisely. Assuming that they act additively, the detected QTL explain, respectively 38, 61, 71 and 69% of the phenotypic variance of ham, loin, backfat and leaf fat weight, i.e. the major part of the genetic variance of these highly heritable traits. Large White alleles have been shown to have favourable effects on carcass composition in all identified chromosome regions except in the SLA region of chromosome 7. Meishan haplotypes in the SLA region were associated with a lower carcass fatness and higher ham and shoulder weight, but had unfavourable effects on loin weight and depth. This study also allowed new QTL on lean and skeletal development to be detected. This study also raised several questions such as, unlike Dutch studies [14, 15], the lack of a significant imprinting effect over the whole genome, particularly in the IGF2 locus area on chromosome 2 where a significant imprinting effect has been evidenced in other populations [14, 23, 32] or the apparent “pleiotropic” effects of the SLA region.
These findings may have practical applications in the breeding industry,
e.g. marker assisted selection in synthetic populations involving synthetic lines
or the introgression of favourable carcass composition alleles in the Meishan breed. Yet, the effects of these chromosomal regions on other economically important traits such as reproduction, meat quality or disease resistance have
to be investigated before implementing them. Further investigations in order to refine the QTL position and more precisely dissect chromosomal regions of interest are also likely to improve the efficiency of these new selection tools. This can be done by reanalysing present data using more powerful tools such as multivariate analyses (e.g. [9, 19, 24]) and generating and accumulating new recombination events in advanced generations of intercross or backcross pop-ulations [11, 12]. Finally, their genetic and economic impact on the efficiency of genetic improvement schemes has to be clearly assessed in order to optimise their use.
ACKNOWLEDGEMENTS
This experimental program was funded by the European Union (Bridge and Biotech+ programs), Inra (Department of Animal Genetics and AIP “structure des génomes animaux”) and the “Groupement de recherches et d’études sur les génomes” of the Ministry of Research. The technical assistance of the staff of the Inra slaughterhouse of Saint-Gilles is gratefully acknowledged.
REFERENCES
[1] Andersson L., Haley C.S., Ellegren H., Knott S.A., Johansson M., Andersson K., Andersson-Eklund L., Edfors-Lilja I., Fredholm M., Hansson I., Hakansson J., Lundström K., Genetic mapping of quantitative trait loci for growth and fatness in pigs, Science 263 (1994) 1771–1774.
[2] Andersson-Eklund L., Marklund L., Lundstrom K., Haley C.S., Andersson K., Hansson I., Moller M., Andersson L., Mapping quantitative trait loci for carcass and meat quality traits in a wild boar× Large White intercross, J. Anim. Sci. 76 (1998) 694–700.
[3] Andersson-Eklund L., Uhlhorn H., Lundeheim N., Dalin G., Andersson L., Mapping quantitative trait loci for principal components of bone measurements and osteochondrosis scores in a wild boar× Large White intercross, Genet. Res. Camb. 75 (2000) 223–230.
[4] Bidanel J.-P., Caritez J.C., Legault C., Ten years of experiments with Chinese pigs in France. 1. Breed evaluation, Pig News & Information 11 (1990) 345–348. [5] Bidanel J.-P., Bonneau M., Pointillart A., Gruand J., Mourot J., Demade I., Effects of exogenous porcine somatotropin (pST) administration on growth performance, carcass traits, and pork meat quality of Meishan, Piétrain and crossbred gilts, J. Anim. Sci. 69 (1991) 3511–3522.
[6] Bidanel J.-P., Caritez J.C., Gruand J., Legault C., Growth, carcass and meat quality performance of crossbred pigs with graded proportions of Meishan genes, Genet. Sel. Evol. 25 (1993) 83–99.
[7] Bidanel J.-P., Milan D., Iannuccelli N., Amigues Y., Boscher M.Y., Bourgeois F., Caritez J.C., Gruand J., Le Roy P., Lagant H., Quintanilla R., Renard C., Gellin J., Ollivier L., Chevalet C., Detection of quantitative trait loci for growth and fatness in pigs, Genet. Sel. Evol. 33 (2001) 289–309.
[8] Chardon P., Renard C., Rogel-Gaillard C., Vaiman M., The pig major histocom-patibility complex and related paralogous regions: a review, Genet. Sel. Evol. 32 (2000) 109–128.
[9] Calinsky T., Kaszmarek Z., Krajewsky P., Frova C., Sari-Gorla M., A multivariate approach to the problem of QTL localization, Heredity 4 (2000) 303–310. [10] Churchill G.A., Doerge R.W., Empirical threshold values for quantitative trait
mapping, Genetics 138 (1994) 963–971.
[11] Darvasi A., Experimental strategies for the genetic dissection of complex traits in animal models, Nat. Genet. 18 (1998) 19–24.
[12] Darvasi A., Soller M., Advanced intercross lines, an experimental population for fine genetic mapping, Genetics, 141 (1995) 1199–1207.
[13] De Koning D.J., Janss L.L.G., Rattink A.P., van Oers P.A.M., de Vries B.J., Groenen M.A.M., van der Poel J.J., de Groot P.N., Brascamp E.W., van Arendonk J.A.M., Detection of quantitative trait loci for backfat thickness and intramuscular fat content in pigs (Sus scrofa), Genetics 152 (1999) 1679–1690.
[14] De Koning D.J., Rattink A.P., Harlizius B., van Arendonk J.A.M., Brascamp E.W., Groenen M.A.M., Genome-wide scan for body composition in pigs reveals important role of imprinting, Proc. Natl. Acad. Sci. USA 97 (2000) 7947–7950. [15] De Koning D.J., Rattink A.P., Harlizius B., Groenen M.A.M., Brascamp E.W., van Arendonk J.A.M., Detection and characterization of quantitative trait loci for growth and reproduction in pigs, Livest. Prod. Sci. 72 (2001) 185–198. [16] Désautés C., Bidanel J.-P., Milan D., Iannuccelli N., Amigues Y., Bourgeois
F., Caritez J.C., Renard C., Chevalet C., Mormède P., Genetic mapping of quantitative trait loci for behavioural and neuroendocrine traits in pigs, J. Anim. Sci. 80 (2002) 2276–2285.
[17] Gerbens F., Jansen A., van Erp A.J.M., Harders F., Meuwissen T.H.E., Rettenber-ger G., Veerkamp J.H., te Pas M.F.W., The adipocyte fatty acid-binding protein locus: characterization and association with intramuscular fat content in pigs, Mamm. Genome 9 (1998) 1022–1026.
[18] Gerbens F., de Koning D.J., Harders F., Meuwissen T.H.E., Janss L.L.G., Groenen M.A.M., Veerkamp J.H., van Arendonk J.A.M., te Pas M.F.W., The effect of adipocyte and heart fatty acid-binding protein genes on intramuscular fat and backfat content in Meishan crossbred pigs, J. Anim. Sci. 78 (2000) 552–559. [19] Gilbert H., Le Roy P., Comparison of three multitrait detection methods, in:
Book of abstracts of the 52nd Annual meeting of the European Association for Animal Production, Wageningen Pers, Wageningen, 7 (2001) 56.
[20] Green P., Falls K., Crooks S., Documentation for CRIMAP version 2.4, Wash-ington University School of Medicine, St. Louis, 1990.
[21] Haley C.S., Knott S.A., Elsen J.M., Mapping quantitative trait loci in crosses between outbred lines using least squares, Genetics 136 (1994) 1195–1207. [22] Harlizius B., Rattink A.K., de Koning D.J., Faivre M., Joosten R.G., van
Aren-donk J.A.M., Groenen M.A.M., The X chromosome harbors quantitative trait loci for backfat thickness and intramuscular fatcontent in pigs, Mamm. Genome 11 (2000) 800–802.
[23] Jeon J.T., Carlborg O., Törnsten A., Giuffra E., Amarger V., Chardon P., Andersson-Eklund L., Andersson K., Hansson I., Lundström K., Andersson L.,
A paternally expressed QTL affecting skeletal and cardiac muscle mass in pigs maps to the IGF2 locus, Nat. Genet. 21 (1999) 157–158.
[24] Jiang C., Zeng Z.B., Multiple trait analysis of genetic mapping for quantitative trait loci, Genetics 140 (1995) 1111–1127.
[25] Knott S.A., Marklund L., Haley C.S., Andersson K., Davies W., Ellegren H., Fredholm M., Hansson I., Hoyhem B., Lundström K., Moller M., Andersson L., Multiple marker mapping of quantitative trait loci in a cross between outbred Wild Boar and Large White pigs, Genetics 149 (1998) 1069–1080.
[26] Lander E.S., Kruglyak L., Genetic dissection of complex traits: guidelines for interpreting and reporting linkage results, Nat. Genet. 11 (1995) 241–247. [27] Le Roy P., Elsen J.M., Boichard D., Mangin B., Bidanel J.-P., Goffinet B., An
algorithm for QTL detection in mixture of full and half sib families, in: Proceed-ings of the 6th World Congress on Genetics Applied to Livestock Production, Armidale, 1998, vol. 26, pp. 257–260.
[28] Malek M., Dekkers J.C.M., Lee H.K., Baas T.J., Rothschild M.F., A molecular genome scan analysis to identify chromosomal regions influencing economic traits in the pig. I. Growth and body composition, Mamm. Genome 12 (2001) 630–636.
[29] Marklund L., Nyström P.E., Stern S., Andersson-Eklund L., Andersson L., Confirmed quantitative trait loci for fatness and growth on pig chromosome 4, Heredity 82 (1999) 134–141.
[30] Melani C., Pommeret P., Classement des carcasses de porcs en vertu du règlement CEE no 3220/84. Bilan de l’expérimentation de dissection totale et protocole d’agrément des sondes, document interne OFIVAL – ITP, 1988, 49 p.
[31] Neumaier A., Groeneveld E., Restricted maximum likelihood estimation of covariances in sparse linear models, Genet. Sel. Evol. 30 (1998) 3–26.
[32] Nezer C., Moreau L., Brouwers B., Coppieters W., Detilleux J., Hanset R., Karim L., Kvasz A., Leroy P., Georges M., An imprinted QTL with major effect on muscle mass and fat deposition maps to the IGF2 locus in pigs, Nat. Genet. 21 (1999) 155–156.
[33] Ovilo C., Pérez-Enciso M., Barragan C., Clop A., Rodriguez C., Oliver M.A., Toro M.A., Noguera J.L., A QTL for intramuscular fat and backfat thickness is located on porcine chromosome 6, Mamm. Genome 11 (2000) 344–346. [34] Paszek A.A., Wilkie P.J., Flickinger G.H., Rohrer G.A., Alexander L.J., Beattie
C.W., Shook L.B., Interval mapping of growth in divergent swine cross, Mamm. Genome 10 (1999) 117–122.
[35] Patterson H.D., Thompson R., Recovery of inter-block information when block sizes are unequal, Biometrika 58 (1971) 545–554.
[36] Pérez-Enciso M., Clop A., Noguera J.L., Ovilo C., Coll C., Folch J.M., Babot D., Estany J., Oliver M.A., Diaz I., Sanchez A., A QTL on pig chromosome 4 affects fatty acid metabolism: evidence from an Iberian by Landrace intercross, J. Anim. Sci. 78 (2000) 2525–2531.
[37] Quintanilla R., Milan D., Bidanel J.-P., A further look at quantitative trait loci affecting growth and fatness in a cross between Meishan and Large White pig populations, Genet. Sel. Evol. 34 (2002) 193–210.
[38] Rattink A.P., de Koning D.J., Faivre M., Harlizius B., van Arendonk J.A.M., Groenen M.A.M., Fine mapping and imprinting analysis for fatness trait QTL in pigs, Mamm. Genome 11 (2000) 656–661.
[39] Rohrer G.A., Identification of quantitative trait loci affecting birth characters and accumulation of backfat and weight in a Meishan – White composite resource population, J. Anim. Sci. 78 (2000) 2547–2553.
[40] Rohrer G.A., Keele J.W., Identification of quantitative trait loci affecting carcass composition in swine: I. Fat deposition traits, J. Anim. Sci. 76 (1998) 2247–2254. [41] Rohrer G.A., Keele J.W., Identification of quantitative trait loci affecting carcass composition in swine: II. Muscling and wholesale product yield traits, J. Anim. Sci. 76 (1998) 2255–2262.
[42] Rothschild M.F., Liu H.C., Tuggle C.K., Yu T.P., Wang L., Analysis of pig chromosome 7 genetic markers for growth and carcass performance traits, J. Anim. Breed. Genet. 112 (1995) 341–348.
[43] Smith T.P.L., Showalter A.D., Sloop K.W., Rohrer G.A., Fahrenkrug S.C., Meier B.C., Rhodes S.J., Identification of porcine Lhx3 and SF1 as candidate genes for QTL affecting growth and reproduction traits in swine, Anim. Genet. 32 (2001) 344–350.
[44] Wada Y., Akita T., Awata T., Furukawa T., Sugai N., Inage Y., Ishii K., Ito Y., Kobayashi E., Kusumoto H., Matsumoto T., Mikawa S., Miyake S., Murase A., Shimanuki S., Sugiyama T., Uchida Y., Yanai S., Yasue H., Quantitative trait loci analysis in a Meishan× Göttingen cross population, Anim. Genet. 31 (2000) 376–384.
[45] Walling G.A., Archibald A.L., Cattermole J.A., Downing A.C., Finlayson H.A., Nicholson D., Visscher P.M., Walker C.A., Haley C.S., Mapping of quantitative trait loci on porcine chromosome 4, Anim. Genet. 29 (1998) 415–424.
[46] Walling G.A., Visscher P.M., Andersson L., Rothschild M.F., Wang L., Moser G., Groenen M.A.M., Bidanel J.-P., Cepica S., Archibald A., Geldermann H., de Koning D.J., Milan D., Haley C.S., Combined analyses of data from QTL mapping studies: chromosome 4 effects on porcine growth and fatness, Genetics 155 (2000) 1369–1378.
[47] Wang L., Yu T.P., Tuggle C.K., Liu H.G., Rothschild M.F., A directed search for quantitative trait loci on chromosomes 4 and 7 in the pig, J. Anim. Sci. 76 (1998) 2560–2567.
To access this journal online: www.edpsciences.org