HAL Id: hal-01546021
https://hal.sorbonne-universite.fr/hal-01546021
Submitted on 23 Jun 2017
HAL is a multi-disciplinary open access
archive for the deposit and dissemination of
sci-entific research documents, whether they are
pub-lished or not. The documents may come from
teaching and research institutions in France or
abroad, or from public or private research centers.
L’archive ouverte pluridisciplinaire HAL, est
destinée au dépôt et à la diffusion de documents
scientifiques de niveau recherche, publiés ou non,
émanant des établissements d’enseignement et de
recherche français ou étrangers, des laboratoires
publics ou privés.
Distributed under a Creative Commons Attribution| 4.0 International License
domesticated and wild yeasts
Jia-Xing Yue, Jing Li, Louise Aigrain, Johan Hallin, Karl Persson, Karen
Oliver, Anders Bergström, Paul Coupland, Jonas Warringer, Marco Cosentino
Lagomarsino, et al.
To cite this version:
Jia-Xing Yue, Jing Li, Louise Aigrain, Johan Hallin, Karl Persson, et al.. Contrasting evolutionary
genome dynamics between domesticated and wild yeasts. Nature Genetics, Nature Publishing Group,
2017, 49 (6), pp.913-924. �10.1038/ng.3847�. �hal-01546021�
Understanding how genetic variation translates into phenotypic diversity is a central theme in biology. With the rapid advancement of sequencing technology, genetic variation in large natural populations has been explored extensively for humans and several model organ-isms1–9. However, current knowledge of natural genetic variation is
heavily biased toward single nucleotide variants (SNVs). Large-scale structural variants (SVs) such as inversions, reciprocal translocations, transpositions, novel insertions, deletions and duplications are not as well characterized owing to technical difficulties in detecting them with short-read sequencing data. This is a critical problem to address given that SVs often account for a substantial fraction of genetic vari-ation and can have significant implicvari-ations in adaptvari-ation, specivari-ation and disease susceptibility10–12.
The long-read sequencing technologies from Pacific Biosciences (PacBio) and Oxford Nanopore offer powerful tools for high-quality genome assembly13. Their recent applications provided highly
con-tinuous genome assemblies with many complex regions correctly resolved, even for large mammalian genomes14,15. This is especially
important in characterizing SVs, which are frequently embedded in complex regions. For example, eukaryotic subtelomeres, which con-tribute to genetic and phenotypic diversity, are known hot spots of SVs due to rampant ectopic sequence reshuffling16–19.
Baker’s yeast, S. cerevisiae, is a leading biological model system with great economic importance in agriculture and industry. Discoveries in S. cerevisiae have helped shed light on almost every aspect of molecular
biology and genetics. It was the first eukaryote to have its genome sequence, population genomics and genotype–phenotype map exten-sively explored1,20,21. Here we applied PacBio sequencing to 12
repre-sentative strains of S. cerevisiae or its wild relative S. paradoxus and identified notable interspecific contrasts in structural dynamics across their genomic landscapes. This study brings long-read sequencing technologies to the field of population genomics, studying genome evolution using multiple reference-quality genome sequences.
RESULTS
End-to-end population-level genome assemblies
We applied deep PacBio (100×–300×) and Illumina (200×–500×) sequencing to seven S. cerevisiae and five S. paradoxus strains rep-resenting evolutionarily distinct subpopulations of both species1,6
(Supplementary Tables 1 and 2). The raw PacBio de novo assem-blies of both nuclear and mitochondrial genomes showed compel-ling completeness and accuracy, with most chromosomes assembled into single contigs, and highly complex regions accurately assembled (Supplementary Fig. 1). After manual gap filling and Illumina-read-based error correction (Online Methods), we obtained end-to-end assemblies for almost all the 192 chromosomes, with only the rDNA array on chromosome XII and 26 of 384 (6.8%) chromosome ends remaining not fully assembled. We estimate that only 45–202 base-level sequencing errors remain across each 12-Mb nuclear genome (Supplementary Tables 3 and 4). For each assembly, we annotated
Contrasting evolutionary genome dynamics between
domesticated and wild yeasts
Jia-Xing Yue
1, Jing Li
1, Louise Aigrain
2, Johan Hallin
1, Karl Persson
3, Karen Oliver
2, Anders Bergström
2, Paul Coupland
2,5,
Jonas Warringer
3, Marco Cosentino Lagomarsino
4, Gilles Fischer
4, Richard Durbin
2& Gianni Liti
1Structural rearrangements have long been recognized as an important source of genetic variation, with implications in phenotypic diversity and disease, yet their detailed evolutionary dynamics remain elusive. Here we use long-read sequencing to generate end-to-end genome assemblies for 12 strains representing major subpopulations of the partially domesticated yeast Saccharomyces cerevisiae and its wild relative Saccharomyces paradoxus. These population-level high-quality genomes with comprehensive annotation enable precise definition of chromosomal boundaries between cores and subtelomeres and a high-resolution view of evolutionary genome dynamics. In chromosomal cores, S. paradoxus shows faster accumulation of balanced rearrangements (inversions, reciprocal translocations and transpositions), whereas S. cerevisiae accumulates unbalanced rearrangements (novel insertions, deletions and duplications) more rapidly. In subtelomeres, both species show extensive interchromosomal reshuffling, with a higher tempo in S. cerevisiae. Such striking contrasts between wild and domesticated yeasts are likely to reflect the influence of human activities on structural genome evolution.
1Université Côte d’Azur, CNRS, INSERM, IRCAN, Nice, France. 2Wellcome Trust Sanger Institute, Hinxton, Cambridge, UK. 3Department of Chemistry and Molecular
Biology, Gothenburg University, Gothenburg, Sweden. 4Laboratory of Computational and Quantitative Biology, Institut de Biologie Paris-Seine, UPMC University Paris
06, Sorbonne Universités, CNRS, Paris, France. 5Present address: Cancer Research UK Cambridge Institute, Li Ka Shing Centre, University of Cambridge, Cambridge,
UK. Correspondence should be addressed to G.L. ([email protected]).
Received 20 October 2016; accepted 22 March 2017; published online 17 April 2017; doi:10.1038/ng.3847
OPEN
© 20 17 Nat ur e Amer ica, Inc., par t of Spr ing er Nat ur e. All r ights r eser ved.centromeres, protein-coding genes, tRNAs, Ty retrotransposable ele-ments, core X eleele-ments, Y′ elements and mitochondrial RNA genes (Supplementary Tables 5–7). Chromosomes were named according to their encompassed centromeres.
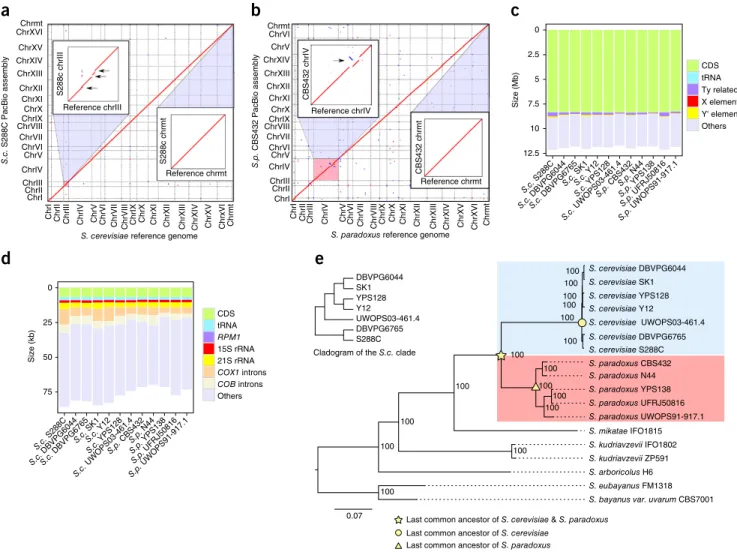
When evaluated against the current S. cerevisiae and S. paradoxus reference genomes, our PacBio assemblies of the same strains (S288C and CBS432, respectively) show clean collinearity for both nuclear and mitochondrial genomes (Fig. 1a,b) with only a few discrepancies at finer scales, which were caused by assembly problems in the reference genomes. For example, we found five nonreference Ty1 insertions on chromosome III in our S288C assembly (Fig. 1a, inset), which were corroborated by previous studies22–24 as well as our own long-range
PCR amplifications. Likewise, we found a misassembly on chromo-some IV (Fig. 1b, inset) in the S. paradoxus reference genome, which was confirmed by Illumina and Sanger reads1. Moreover, we checked
several known cases of copy number variants (CNVs) (for example, Y′ elements25, the CUP1 locus6 and ARR6 gene clusters) and SVs (for
example, those in the Malaysian S. cerevisiae UWOPS03-461.4)26 and
they were all correctly recaptured in our assemblies.
The final assembly sizes of these 12 strains ranged from 11.73 to 12.14 Mb for the nuclear genome (excluding rDNA gaps) and from 69.95 to 85.79 kb for the mitochondrial genome (Fig. 1c,d and Supplementary Tables 8 and 9). The abundance of Ty and Y′ elements substantially contributed to the nuclear genome size dif-ferences (Fig. 1c and Supplementary Table 8). For example, we observed strain-specific enrichment of full-length Ty1 in S. cer-evisiae S288C, Ty4 in S. paradoxus UFRJ50816 and Ty5 in S. para-doxus CBS432, whereas no full-length Ty was found in S. cerevisiae UWOPS03-461.4 (Supplementary Table 6). Similarly, >30 cop-ies of the Y′ element were found in S. cerevisiae SK1 but none in S. paradoxus N44 (Supplementary Table 5). Mitochondrial genome size variation is heavily shaped by the presence or absence of group I and group II introns in COB1, COX1 and 21S rRNA (rnl) (Fig. 1d and
Supplementary Tables 9 and 10). Despite large-scale interchromosomal Chrmt ChrI ChrII ChrIII ChrIV ChrV ChrVI ChrVII ChrVIIIChrIX ChrX ChrXI ChrXII ChrXIII ChrXIV ChrV ChrVI S.p. CBS432 PacBio assembly Chrmt
ChrI ChrII ChrIII ChrIV ChrV ChrVI ChrVII ChrVIII ChrIX ChrX ChrXI ChrXII ChrXIII ChrXIV ChrXV ChrXVI
2.5 5 7.5 Size (Mb) CDS tRNA Ty related X element Y' element Others 12.5 10 0 Chrmt ChrI ChrII ChrIII ChrIV ChrV ChrVI ChrVII ChrVIIIChrIX ChrX ChrXI ChrXII ChrXIII ChrXIV ChrXV ChrXVI Chrmt
ChrI ChrII ChrIII ChrIV ChrV ChrVI ChrVII ChrVIII ChrIX ChrX ChrXI ChrXII ChrXIII ChrXIV ChrXV ChrxVI Reference chrmt S288c chrmt Reference chrIII S288c chrIII S. cerevisiae DBVPG6765 S. paradoxus UWOPS91-917.1 S. cerevisiae DBVPG6044 S. paradoxus CBS432 S. arboricolus H6 S. paradoxus UFRJ50816 S. cerevisiae SK1 S. eubayanus FM1318 S. bayanus var. uvarum CBS7001 S. paradoxus YPS138 S. cerevisiae Y12 S. mikatae IFO1815 S. cerevisiae S288C S. cerevisiae UWOPS03-461.4 S. kudriavzevii IFO1802 S. paradoxus N44 S. cerevisiae YPS128 S. kudriavzevii ZP591 DBVPG6765 DBVPG6044 SK1 Y12 S288C UWOPS03-461.4 YPS128
Cladogram of the S.c. clade
0.07 100 100 100 100 100 100 100 100 100 100 100 100 100 100 100 100
Last common ancestor of S. cerevisiae & S. paradoxus Last common ancestor of S. cerevisiae
Last common ancestor of S. paradoxus 75 50 25 0 Size (kb) CDS tRNA RPM1 15S rRNA 21S rRNA COX1 introns COB introns Others S.c. S288C PacBio assembly
S. cerevisiae reference genome S. paradoxus reference genome
S.c. S288C S.p. UWOPS91-917. 1 S.p. UFRJ50816 S.p. YPS138 S.p. N44 S.p. CBS432 S.c. UWOPS03-461. 4 S.c. YPS128 S.c. Y12 S.c. SK1 S.c. DBVPG6765 S.c. DBVPG6044 S.c. S288C S.c. DBVPG6044 S.p. UWOPS91-917.1 S.p. UFRJ50816 S.p. YPS138 S.p. N44 S.p. CBS432 S.c. UWOPS03-461.4 S.c. YPS128 S.c. Y12 S.c. SK1 S.c. DBVPG6765
a
b
c
d
e
Reference chrmtCBS432 chrmt Reference chrIV CBS432 chrIVFigure 1 End-to-end genome assemblies and phylogenetic framework. (a) Comparison of the S. cerevisiae reference genome (strain S288C) and our
S288C PacBio assembly. Sequence homology signals are indicated in red (forward match) or blue (reverse match). Insets, zoomed-in comparisons for chromosome III (chrIII) and the mitochondrial genome (chrmt). Black arrows indicate Ty-containing regions missing in the S. cerevisiae reference genome. (b) Comparison of the S. paradoxus reference genome (strain CBS432) and our CBS432 PacBio assembly, color coded as in a. Insets,
zoomed-in comparison for chromosome IV (chrIV) and chrmt. Black arrow zoomed-indicates the misassembly on chromosome IV zoomed-in the S. paradoxus reference genome. (c,d) Cumulative lengths of annotated genomic features relative to the overall assembly size of the nuclear (c) and mitochondrial genome (d). CDS,
coding sequence. (e) Phylogenetic relationships of the seven S. cerevisiae strains (blue) and five S. paradoxus strains (red) sequenced in this study. Six
strains from other closely related Saccharomyces species were used as outgroups. All internal nodes have 100% fast-bootstrap supports. Inset, detailed relationships of the S. cerevisiae strains.
© 20 17 Nat ur e Amer ica, Inc., par t of Spr ing er Nat ur e. All r ights r eser ved.
rearrangements in a few strains (S. cerevisiae UWOPS03-461.4, S. paradoxus UFRJ50816 and S. paradoxus UWOPS91-917.1), all 12 strains maintained 16 nuclear chromosomes.
Molecular evolutionary rate and diversification timescale
To gauge structural dynamics in a well-defined evolutionary con-text, we performed phylogenetic analysis for the 12 strains and 6
FLO9/FLO1
-like
Ty1/Ty2-LTR
FLO1 SEO1 Ty5-LTRX element Y' elementTG repeat TG repeat
TG repeat X element Ty5-LTR COS2 FLO1 SEO1 Subtelomere Chromosome end SEO1
FLO9 YAL063C-ATy1/Ty2-LTRYAL064-W TDA8YAL064W-BYAL065C YAL067W-APAU8X elementTG repeat
S.c. S288C S.p. YPS138 S.p. UFRJ50816 FLO9 SEO1 S.c. DBVPG6044 YAL065C
YAL064W-B SEO1 PAU8/PAU1X elementTG repeat
S.c. DBVPG6765
YHR214W/YAR066W
Ty1/Ty2-LTR YHR213W-A
FLO9 YAL063C-A YAR060CYHR212-A IMD2X elementY' elementTG repeat
S.c. SK1
FLO9 SEO1 X elementTG repeat
S.c. Y12
TG repeat
X element Y' element TG repeat
SEO1 PAU8/PAU1 S.c. YPS128 PHO12 BIO1 BIO6 FLO1 S.c. UWOPS03-461.4
FLO9 Ty1/Ty2-LTR Ty1/Ty2-LTRSEO1 PAU8/PAU1Ty5-LTRIMD2X elementTG repeat
S.p. CBS432
COS1/COS4X elementTG repeat
SEO1 PAU20YIR042C FLO1
S.p. N44
X element Ty1/Ty2-LTRTy5-LTR
SEO1 PAU20 YBR013C
-like YIR042C -like S.p. UWOPS91-917.1 5 kb FLO9/FLO1 -like FLO9/FLO1 -like CNE1ECM1BDH1BDH2GDH3 CNE1ECM1BDH1BDH2GDH3 CNE1ECM1BDH1BDH2GDH3 CNE1ECM1BDH1BDH2GDH3 CNE1ECM1BDH1BDH2GDH3 CNE1ECM1BDH1BDH2GDH3 CNE1ECM1BDH1BDH2GDH3 CNE1ECM1BDH1BDH2GDH3 CNE1ECM1BDH1BDH2GDH3 CNE1ECM1BDH1BDH2GDH3 CNE1ECM1BDH1BDH2GDH3 CNE1ECM1BDH1BDH2GDH3 ChrI Core Subtelomere 0.01 0.10 1.00 CNV accumulation 1 100 0 50 100 150 0 0.10 0.20 0.30 GOL
Core Subtelomere Core Subtelomere Core Subtelomere
Time-adjusted GOL Core Time-adjusted CNV accumulation 0.40 0.50 Ty5-LTR PAU7PAU -like S.c. –S.c. S.c. –S.p. S.p. –.S.p. S.c. –S.c. S.c. –S.p. S.p. –S.p. S.c. –S.c. S.c. –S.p. S.p. –S.p. S.c. –S.c. S.c. –S.p. S.p. –S.p. S.c. –S.c. S.c. –S.p. S.p. –S.p. S.c. –S.c. S.c. –S.p. S.p. –S.p. S.c. –S.c. S.c. –S.p. S.p. –S.p. S.c. –S.c. S.c. –S.p. S.p. –S.p.
a
b
c
d
e
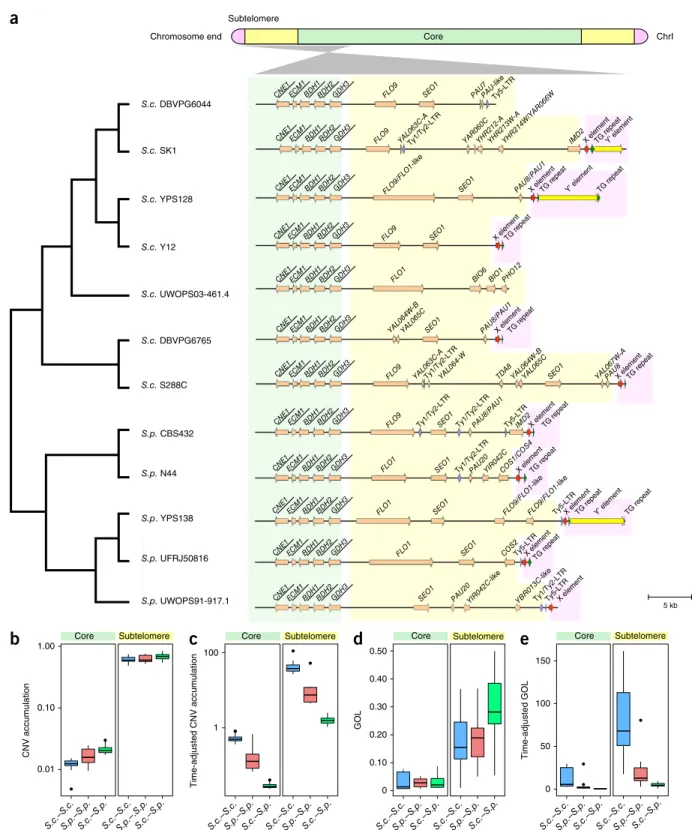
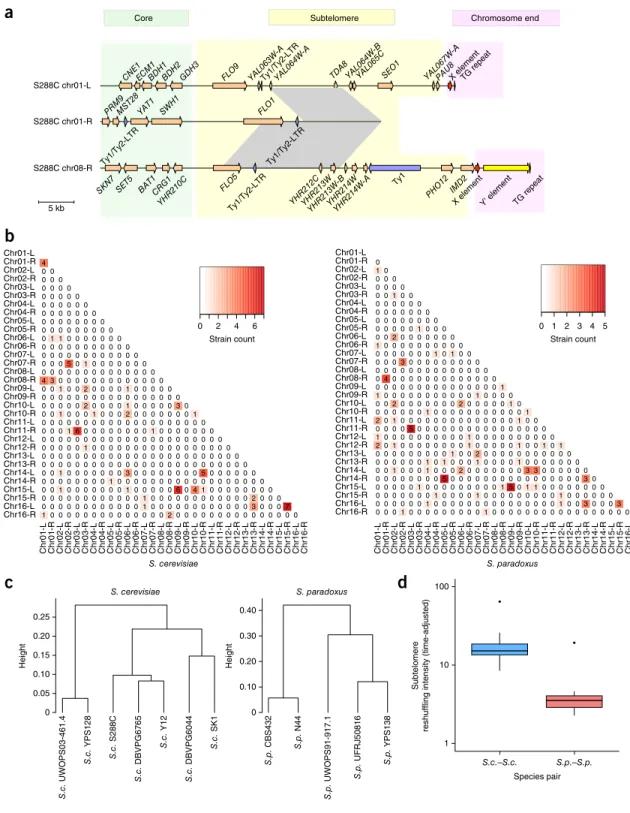
Figure 2 Explicit nuclear chromosome partitioning. (a) Partitioning of the left arm of chromosome I into the core (green), subtelomere (yellow)
and chromosome end (pink) based on synteny conservation and the yeast telomere-associated core X and Y′ elements. Cladogram (left) shows the phylogenetic relationships of the 12 strains; gene arrangement map (right) illustrates the syntenic conservation profile in both the core and subtelomeric regions. The names of genes within the syntenic block are underlined. (b,c) CNV accumulation (b) and CNV accumulation adjusted by
diversification time (c) of strain pairs within S. cerevisiae (S.c.–S.p.), within S. paradoxus (S.c.–S.p.) and between the two species (S.c.–S.p.) (log10 scale). (d,e) GOL (d) and GOL adjusted by diversification time (e) of strain pairs. Center lines, median; boxes, interquartile range (IQR); whiskers,
1.5× IQR. Data points beyond the whiskers are outliers.
© 20 17 Nat ur e Amer ica, Inc., par t of Spr ing er Nat ur e. All r ights r eser ved.
Saccharomyces sensu stricto outgroups based on 4,717 one-to-one orthologs of nuclear protein-coding genes (Supplementary Data Set 1). The resulting phylogeny is consistent with our prior knowledge about these strains (Fig. 1e). Analyzing this phylogenetic tree, we found the entire S. cerevisiae lineage to have evolved faster than the S. para-doxus lineage, as indicated by the overall longer branch from the com-mon ancestor of the two species to each tip of the tree (Fig. 1e). We confirmed such rate differences by Tajima’s relative rate test27 for all
S. cerevisiae–S. paradoxus strain pairs, using Saccharomyces mikatae as the outgroup (P < 1 × 10⁻⁵ for all pairwise comparisons). In
con-trast, molecular dating analysis shows that the cumulative diversifica-tion time for the five S. paradoxus strains was 3.87-fold that for the seven S. cerevisiae strains, suggesting a much longer time span for
accumulating species-specific genetic changes in the former (Supplementary Fig. 2a). This timescale difference was further supported by the synonymous substitution rate (dS) (Supplementary Fig. 2b).
Core–subtelomere chromosome partitioning
Conceptually, linear nuclear chromosomes can be partitioned into internal chromosomal cores, interstitial subtelomeres and terminal chromosome ends. However, their precise boundaries are challeng-ing to demarcate without a rigid subtelomere definition. Here we propose an explicit way to pinpoint yeast subtelomeres on the basis of multi-genome comparison, which can be further applied to other eukaryotic organisms. For each subtelomere, we located its proximal boundary on the basis of the sudden loss of synteny conservation and S.c. DBVPG6044 S.c. SK1 S.c. YPS128 S.c. Y12 S.c. UWOPS03-461.4 S.c. DBVPG6765 S.c. S288C S.p. UFRJ50816 S.p. YPS138 S.p. CBS432 S.p. UWOPS91-917.1 S.p. N44 4 IV 1 TL 10 IV 5 TL 3 IV 2 IV 3 IV 1 IV 1 IV 1 MR 2 IV 1 IV 35 balanced rearrangements: 28 IVs 6 TLs 1 MRs 1 2 3 4 5 6 7 8 9 10 11 12 13 14 15 16 1 2 3 4 5 6 7 8 9 10 11 12 13 14 15 16 S.c. S288C S.p. UFRJ50816 1 2 3 4 5 6 7 8 9 10 11 12 13 14 15 16 S.c. UWOPS03-461.4 1 2 3 4 5 6 7 8 9 10 11 12 13 14 15 16 S.p. UWOPS91-917.1 S.c. DBVPG6044 S.c. SK1 S.c. YPS128 S.c. Y12 S.c. UWOPS03-461.4 S.c. DBVPG6765 S.c. S288C S.p. UFRJ50816 S.p. YPS138 S.p. CBS432 S.p. UWOPS91-917.1 S.p. N44 1 IS 1 DL 1 IS 2 TD 1 DL 1 DD 1 TD 3 DL 1 IS 2 DL 3 DL 1 IS 5 DL 2 TD 1 DL 1 DD 1 DL 1 DD 52 unbalanced rearragements: 7 ISs 32 DLs 4 DDs 7 TDs 2 undefined 1 IS 6 DL 1 IS 2 DL 2 TD S.p. YPS138 chrVII S.p. UFRJ50816 chrVII S.p. YPS138 chrVII S.p. UFRJ50816 chrVII 674170 901683 659132 862941 1 IV 1 DL 2 DL 2 DL 1 IS 1 DL 1 DL 1 DD
a
b
c
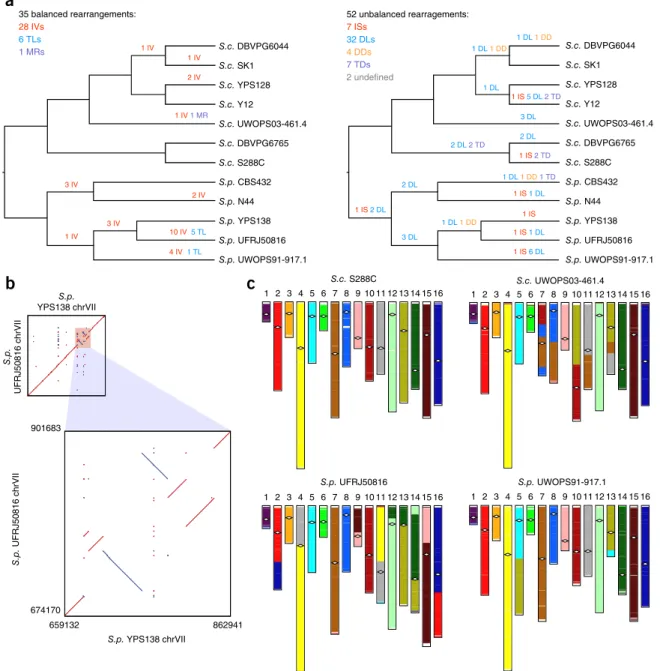
Figure 3 Structural rearrangements in the nuclear chromosomal cores. (a) Balanced (left) and unbalanced (right) structural rearrangements occurred
along the evolutionary history of the 12 strains. IV, inversion; TL, translocation; MR, massive rearrangement; IS, insertion; DL, deletion; DD, dispersed duplication; TD, tandem duplication. (b) The six clustered inversions on chromosome VII (chrVII) of the S. paradoxus strain UFRJ50816; highlighted
region (top) is shown in zoomed-in plot (bottom). (c) Genome organization of UWOPS03-461.4, UFRJ50816 and UWOPS91-917.1 relative to that of
S288C, which is free from large-scale interchromosomal rearrangements. White diamonds indicate positions of centromeres. Different colors are used to differentiate gene contents in different ancestral S. cerevisiae chromosomes.
© 20 17 Nat ur e Amer ica, Inc., par t of Spr ing er Nat ur e. All r ights r eser ved.
demarcated its distal boundary by the telomere-associated core X and Y′ elements (Online Methods and Supplementary Fig. 3). The partitioning for the left arm of chromosome I is illustrated in Figure 2a. The strict gene synteny conservation is lost after GDH3, thus marking the boundary between the core and the subtelomere for this chromosome arm (Fig. 2a). All chromosomal cores and subte-lomeres and 358 out of 384 chromosome ends across the 12 strains could be defined in this way (Supplementary Tables 11–13 and
Supplementary Data Sets 2 and 3). For the remaining 26
chro-mosome ends, X and Y′ elements and telomeric repeats (TG1–3)
were missing. We assigned the orthology of subtelomeres from dif-ferent strains on the basis of the ancestral chromosomal identity of their flanking chromosomal cores (Online Methods). Here we use Arabic numbers to denote such ancestral chromosomal identi-ties and the associated subtelomeres, taking into account the large-scale interchromosomal rearrangements that have occurred in some strains (Supplementary Fig. 4 and Supplementary Table 12). Such accurately assigned subtelomere orthology, together with explicit chromosome partitioning, allows an in-depth examination of sub-telomeric evolutionary dynamics.
Our analysis captures distinct properties of chromosomal cores and subtelomeres. All previously defined essential genes in S. cerevisiae S288C28 fell into the chromosomal cores, whereas
all previously described subtelomeric duplication blocks in S288C
(http://www2.le.ac.uk/colleges/medbiopsych/research/gact/images/ clusters-fixed-large.jpg) were fully enclosed in our defined S288C subtelomeres. Furthermore, the genes from our defined subtelom-eres showed 36.6-fold higher CNV accumulation than those from the cores (one-sided Mann–Whitney U test, P < 2.2 × 10⁻¹⁶) (Fig. 2b,c).
When considering only one-to-one orthologs, the subtelomeric genes showed 8.4-fold higher gene order loss (GOL)29–31 than their core
coun-terparts (one-sided Mann–Whitney U test, P < 2.2 × 10⁻¹⁶) (Fig. 2d,e).
Additionally, subtelomeric one-to-one orthologs also showed signifi-cantly higher nonsynonymous-to-synonymous substitution rate ratio (dN/dS) than those from the cores in the S. cerevisiae–S. cerevisiae and S. cerevisiae–S. paradoxus comparisons (one-sided Mann–Whitney U test, P < 2.2 × 10⁻¹⁶), although no clear trend was found in the
S. paradoxus–S. paradoxus comparison (one-sided Mann–Whitney U-test, P = 0.936). These observations fit well with known properties of cores and subtelomeres and provide the first quantitative assess-ment of the core–subtelomere contrasts in genome dynamics. Notably, aside from such core–subtelomere contrasts, we also observed clear interspecific differences in all three measurements. S. cerevisiae strains showed faster CNV accumulation (one-sided Mann–Whitney U-test; P = 6.7 × 10⁻⁵ for cores, P = 5.1 × 10⁻⁵ for subtelomeres) and more
rapid GOL (one-sided Mann–Whitney U-test, P = 5.5 × 10⁻⁵ for
cores and P = 2.6 × 10⁻⁵ for subtelomeres) than S. paradoxus strains
in both core and subtelomeres, respectively (Fig. 2c,e). Similarly,
S.c . S288 C ch r15-R S.c. DBVPG6765 chr15-R. 0 kb 0 kb 12.9 kb 76.2 kb 65 kb HGT from Torulaspora microellipsoides
10.8 kb 0 kb 0 kb S .p. N 44 c hr07-R S.p. CBS432 chr07-R 36.8 kb 71.9 kb S.p. UFRJ50816 chr15-L S.p. YPS138 chr15-L 0 kb 0 kb 64.1 kb 20.7 kb 14.5 kb 49.0 kb Corresponding to ancestral chr10-L Corresponding to ancestral chr03-R MAL31-like MAL33-like Corresponding to ancestral chr16-R Containin g the ARR c luste r 0 20 40 60 80 0 20 40 60 80 0 20 40 60 80 0 20 40 60 80 0 20 40 60 80 0 20 40 60 80 0 20 40 60 80 0 20 40 60 80 S288C DBVPG6044 DBVPG6765 SK1 Y12 YPS128 UWOPS03-461.4 CBS432 N44 YPS138 UFRJ50816 UWOPS91-917.1 S ubtelomere size (kb) Chr01-L Chr01-R Chr02-L Chr02-R Chr03-L Chr03-R Chr04-L Chr04-R Chr05-L Chr05-R Chr06-L Chr06-R Chr07-L Chr07-R Chr08-L Chr08-R Chr09-L Chr09-R Chr10-L Chr10-R Chr11-L Chr11-R Chr12-L Chr12-R Chr13-L Chr13-R Chr14-L Chr14-R Chr15-L Chr15-R Chr16-L Chr16-R 66.4 kb
a
b
c
d
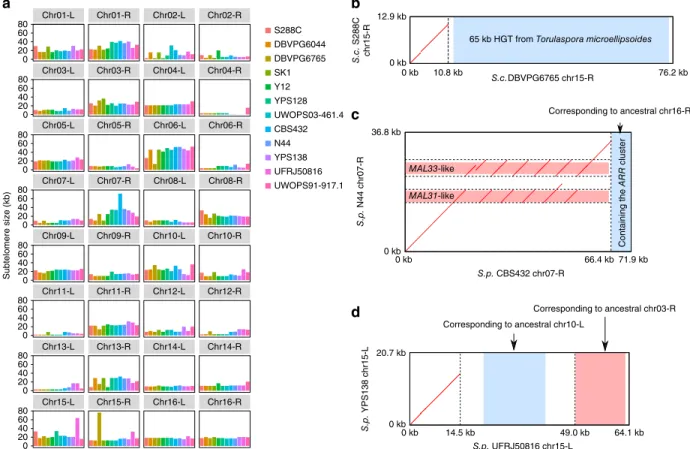
Figure 4 Subtelomere size plasticity and structural rearrangements. (a) Size variation of the 32 orthologous subtelomeres across the 12 strains.
(b) Chromosome 15-R (chr15-R) subtelomere comparison between S. cerevisiae DBVPG6765 and S288C. The extended DBVPG6765 chr15-R
subtelomere is explained by a eukaryote-to-eukaryote HGT event39. (c) Chromosome 07-R (chr07-R) subtelomere comparison between S. paradoxus CBS432 and N44. The chr07-R subtelomere expansion in CBS432 is explained by a series of tandem duplications of the MAL31-like and MAL33-like genes and an addition of the ARR-containing segment from the ancestral chromosome 16-R subtelomere. (d) Chromosome 15-L subtelomere comparison between S. paradoxus UFRJ50816 and YPS138. The expanded chromosome 15-L subtelomere in UFRJ50816 is explained by the relocated subtelomeric segments from the ancestral chromosome 10-L and chromosome 03-R subtelomeres. Region coordinates in b–d are based on the defined
subtelomeres rather than the full chromosomes.
© 20 17 Nat ur e Amer ica, Inc., par t of Spr ing er Nat ur e. All r ights r eser ved.
S. cerevisiae subtelomeric genes also showed higher dN/dS than their S. paradoxus counterparts (one-sided Mann–Whitney U-test, P = 4.3 × 10⁻⁴), although their core genes appear to have similar dN/dS
(one-sided Mann–Whitney U-test, P = 1.000). These observations collectively suggest accelerated evolution in S. cerevisiae relative to S. paradoxus, especially in subtelomeres.
FLO1 SWH1 YAT1 MST28 PRM9 S288C chr01-L S288C chr01-R S288C chr08-R
Core Subtelomere Chromosome end
5 kb S. cerevisiae Height S. paradoxus S.c. DBVPG6044 S.c. Y12 S.c. DBVPG6765 S.c. S288C S.c. YPS128 S.c. UWOPS03-461.4 S.c. SK1 Height Species pair Subtelomere
reshuffling intensity (time-adjusted)
1 10 100 S. cerevisiae S. paradoxus 0 2 4 6 Strain count Chr01-R Chr02-L Chr05-R Chr02-R Chr08-R Chr08-L Chr07-L Chr03-R Chr07-R Chr06-R Chr06-L Chr04-R Chr01-L Chr03-L Chr04-L Chr05-L Chr09-R Chr10-L Chr13-R Chr10-R Chr16-R Chr16-L Chr15-L Chr11-R Chr15-R Chr14-R Chr14-L Chr12-R Chr09-L Chr11-L Chr12-L Chr13-L Chr01-R Chr02-L Chr02-R Chr03-R Chr04-R Chr05-R Chr06-L Chr06-R Chr07-L Chr07-R Chr08-L Chr08-R Chr01-L Chr03-L Chr04-L Chr05-L Chr09-L Chr09-R Chr10-L Chr10-R Chr11-L Chr11-R Chr12-L Chr12-R Chr13-L Chr13-R Chr14-L Chr14-R Chr15-L Chr15-R Chr16-L Chr16-R 1 0 0 0 0 0 0 0 0 0 0 0 0 0 0 2 0 0 0 0 0 0 0 0 0 0 0 0 0 0 0 0 0 0 0 0 0 0 0 0 0 0 0 1 0 0 0 0 0 0 0 0 0 0 0 0 3 0 0 0 7 0 0 0 0 0 0 0 0 0 0 0 0 1 0 0 0 0 0 0 0 0 0 0 0 0 2 0 0 0 0 0 1 0 0 0 0 0 0 0 1 0 0 0 0 0 6 0 4 1 0 0 0 0 0 0 0 0 0 0 0 0 0 0 0 0 1 0 0 0 0 0 0 0 0 0 0 0 0 0 0 0 0 0 0 0 0 1 0 0 0 0 0 0 0 3 0 0 0 0 0 0 0 0 5 0 0 0 0 0 0 0 0 0 0 0 0 0 0 0 0 0 0 0 0 0 0 0 0 0 0 0 0 0 0 0 0 0 0 0 0 0 0 0 0 0 0 0 0 0 0 0 0 0 0 0 0 0 0 0 0 0 0 0 0 1 0 0 0 0 0 0 0 0 0 0 0 0 0 0 0 0 0 0 0 0 0 0 0 0 0 0 0 0 0 0 0 0 0 0 0 0 0 0 0 0 0 0 1 6 0 0 0 0 0 0 0 0 1 0 0 0 0 0 0 0 0 0 0 0 0 0 0 0 0 0 0 0 0 0 0 0 0 0 0 0 0 0 1 0 0 0 1 0 0 0 2 0 0 0 0 0 0 0 1 0 0 0 0 0 2 0 0 0 0 1 0 0 0 0 0 3 0 0 0 0 0 0 0 0 0 0 0 0 0 0 0 0 0 0 0 0 1 0 0 2 0 0 0 0 1 0 0 0 0 0 4 3 0 0 0 0 0 0 0 0 0 0 0 0 0 0 0 0 0 0 0 0 0 0 0 0 0 0 0 0 0 0 5 0 1 0 0 0 0 0 0 0 0 0 0 0 0 0 0 0 0 0 0 0 0 0 0 0 0 0 0 0 0 0 0 0 1 1 0 0 0 0 0 0 0 0 0 0 0 0 0 0 0 0 0 0 0 0 0 0 0 0 0 0 0 0 0 0 0 0 0 0 0 0 0 0 0 0 0 0 0 0 0 0 0 0 0 0 0 4 0 1 2 3 4 5 Strain count Chr01-R Chr02-L Chr02-R Chr03-R Chr04-R Chr05-R Chr06-L Chr06-R Chr07-L Chr07-R Chr08-L Chr08-R Chr01-L Chr03-L Chr04-L Chr05-L Chr09-L Chr09-R Chr10-L Chr10-R Chr11-L Chr11-R Chr12-L Chr12-R Chr13-L Chr13-R Chr14-L Chr14-R Chr15-L Chr15-R Chr16-L Chr16-R Chr01-R Chr02-L Chr05-R Chr02-R Chr08-R Chr08-L Chr07-L Chr03-R Chr07-R Chr06-R Chr06-L Chr04-R Chr01-L Chr03-L Chr04-L Chr05-L Chr09-R Chr10-L Chr13-R Chr10-R Chr16-R Chr16-L Chr15-L Chr11-R Chr15-R Chr14-R Chr14-L Chr12-R Chr09-L Chr11-L Chr12-L Chr13-L 0 0 0 1 0 0 0 0 0 0 0 0 0 1 0 0 0 0 0 0 0 0 0 0 0 0 0 0 0 0 0 0 0 0 0 0 0 1 0 0 0 0 0 0 0 0 0 0 0 0 0 0 0 1 0 0 3 0 0 0 3 0 0 0 0 0 0 0 1 0 0 0 0 1 0 0 0 0 0 0 0 0 0 1 0 0 0 0 0 0 0 0 0 0 0 1 0 0 0 0 0 0 0 0 0 1 5 0 1 1 0 0 0 0 0 0 0 0 0 0 0 0 0 0 0 0 5 0 0 0 0 0 0 0 0 0 0 0 0 0 0 0 0 3 0 0 0 1 0 0 0 1 0 0 0 2 0 0 0 0 0 0 0 3 3 0 0 0 0 0 0 0 0 0 0 0 0 1 0 1 0 0 0 1 0 0 0 0 1 0 0 0 0 0 0 0 0 0 0 0 0 0 0 0 0 1 0 0 2 0 0 0 0 0 0 0 0 0 0 0 2 0 1 0 0 0 0 0 0 0 0 1 0 0 0 0 0 1 0 0 1 0 1 1 0 0 0 0 0 0 0 0 0 0 1 0 0 0 0 0 0 0 0 0 0 0 0 0 0 5 0 0 0 0 0 0 0 0 0 0 0 0 0 0 0 0 2 0 1 0 0 0 0 0 0 0 0 0 0 0 0 0 0 1 0 0 0 0 0 0 0 0 1 0 0 0 0 0 0 0 0 0 0 0 1 0 0 2 0 0 0 0 0 0 0 2 0 0 0 0 0 1 0 1 0 0 0 0 0 0 0 0 0 0 0 1 0 0 0 0 0 0 0 0 0 0 0 0 0 0 0 0 0 0 0 1 0 4 0 0 0 0 0 0 0 0 0 0 0 0 0 0 0 0 0 0 0 0 0 0 0 0 0 0 0 0 0 0 3 0 0 0 0 0 0 0 0 0 0 0 0 0 0 0 0 1 0 1 0 0 1 0 0 0 0 0 0 0 0 0 0 0 0 2 0 0 0 0 0 0 0 0 0 0 0 0 1 0 0 0 0 0 0 0 0 0 0 0 0 0 0 0 0 0 0 0 0 0 0 0 0 0 0 1 0 0 0 0 0 0 0 0 0 1 0 0 0 0.05 0.10 0.15 0.20 0.25 0 0.10 0.20 0.30 0.40 S.c.–S.c. S.p.–S.p. S.p. CBS432 S.p. N44 S.p. UWOPS91-917.1 S.p. UFRJ50816 S.p. YPS138 Ty1/Ty2-LTR Ty1/Ty2-LTR YHR210C CRG1 BAT1 SET5 SKN7 Ty1/Ty2-LTR FLO5 TG repeat Y' element X element IMD2 PHO12 Ty1 YHR214W-A YHR212CYHR213W YHR213W-BYHR214W
CNE1ECM1BDH1BDH2 GDH3 FLO9 YAL063W-ATy1/Ty2-LTRYAL064W-A TDA8YAL064W-BYAL065CSEO1 YAL067W-APAU8X elementTG repeat
a
b
c
d
Figure 5 Evolutionary dynamics of subtelomeric duplications. (a) An example of subtelomeric duplication blocks shared among the chromosome
01-L (chr01-L), chr01-R and chr08-R subtelomeres in S. cerevisiae S288C. Gray shading indicates shared homologous regions with ≥90% sequence identity. (b) Subtelomeric duplication signals shared across strains. For each subtelomere pair, the number of strains showing strong sequence
homology (BLAT score ≥5,000 and identity ≥90%) is indicated in the heat map. (c) Hierarchical clustering based on the proportion of conserved orthologous subtelomeres in cross-strain comparisons within S. cerevisiae and S. paradoxus. (d) Subtelomere reshuffling intensities (log10 scale) within S. cerevisiae (S.c.–S.c.) and within S. paradoxus (S.p.–S.p.), adjusted by the diversification time of the compared strain pair. Center lines, median; boxes, interquartile range (IQR); whiskers, 1.5× IQR. Data points beyond the whiskers are outliers.
© 20 17 Nat ur e Amer ica, Inc., par t of Spr ing er Nat ur e. All r ights r eser ved.
Structural rearrangements in chromosomal cores
Structural rearrangements can be balanced (as with inversions, reciprocal translocations and transpositions) or unbalanced (as with large-scale novel insertions, deletions and duplications) depending on whether the copy number of genetic material is affected10. We
iden-tified 35 balanced rearrangements in total, including 28 inversions, 6 reciprocal translocations and 1 massive rearrangement (Fig. 3a,
Supplementary Fig. 5a–c and Supplementary Data Set 4). All events
occurred during the species-specific diversification of the two species, with 29 events occurring in S. paradoxus and only 6 in S. cerevisiae. Factoring in the cumulative evolutionary time difference, S. paradoxus still showed 1.25-fold faster accumulation of balanced rearrange-ments than S. cerevisiae. Six inversions were tightly packed into a ~200-kb region on chromosome VII of South American S. paradoxus UFRJ50816, indicating a strain-specific inversion hot spot (Fig. 3b). With regard to interchromosomal rearrangements, six were recipro-cal translocations that occurred in two S. paradoxus strains (Fig. 3c and Supplementary Fig. 5a,b). The remaining one, in the Malaysian S. cerevisiae UWOPS03-461.4, was particularly notable: chromosomes VII, VIII, X, XI and XIII were heavily reshuffled, confirming recent chromosomal contact data26 (Fig. 3c and Supplementary Fig. 5c).
We describe this as a massive rearrangement because it cannot be explained by typical independent reciprocal translocations but is more likely to result from a single catastrophic event resembling the chromothripsis observed in tumor cells32,33. This massive
rearrange-ment in the Malaysian S. cerevisiae and the rapid accumulation of inversions and translocations in the South American S. paradoxus resulted in extensively altered genome configurations, explaining the reproductive isolation of these two lineages34,35. As previously
observed in yeasts on larger divergence scales36,37, the breakpoints of
those balanced rearrangements are associated with tRNAs and Tys, highlighting the roles of these elements in triggering genome insta-bility and suggesting nonallelic homologous recombination as the mutational mechanism.
Considering unbalanced structural rearrangements in chromo-somal cores, we identified 7 novel insertions, 32 deletions, 4 dis-persed duplications and at least 7 tandem duplications (Fig. 3a and
Supplementary Data Set 5). There were two additional cases of
which the evolutionary history could not be confidently determined owing to multiple potential independent origins or secondary dele-tions (Supplementary Data Set 5). Although this is a conservative estimate, our identified unbalanced structural rearrangements clearly outnumbered the balanced ones, as recently reported in Lachancea yeasts38. We found that S. cerevisiae accumulated as many unbalanced
rearrangements as S. paradoxus despite its much shorter cumulative diversification time. We noticed that the breakpoints of these unbal-anced rearrangements (except for tandem duplications) were also fre-quently associated with Tys and tRNAs, mirroring our observation for balanced rearrangements. Finally, we found genes involved in unbal-anced rearrangements to be significantly enriched for Gene Ontology (GO) terms related to the binding, transporting and detoxification of metal ions (for example, Na+, K+, Cd2+ and Cu2+) (Supplementary Table 14), hinting that these events are probably adaptive.
Structural evolutionary dynamics of subtelomeres
The complete assemblies and well-defined subtelomere boundaries enabled us to examine subtelomeric regions with unprecedented reso-lution. We found both the size and gene content of the subtelomere to be highly variable across different strains and chromosome arms (Fig. 4a and Supplementary Data Set 3). The subtelomere size ranged from 0 81.1 kb 85.8 kb 71.4 kb 00 85.8 kb 0 85.8 kb 15S rRNA COX3OOO S.c. DBVPG6044 S.c. YPS128 S.c. Y12 S.c. UWOPS03-461.4 S.p. UWOPS91-917.1 S.p. UFRJ50816 S.p. YPS138 S.c. SK1 S.p. N44 S.p. CBS432 S.c. S288C S.c. DBVPG6765 S.a. H6 S.e. FM1318 0.02 96 100 97 89 66 97 72 75 100 94 100 15S rRNA COX3OORPM1PPP RPM1PPPPP 0 S .c . DBVPG604 4 71.5 kb 0 0 S .p. CBS432 S.p. C B S 432 71.5 kb 71.4 kb 0 S .p . YP S 13 8 S.c. S288C S.c. S288C S.p. YPS138 S.c. S288C ATP8 COX1 15S rRNA RPM1 COB COX3 COX2 15S rRNA21S rRNA RPM1 COX3 VAR1 OLI1 COB ATP6 15S rRNA
a
b
c
d
e
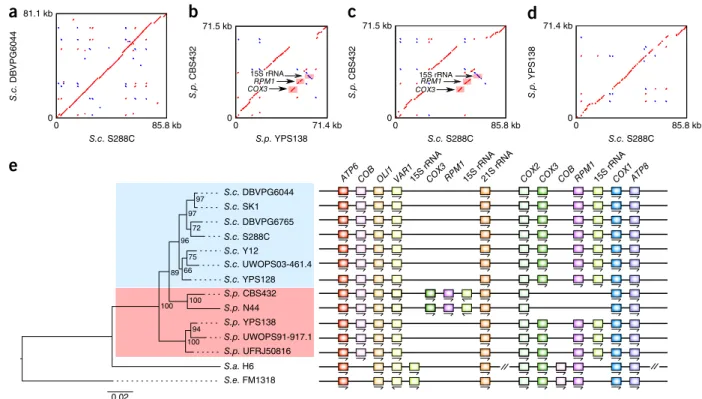
Figure 6 Comparative mitochondrial genomics. (a–d) Pairwise comparisons for the mitochondrial genomes of S288C and DBVPG6044 from
S. cerevisiae (a), CBS432 and YPS138 from S. paradoxus (b), S. cerevisiae S288C and S. paradoxus CBS432 (c) and S. cerevisiae S288C and S. paradoxus YPS138 (d). (e) Genomic arrangement of the mitochondrial protein-coding genes and RNA genes across the 12 sampled strains. Left, phylogenetic tree constructed on the basis of mitochondrial protein-coding genes, with the number at each internal node showing rapid bootstrap support. The detailed gene arrangement map is shown on the right. There is a large inversion in S. arboricolus that encompasses the entire COX2–ATP8 (according to its original mitochondrial genome assembly), which we inverted back this segment for better visualization.
© 20 17 Nat ur e Amer ica, Inc., par t of Spr ing er Nat ur e. All r ights r eser ved.
0.13 to 76 kb (median = 15.6 kb), the number of genes enclosed in each subtelomere varied between 0 and 19 (median = 4), and the total number of subtelomeric genes varied between 134 and 169 (median = 146) per strain. Whereas the very short subtelomeres (for example,
chromosome 04-R and chromosome 11-L) can be explained by an unexpected high degree of synteny conservation extending all the way to the end, some exceptionally long subtelomeres are the products of multiple mechanisms. For example, the chromosome 15-R subtelomere
25 20 15 10 5 0 25 20 15 10 5 0 1 2 0 Generation time (h) LOD score IV X XIV XVI Arsenite concentration (mM) 0 5 10 25 Chr03-R: NW NW NW WW WW WW
N: YPS128 (North American S.c.) W: DBVPG6044 (West African S.c.) Chr16-R: NN NW NN NW NN NW Generation time (h) Arsenite concentration: 3 mM ARR content: 20 15 Telomere Telomere Telomere Telomere Telomere Telomere Telomere Telomere Telomere ARR1 ARR3
Other ORFs Ty-related
Pseudo-ARR2 X element CUP1 Pseudo-CUP1 Other ORFs S.c. S288C (n = 10+1*) S.p. YPS138 (n = 1) S.p. UFRJ50816 (n = 1*) S.c. DBVPG6044 (n = 1) S.c. DBVPG6765 (n = 4) S.c. SK1 (n = 1) S.c. Y12 (n = 7) S.c. YPS128 (n = 1) S.c. UWOPS03-461.4 (n = 1) S.p. CBS432 (n = 1) S.p. N44 (n = 1) S.p. UWOPS91-917.1 (n = 1) ChrVIII ChrVIII ChrVIII ChrVIII ChrVIII ChrVIII ChrVIII ChrVIII ChrVIII ChrVIII ChrVIII ChrVIII Partial-RSC30 (YHR054C) RSC30 S.c. S288C (n = 1) S.p. YPS138 (n = 1) S.p. UFRJ50816 (n = 1*) S.c. DBVPG6044 (n = 1) S.c. DBVPG6765 (n = 1) S.c. SK1 (n = 0) S.c. Y12 (n = 1) S.c. YPS128 (n = 1) S.c. UWOPS03-461.4 (n = 0) S.p. CBS432 (n = 2) S.p. N44 (n = 0) S.p. UWOPS91-917.1 (n = 0) Chr03-R Chr16-R Chr16-R Chr16-R Chr02-R Chr07-R Chr13-L Chr13-L Chr16-R 0 1 2 ARR cluster S.p. YPS138 S.c. YPS128 S.p. UWOPS91-917.1 S.p. UWOPS03-461.4 S.p. UFRJ50816 S.p. N44 S.c. DBVPG6044 S.c. DBVPG6765 S.p. CBS432 CUP1 1 4 7 S.c. S288C S.c. SK1 S.c. Y12 30 20 10 S.p. YPS138 S.c. YPS128 S.p. UWOPS91-917.1 S.p. UWOPS03-461.4 S.p. UFRJ50816 S.p. N44 S.c. DBVPG6044 S.c. DBVPG6765 S.p. CBS432 S.c. S288C S.c. SK1 S.c. Y12 Generation time (h) 30 20 10 Generation time (h) 10
a
b
ARR2 Y′ elementc
d
I II III V VI VII VIII IX XI XII XIII XV
e
3 NN NN NN WW WW WWf
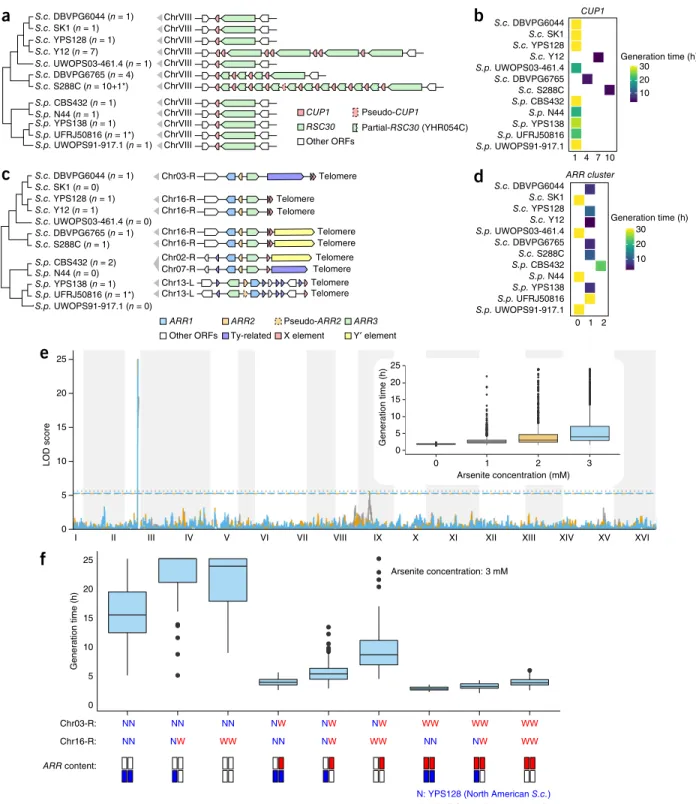
Figure 7 Structural rearrangements illuminate complex phenotypic variation. (a–d) Copy number and gene arrangement of the CUP1 locus (a) and the
ARR cluster (c) across the 12 strains (asterisks denote involvement of pseudogenes), and generation time of the 12 strains in copper (b) and high-arsenic conditions (d). (e) The rearrangement that relocates the ARR cluster to the chromosome 03-R (chr03-R) subtelomere in the West African
S. cerevisiae DBVPG6044 is consistent with the linkage mapping analysis using phased outbred lines (POLs) derived from North American (YPS128) and West African (DBVPG6044) S. cerevisiae. (f) Phenotypic distribution of the 826 POLs for generation time in arsenic condition partitioned for genotype positions at the chr03-R and chr16-R subtelomeres and inferred copies of ARR clusters (bottom). Center lines, median; boxes, interquartile range (IQR); whiskers, 1.5× IQR. Data points beyond the whiskers are outliers.
© 20 17 Nat ur e Amer ica, Inc., par t of Spr ing er Nat ur e. All r ights r eser ved.
of S. cerevisiae DBVPG6765 has been drastically elongated by a 65-kb horizontal gene transfer (HGT)39 (Fig. 4b and Supplementary Fig. 6a). The chromosome 07-R subtelomere of S. paradoxus CBS432
was extended by a series of tandem duplications of MAL31-like and MAL33-like genes, as well as the addition of the ARR cluster (Fig. 4c and Supplementary Fig. 6b). The chromosome 15-L subtelomere of S. paradoxus UFRJ50816 increased size by duplications of subtelomeric segments from two other chromosomes (Fig. 4d and Supplementary
Fig. 6c). Inversions have also occurred in subtelomeres, including
one affecting the HMRA1–HMRA2 locus in UFRJ50816 and another affecting a MAL11-like gene in CBS432 (Supplementary Fig. 7).
The enrichment of segmental duplication blocks occurring via ectopic sequence reshuffling is a common feature of eukaryotic subtelomeres; however, incomplete genome assemblies have pre-vented population-level quantitative analysis of this phenomenon. Here we identified subtelomeric duplication blocks based on pair-wise comparisons of different subtelomeres within the same strain (Fig. 5a and Supplementary Data Set 6). In total, we identified 173 pairs of subtelomeric duplication blocks across the 12 strains, with 8–26 pairs for each strain (Supplementary Table 15). Among the 16 pairs of subtelomeric duplication blocks previously identi-fied in S288C (mentioned above), all the 12 larger pairs passed our filtering criteria. Notably, the Hawaiian S. paradoxus UWOPS91-917.1 had the most subtelomeric duplication blocks, and half of these were strain-specific, suggesting unique subtelomere evolu-tion in this strain. The duplicated segments always maintained the same centromere–telomere orientation, supporting a mutational mechanism of double-strand break (DSB) repair like those pre-viously suggested in other species40,41. We further summarized
those 173 pairs of duplication blocks according to the orthologous subtelomeres involved. This led to 75 unique duplicated subte-lomere pairs, 59 (78.7%) of which have not been described before (Supplementary Data Set 7). We found 31 (41.3%) of these unique pairs to be shared between strains or even between species with highly dynamic strain-sharing patterns (Fig. 5b and Supplementary
Fig. 8a). Most (87.1%) of this sharing pattern could not be explained
by the strain phylogeny (Supplementary Data Set 7). This sug-gests a constant gain-and-loss process of subtelomeric duplications throughout evolutionary history.
Given the rampant subtelomere reshuffling, we investigated to what extent the similarity in orthologous subtelomere composition reflects the intra-species phylogenies. We measured the proportion of con-served orthologous subtelomeres in all strain pairs within the same species and performed hierarchical clustering accordingly (Fig. 5c). The clustering in S. paradoxus correctly recapitulated the true phyl-ogeny, whereas the clustering in S. cerevisiae showed a different topol-ogy, and only the relationship of the most recently diversified strain pair (DBVPG6044 versus SK1) was correctly recovered. Notably, the distantly related Wine/European (DBVPG6765) and Sake (Y12) S. cerevisiae strains were clustered together, suggesting possible con-vergent subtelomere evolution during their respective domestica-tion for alcoholic beverage producdomestica-tion. The propordomestica-tion of conserved orthologous subtelomeres among S. cerevisiae strains (56.3–81.3%) is comparable to that among S. paradoxus strains (50.0–81.3%), despite the much smaller diversification timescales of S. cerevisiae. This trans-lates into a 3.8-fold difference in subtelomeric reshuffling intensity between the two species during their respective diversifications (one-sided Mann–Whitney U-test, P = 2.93 × 10⁻⁸) (Fig. 5d). The frequent
reshuffling of subtelomeric sequences often has drastic impacts on gene content, both qualitatively and quantitatively. For example, four
genes (PAU3, ADH7, RDS1 and AAD3) were lost in S. cerevisiae Y12 owing to a single subtelomeric duplication event (chromosome 08-L to chromosome 03-R) (Supplementary Fig. 8b). Therefore, the accel-erated subtelomere reshuffling in S. cerevisiae is likely to have impor-tant functional implications.
Native noncanonical chromosome end structures
S. cerevisiae chromosome ends are characterized by two telomere-associated sequences: the core X and the Y′ element42. The core X
ele-ment is present in nearly all chromosome ends, whereas the number of Y′ elements varies across chromosome ends and strains. The two previously described chromosome end structures have (i) a single core X element or (ii) a single core X element followed by 1–4 distal Y′ elements42. S. paradoxus chromosome ends also contain core X and
Y′ elements43, but their detailed structures and genome-wide
distri-butions have not been systematically characterized. Across our 12 strains, most (~85%) chromosome ends had one of the two structures described above, but we also discovered novel chromosome ends (Supplementary Table 13). We found several examples of tandem duplications of the core X element in both species. In most cases, including the ones in the S. cerevisiae reference genome (chromo-some VIII-L and chromo(chromo-some XVI-R), the proximal duplicated core X elements had degenerated, but we found two examples where intact duplicated copies were retained: chromosome XII-R in S. cerevisiae Y12 and chromosome III-L in S. paradoxus CBS432. The latter was especially notable, with six core X elements (including three com-plete copies) arranged in tandem. We discovered five chromosome ends consisting of only Y′ elements (one or more copies) but no core X elements. This was unexpected given the importance of core X ele-ments in maintaining genome stability44,45. The discovery of these
noncanonical chromosome end structures offers a new paradigm to investigate the functional role of core X elements.
Mitochondrial genome evolution
Despite being highly repetitive and AT-rich, the mitochondrial genomes of the S. cerevisiae strains showed high degrees of collinear-ity (Fig. 6a). In contrast, S. paradoxus mitochondrial genomes showed lineage-specific structural rearrangements. The two Eurasian strains (CBS432 and N44) share a transposition of the entire COX3–RPM1 (rnpB)–15s rRNA (rns) segment, in which 15s rRNA was further inverted (Fig. 6b–d). In addition, given the gene order in two outgroups, the COB gene was relocated in the common ancestor of S. cerevisiae and S. paradoxus (Fig. 6e). The phylogenetic tree inferred from mito-chondrial protein-coding genes showed clear deviation from the nuclear tree (Fig. 6e). In particular, the Eurasian S. paradoxus lineage (CBS432 and N44) clustered with the seven S. cerevisiae strains before joining with the other S. paradoxus strains, which supports the idea of mitochondrial introgression from S. cerevisiae46 (Fig. 6e). We found
low topology consensus (normalized quartet score = 0.59, versus 0.92 for the nuclear gene tree) across different mitochondrial gene loci, suggesting heterogeneous phylogenetic histories. Together with the drastically dynamic presence and absence patterns of mitochondrial group I and group II introns (Supplementary Table 10), this rein-forces the argument for extensive cross-strain recombination in yeast mitochondrial evolution47. In addition, the COX3 gene in S.
para-doxus UFRJ50816 and UWOPS91-917.1 started with GTG rather than the typical ATG start codon, which was further supported by Illumina reads. This suggests either an adoption of an alternative ATG start codon nearby (for example, 45 bp downstream) or a rare case of a near-cognate start codon48–50.
© 20 17 Nat ur e Amer ica, Inc., par t of Spr ing er Nat ur e. All r ights r eser ved.
Fully resolved SVs illuminate complex phenotypic traits
SVs are expected to account for a substantial fraction of phenotypic variation; fully resolved SVs can therefore be crucial in understand-ing complex phenotypic traits. We used the copper tolerance–related CUP1 locus and the arsenic tolerance–related ARR cluster as examples of associations between fully characterized genomic compositions (i.e., copy numbers and genotypes) and conditional growth rates. The PacBio assemblies precisely resolved these complex loci, and pheno-type associations were consistent with previous findings based on copy number analysis6,21,51 (Fig. 7a–d and Supplementary Note). We
further illustrated their phenotypic contributions via linkage mapping using 826 phased outbred lines (POLs) derived from crossing the North American (YPS128) and West African (DBVPG6044) S. cer-evisiae52 (Online Methods). The linkage analysis accurately mapped
a large-effect quantitative trait locus (QTL) at the chromosome 03-R subtelomere (the location of the ARR genes in DBVPG6044), but showed no arsenic resistance association with the YPS128 ARR locus on the chromosome 16-R subtelomere (Fig. 7e). This profile is consistent with the relocation of an active ARR cluster to the chro-mosome 03-R subtelomere in DBVPG6044 and the presence of del-eterious mutations predicted to inactivate the ARR cluster in YPS128 (refs. 6,35). Thus, a full understanding of the relationship between genome sequence and arsenic resistance phenotype is not provided by the knowledge of copy number alone but rather requires the com-bined knowledge of genotype, genomic location and copy number as provided by our end-to-end assemblies (Fig. 7f).
DISCUSSION
The landscape of genetic variation is shaped by multiple evolutionary processes, including mutation, drift, recombination, gene flow, natu-ral selection and demographic history. The combined effect of these factors can vary considerably both across the genome and between species, resulting in different patterns of evolutionary dynamics. The complete genome assemblies that we generated for multiple strains from both domesticated and wild yeasts provide a unique data set for exploring such patterns with unprecedented resolution.
Considering the evolutionary dynamics across the genome, eukary-otic subtelomeres are exceptionally variable compared to chromo-somal cores40,53,54, with accelerated evolution manifest in extensive
CNV accumulation, rampant ectopic reshuffling and rapid functional divergence6,41,55–57. Our study provides a quantitative comparison of
subtelomeres and cores in structural genome evolution and a high-resolution view of the extreme evolutionary plasticity of subtelomeres. This rapid evolution of subtelomeres can substantially alter the gene repertoire and generate novel recombinants with adaptive potential57.
Given that subtelomeric genes are highly enriched in functions medi-ating interactions with external environments (for example, stress response, nutrient uptake and ion transport)6,55,58, it is tempting
to speculate that the accelerated subtelomeric evolution reflects selection for evolvability, i.e., the ability to respond and adapt to changing environments59.
With regard to the genome dynamics between species, external fac-tors such as selection and demographic history have important roles. The ecological niches and recent evolutionary history of S. cerevisiae have been intimately associated with human activities, with many strains isolated from human-associated environments such as brew-eries, bakeries and even clinical patients60. Consequently, this wide
spectrum of selection schemes could significantly shape the genome evolution of S. cerevisiae. In addition, human activities also promoted admixture and cross-breeding of S. cerevisiae strains from different geographical locations and ecological niches61, resulting in many
mosaic strains with mixed genetic backgrounds1. In contrast, the
wild-living S. paradoxus occupies very limited ecological niches, with most strains isolated from trees in the Quercus genus62. S. paradoxus
strains from different geographical subpopulations are genetically well differentiated with partial reproductive isolations34,63. Such
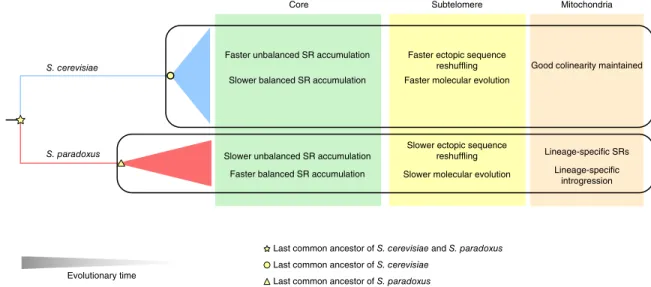
interspecific differences in their history could result in distinct evo-lutionary genome dynamics, which is captured in our study (Fig. 8). In chromosomal cores, S. cerevisiae strains show slower accumulation of balanced structural rearrangements compared with S. paradoxus strains. This pattern might be explained by the admixture between different S. cerevisiae subpopulations during their recent association with human activities, which would considerably impede the fixation of balanced structural rearrangements. In contrast, geographical iso-lation of different S. paradoxus subpopuiso-lations would favor relatively fast fixation of balanced structural rearrangements64. We observed
an opposite pattern for unbalanced rearrangements in chromosomal cores. The S. cerevisiae strains accumulate such changes more rapidly Core
Evolutionary time S. cerevisiae
S. paradoxus
Mitochondria
Good colinearity maintained
Lineage-specific SRs Subtelomere
Faster ectopic sequence reshuffling
Slower ectopic sequence reshuffling Slower balanced SR accumulation
Faster unbalanced SR accumulation
Faster balanced SR accumulation Slower unbalanced SR accumulation
Faster molecular evolution
Slower molecular evolution
Last common ancestor of S. cerevisiae and S. paradoxus Last common ancestor of S. cerevisiae
Last common ancestor of S. paradoxus
Lineage-specific introgression
Figure 8 Contrasting evolutionary dynamics across the genomic landscape between S. cerevisiae and S. paradoxus. The interspecific contrasts in
nuclear chromosomal cores, subtelomeres and mitochondrial genomes are summarized. SR, structural rearrangement.
© 20 17 Nat ur e Amer ica, Inc., par t of Spr ing er Nat ur e. All r ights r eser ved.
than their S. paradoxus counterparts, which is probably driven by selection, considering the biological functions of those affected genes. Likewise, the more rapid subtelomeric reshuffling and higher dN/dS of subtelomeric genes in S. cerevisiae than in S. paradoxus are prob-ably also driven by selection. As a consequence of such unbalanced rearrangements and subtelomeric reshuffling, S. cerevisiae strains show more rapid CNV accumulation and GOL, which reinforces this argument. In addition, the mitochondrial genomes of S. cerevi-siae strains maintained high degrees of collinearity, whereas those of S. paradoxus strains showed lineage-specific structural rearrange-ments and introgression, suggesting distinct modes of mitochon-drial evolution. Taken together, many of these observed differences between S. cerevisiae and S. paradoxus probably reflect the influence of human activities on structural genome evolution, which sheds new light on why S. cerevisiae, but not its wild relative, is one of our most biotechnologically important organisms.
URLs. Previously identified subtelomeric duplication blocks in S.
cer-evisiae S288C, http://www2.le.ac.uk/colleges/medbiopsych/research/ gact/images/clusters-fixed-large.jpg; RepeatMasker, http://www. repeatmasker.org; FastQC, http://www.bioinformatics.babraham. ac.uk/projects/fastqc/; Picard tools, http://broadinstitute.github. io/picard/; vcflib, https://github.com/vcflib/vcflib; MFannot, http:// megasun.bch.umontreal.ca/cgi-bin/mfannot/mfannotInterface.pl; The Saccharomyces Genome Database (SGD), http://www.yeastge-nome.org; FigTree, http://tree.bio.ed.ac.uk/software/figtree/.
METHODS
Methods, including statements of data availability and any associated accession codes and references, are available in the online version of the paper.
Note: Any Supplementary Information and Source Data files are available in the online version of the paper.
ACKnOWLeDGMents
We thank G. Drillon for the help with using the program CHROnicle. We thank O. Croce and R. Marangoni for help with maintaining the computing server and various bioinformatics tools. We thank A. Llored for technical help with yeast strains and DNA samples. This work was supported by ATIP-Avenir (CNRS/ INSERM), Fondation ARC pour la Recherche sur le Cancer (PJA20151203273), Marie Curie Career Integration Grants (322035), Agence Nationale de la Recherche (ANR-16-CE12-0019, ANR-13-BSV6-0006-01 and ANR-11-LABX-0028-01), Cancéropôle PACA (AAP émergence 2015) and a DuPont Young Professor Award to G.L.; the Wellcome Trust (WT098051 to R.D.) and Vetenskapsrådet (The Swedish Research Council, 325-2014-4605 to J.W.). J.-X.Y. is supported by a postdoctoral fellowship from Fondation ARC pour la Recherche sur le Cancer (PDF20150602803). J.L. is supported by a postdoctoral fellowship from Fondation ARC pour la Recherche sur le Cancer (PDF20140601375). J.H. is supported by the Labex SIGNALIFE program from Agence Nationale de la Recherche (ANR-11-LABX-0028-01).
AUtHOR COntRIBUtIOns
J.-X.Y. conceived, designed and performed bioinformatics analysis and wrote the manuscript; J.L. prepared DNA samples for sequencing, performed the experiment on verifying structural rearrangements and contributed to the manuscript; L.A. performed PacBio sequencing and helped with diagnosing the assembly pipeline; J.H. performed experiments and data analysis for phenotyping and contributed to the manuscript; K.P. performed experiments and data analysis for phenotyping and contributed to the manuscript; K.O. performed the PacBio sequencing and ran the standard assembly pipeline; A.B. helped with discussion on data analysis and manuscript preparation; P.C. performed the PacBio sequencing for the pilot phase project; J.W. designed the phenotyping experiment and helped with data interpretation; M.C.L. helped with the analysis on measuring the sequence homology for subtelomeres; G.F. helped with study design, results discussion and manuscript writing; R.D. conceived and designed the study; G.L. conceived, designed and guided the study and wrote the manuscript.
COMPETING FINANCIAL INTERESTS
The authors declare no competing financial interests.
Reprints and permissions information is available online at http://www.nature.com/ reprints/index.html. Publisher’s note: Springer Nature remains neutral with regard to jurisdictional claims in published maps and institutional affiliations.
This work is licensed under a Creative Commons Attribution 4.0 International (CC BY 4.0) license. The images or other third party material in this article are included in the article’s Creative Commons license, unless indicated otherwise in the credit line; if the material is not included under the Creative Commons license, users will need to obtain permission from the license holder to reproduce the mate-rial. To view a copy of this license, visit http://creativecommons.org/licenses/by/4.0/ 1. Liti, G. et al. Population genomics of domestic and wild yeasts. Nature 458,
337–341 (2009).
2. 1000 Genomes Project Consortium. A map of human genome variation from population-scale sequencing. Nature 467, 1061–1073 (2010).
3. Cao, J. et al. Whole-genome sequencing of multiple Arabidopsis thaliana populations. Nat. Genet. 43, 956–963 (2011).
4. Mackay, T.F.C. et al. The Drosophila melanogaster genetic reference panel. Nature
482, 173–178 (2012).
5. Huang, W. et al. Natural variation in genome architecture among 205 Drosophila melanogaster Genetic Reference Panel lines. Genome Res. 24, 1193–1208 (2014). 6. Bergström, A. et al. A high-definition view of functional genetic variation from
natural yeast genomes. Mol. Biol. Evol. 31, 872–888 (2014).
7. Strope, P.K. et al. The 100-genomes strains, an S. cerevisiae resource that illuminates its natural phenotypic and genotypic variation and emergence as an opportunistic pathogen. Genome Res. 25, 762–774 (2015).
8. 1001 Genomes Consortium. 1,135 genomes reveal the global pattern of polymorphism in Arabidopsisthaliana. Cell 166, 481–491 (2016).
9. Gallone, B. et al. Domestication and divergence of Saccharomyces cerevisiae beer yeasts. Cell 166, 1397–1410 (2016).
10. Feuk, L., Carson, A.R. & Scherer, S.W. Structural variation in the human genome. Nat. Rev. Genet. 7, 85–97 (2006).
11. Rieseberg, L.H. Chromosomal rearrangements and speciation. Trends Ecol. Evol.
16, 351–358 (2001).
12. Weischenfeldt, J., Symmons, O., Spitz, F. & Korbel, J.O. Phenotypic impact of genomic structural variation: insights from and for human disease. Nat. Rev. Genet. 14, 125–138 (2013).
13. Goodwin, S., McPherson, J.D. & McCombie, W.R. Coming of age: ten years of next-generation sequencing technologies. Nat. Rev. Genet. 17, 333–351 (2016). 14. Chaisson, M.J.P. et al. Resolving the complexity of the human genome using
single-molecule sequencing. Nature 517, 608–611 (2015).
15. Gordon, D. et al. Long-read sequence assembly of the gorilla genome. Science
352, aae0344 (2016).
16. Pryde, F.E., Gorham, H.C. & Louis, E.J. Chromosome ends: all the same under their caps. Curr. Opin. Genet. Dev. 7, 822–828 (1997).
17. Mefford, H.C. & Trask, B.J. The complex structure and dynamic evolution of human subtelomeres. Nat. Rev. Genet. 3, 91–102 (2002).
18. Eichler, E.E. & Sankoff, D. Structural dynamics of eukaryotic chromosome evolution. Science 301, 793–797 (2003).
19. Dujon, B. Yeast evolutionary genomics. Nat. Rev. Genet. 11, 512–524 (2010). 20. Goffeau, A. et al. Life with 6000 genes. Science 274, 546–567, 563–567
(1996).
21. Warringer, J. et al. Trait variation in yeast is defined by population history. PLoS Genet. 7, e1002111 (2011).
22. Wheelan, S.J., Scheifele, L.Z., Martínez-Murillo, F., Irizarry, R.A. & Boeke, J.D. Transposon insertion site profiling chip (TIP-chip). Proc. Natl. Acad. Sci. USA
103, 17632–17637 (2006).
23. Shibata, Y., Malhotra, A., Bekiranov, S. & Dutta, A. Yeast genome analysis identifies chromosomal translocation, gene conversion events and several sites of Ty element insertion. Nucleic Acids Res. 37, 6454–6465 (2009).
24. Hoang, M.L. et al. Competitive repair by naturally dispersed repetitive DNA during non-allelic homologous recombination. PLoS Genet. 6, e1001228 (2010). 25. Liti, G., Peruffo, A., James, S.A., Roberts, I.N. & Louis, E.J. Inferences of
evolutionary relationships from a population survey of LTR-retrotransposons and telomeric-associated sequences in the Saccharomycessensu stricto complex. Yeast
22, 177–192 (2005).
26. Marie-Nelly, H. et al. High-quality genome (re)assembly using chromosomal contact data. Nat. Commun. 5, 5695 (2014).
27. Tajima, F. Simple methods for testing the molecular evolutionary clock hypothesis. Genetics 135, 599–607 (1993).
28. Winzeler, E.A. et al. Functional characterization of the S. cerevisiae genome by gene deletion and parallel analysis. Science 285, 901–906 (1999).
29. Rocha, E.P.C. DNA repeats lead to the accelerated loss of gene order in bacteria. Trends Genet. 19, 600–603 (2003).
30. Rocha, E.P.C. Inference and analysis of the relative stability of bacterial chromosomes. Mol. Biol. Evol. 23, 513–522 (2006).
31. Fischer, G., Rocha, E.P.C., Brunet, F., Vergassola, M. & Dujon, B. Highly variable rates of genome rearrangements between hemiascomycetous yeast lineages. PLoS Genet. 2, e32 (2006). © 20 17 Nat ur e Amer ica, Inc., par t of Spr ing er Nat ur e. All r ights r eser ved.