Geophys. J. Int. (1996) 127,399-414
A
lithospheric cross-section through the Swiss Alps-11.
Constraints on the mechanical structure
of
a continent-continent
collision zone
N. Okays,'**
S.
Cloetingh' and St. Mueller2
'Institute of Earth Sciences, Vrije Unioersiteit, De Boelelaan 1085, NL-1081 HV, Amsterdam, the Netherlands 21nstitute of Geophysics, ETH Zurich, ETH Hoenggerberg, CH-8093 Zurich, Switzerland
Accepted 1996 July 5. Received 1996 June 19; in original form 1995 January 4
S U M M A R Y
The calculation of strength profiles along the European Geotraverse (EGT) through the Swiss Alps yields constraints on the large-scale vertical and lateral mechanical structure through the Alpine continent-continent collision zone. Strength profiles are evaluated for different assumptions
on
petrological stratification and strain rate and are based o n temperature-depth profiles derived from transient thermo-kinematic modelling of the Neoalpine orogeny. The main contribution to the total strength results from the mantle lithosphere, which is strongly controlled by temperature. In contrast, the crustal contribution is mainly determined by variations in petrological stratification. A direct correlation between surface heat flow and the total strength of the crust, the mantle lithosphere and the entire lithosphere (crust and mantle lithosphere) is not observed. O u r results demonstrate that in tectonically active areas a transient thermal model, along with detailed knowledge of the deep structure and petrology, is necessary to evaluate lithospheric strength envelopes. Inside the collision zone, strain rate has a strong controlon
the bottom of the mechanically strong crust, whereas outside the collision zone the effect is less significant. The cut-off depth of seismicity along the profile, which correlates largely with the bottom of the mechanically strong crust, deviates from the 30WOO"C isotherm. The inferred effective elastic thickness for the
Molasse Basin north of the Alpsis
in agreement with flexural modelling results, whereas for the Southern Alps the predictions deviate.Key words: collision belts, crustal deformation, European Geotraverse, lithosphere,
Swiss Alps.
1 I N T R O D U C T I O N
In the companion paper (Okaya et a!. 1996) we developed a thermo-kinematic model to investigate the present-day thermal structure of the lithosphere along the European Geotraverse (EGT) through the Swiss Alps. Here we use these results to
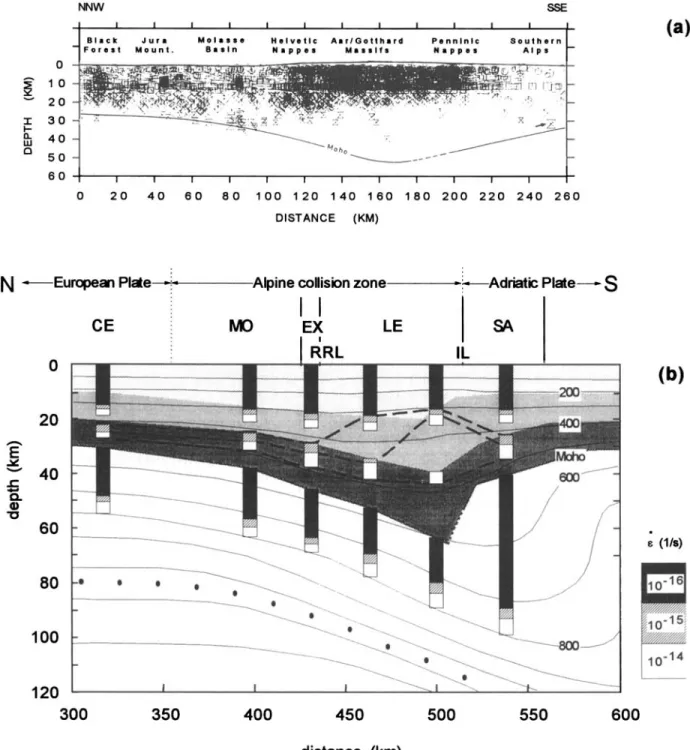
obtain constraints on the mechanical structure of the litho- sphere through the Alpine collision zone (Fig. 1) based on the concept of strength envelopes.
A number of recent studies have investigated the mechanical structure of the lithosphere in the Alpine collision zone. Flexural models were applied to the external part of the mountain range, i.e. the Molasse Basin in the north (Karner
& Watts 1983; Lyon-Caen & Molnar 1989; Sinclair et al. 1991;
*
Now at: Institute of Geophysics, FU Berlin, Malteserstrasse 74-100, Haus D, D-12249 Berlin, Germany.Royden 1993) and the Southern Alps in the south (Royden 1993). In these models, the deflection due to (sub)surface loading and boundary forces is calculated by assuming that the mechanical lithosphere can be represented by an elastic plate of uniform thickness overlying an inviscid fluid. By fitting the gravity anomaly and basement structure, these models provide estimates of the flexural rigidity and equivalent effective elastic thickness (EET) of the lithosphere. Published elastic- plate models were restricted to the borders of the Alpine mountain range. Furthermore, they clearly ignore the hetero- geneous seismic velocity and density distributions as well as the intrinsically complex rheology of the lithosphere. Such aspects are considered in finite-element models, in which the stress and strain fields resulting from body forces due to lithospheric density heterogeneity and plate-boundary forces are calculated using rheological models based on the results of rock mechanics. These models are constrained by gravity
400 N . Okaya, S. Cloetingh and St. Mueller
EGT
N
Figure 1. Tectonic map of the Central and Western Alps (after Coward & Dietrich 1989) showing the location of the European Geotraverse (EGT) and the main tectonic units. MO. Molasse Basin; E X External Massifs; RRL: RhineRhone Line; LE: Lepontine of the Penninic domain;
IL: Insubric Line; SA: Southern Alps. CE refers to central Europe
data, topography and the deep lithospheric structure. Finite- element models of the Alps (e.g. Bott 1990) predict a complex
distribution of tectonic stress with tension in the core and compression at the borders of the mountain belt. Plane-strain finite-element models were used to investigate the state and propagation of crustal deformation (e.g. Willett 1992;
Beaumont, Fullsack & Hamilton 1994), whereas models related
to Alpine structure document a non-uniform distribution of strain rate in the collision zone. Each of these models investi- gates certain mechanical parameters of the lithosphere by assuming a generalized rheological model. However, tempera- ture-depth profiles, which have a major control on rheology, are-if at all-approximated by a steady-state model, although stationary temperature fields are not very likely to be represen- tative of the thermal structure in collision zones.
In the present study we estimate the mechanical structure of the lithosphere through the Alpine collision zone based on the concept of strength envelopes, which provide a first-order model of the mechanical structure and offer the possibility of incorporating depth profiles of petrology and temperature consistent with observations. So far for the Alpine region, only rough estimates on the temperature-depth distribution have
been used to derive strength envelopes for the Molasse Basin and the External Massifs (Deichmann 1990; Cloetingh &
Banda 1992). In our calculation, we use the temperature field
derived from transient thermo-kinematic modelling of the Neoalpine orogeny (Okaya et al. 1996), which provides, to
date, the most reliable estimate of the present-day lithospheric thermal structure along the EGT through the Swiss Alps. The deep seismic image (Pfiffner et al. 1988; Ye & Ansorge 1990;
Valasek et al. 1991; Ye et al. 1995) and the density structure
derived from gravity modelling (Holliger & Kissling 1992)
provide detailed information on the regional petrological struc- ture. The complex mechanical structure in continent-continent collision zones (e.g. Bott 1990; Willett 1992; Beaumont et al.
1994) is taken into account by considering different values of
strain rates for both compressional and extensional settings. From the strength envelopes we obtain estimates for the brittle-ductile transition, the total crustal and lithospheric strengths, the thicknesses of the mechanically strong crust and lithosphere, and the effective elastic thickness. The predicted mechanical structure is subsequently compared to other geo- physical data such as the seismicity-depth distribution, the effective elastic thickness from flexural analysis, the pattern of
Lithospheric cross-section, Swiss Alps-11 401
the surface heat flow, and the lithospheric thermal structure as predicted by thermo-kinematic modelling results (Okaya
et al. 1996).
2 C O N S T R U C T I O N OF S T R E N G T H
E N V E L O P E S
The three deformation laws to be considered during inelastic deformation of the lithosphere are as follows (e.g. Ranalli 1987). (1) The brittle strength is described by a frictional shear failure criterion (Coulomb criterion), which can be expressed as:
(1)
o1 - o3 = fipgz( 1 - A )
(Sibson 1974), where 01-u3 is the critical stress difference, z is the depth, p is the average density of the overlying material at depth z, g is the acceleration of gravity (g'9.8 m s-'),
fi
is a parameter depending on the type of faulting, and A is the pore fluid factor, which is defined as the ratio of the pore fluid pressure to the overburden pressure. The pore fluid factor is chosen to be 0.36, corresponding to a pore fluid pressure equal to the hydrostatic pressure. The adopted value offi
is 3 and 0.75 for thrust (compressional regime) and normal (extensional regime) faulting, respectively. By introducing a layered lithospheric model (Fig. 2d) the increasing density with depthis implicitly taken into account, although its influence on strength is very small. The density within each layer is assumed to be homogeneous and is represented by average values chosen according to the densities given by Holliger & Kissling (1992) {Fig. 2c). As pointed out by various studies, the shear Coulomb criterion describes the strength in the upper to middle crust fairly well (e.g. Zoback et al. 1993). For lack of alternative failure formulations, we assume that the shear Coulomb criterion can be extrapolated to lower-crustal and upper-mantle depths. This assumption probably overestimates lithospheric strength (Carter & Tsenn 1987; Ord & Hobbs
1989; Ranalli 1991).
(2) The ductile strength can be described by the power-law creep equation, which is based on the experimentally deter- mined flow behaviour of silicate polycrystals at high tempera- tures:
(Carter & Tsenn 1987; Kirby & Kronenberg 1987; Ranalli 1987), where 01-03 is the critical stress difference, i is the
strain rate, T is the temperature, R is the gas constant ( R =
8.314 J mol-' K-'). Quantities B , N and the activation energy
E depend on the rock type and are experimentally determined. (3) It is commonly assumed that for stresses in excess of 200 MPa, dislocation glide becomes the dominant creep pro- cess in olivine and is described by a Dorn creep law:
(3) (Goetze & Evans 1979; Brace & Kohlstedt 1980), where o1
-
o3is the critical stress difference, i is the strain rate, T is the temperature, R is the gas constant (R=8.314 J mol-' K - I )
and A,, E , and o, are flow parameters that depend on rock type.
The frictional failure criterion (eq. 1) is essentially a pressure-
dependent mechanism that is relatively independent of tem- perature. In contrast, power-law creep (eq. 2) and Dorn creep (eq. 3) are strongly temperature-dependent and, therefore, require knowledge of the temperatureedepth distribution. Rheological profiles are constructed by comparing brittle (eq. 1) and ductile (eqs 2 or 3) strength values assuming that the relevant lithospheric strength is the smaller magnitude. Following Ranalli & Murphy (1987), we further assume as a first-order approximation that the brittleductile transition is sharp. Although in nature the brittle-ductile transition prob- ably occurs over a range of a few kilometres (Rutter & Brodie 1988; Rutter & Brodie 1991), an abrupt discontinuity appears to be a reasonable approximation at lithospheric scales. Rheological profiles define either the tensile or the compressive stress that the lithosphere can sustain before it fails mechan- ically. Although the Alps are in an overall state of compression (e.g. Pavoni 1980), regional extensional structures throughout the mountain belt are documented by numerical models (e.g. Bott 1990 Willett 1992). Rheological profiles are, therefore, evaluated for both compressional and extensional regimes.
The construction of strength envelopes requires knowledge of temperature, lithospheric material distribution, correspond- ing flow parameters and strain rate. Temperature-depth distri- butions are given by the present-day temperature field as modelled by Okaya et al. (1996, Fig. 13).
Rheological models of the continental crust consist com- monly of two or three layers of different rock types (e.g. Ranalli
& Murphy 1987; Ord & Hobbs 1989; Braun & Beaumont
1989; Ranalli 1991) assuming a decrease in silica content with increasing depth. The crustal structure beneath the Molasse Basin and the northern border of the Swiss Alps (Fig. 2b) is characterized by low-velocity zones at upper- and mid-crustal levels (Maurer & Ansorge 1992; Mueller 1990; Mueller et al. 1987), which can be associated with well-conducting electrical layers (Schnegg & Fischer 1989). These zones of weakness favour detachment and support the existence of a crustal structure built up in the classical way with an upper-middle- lower crustal layering. Because this three-layered crustal struc- ture is also observed for the Lepontine and Southern Alps (Mueller 1990), we adopt a four-layer lithosphere consisting of an upper, middle and lower crust and the mantle lithosphere. Although a unique correlation does not exist, a first-order petrological classification of the continental crust can be derived from seismic P-wave velocities and densities (Table 1). Accordingly, we assume an upper crust composed of felsic rocks, a middle crust composed of intermediate rocks, a lower crust composed of mafic rocks and a mantle lithosphere composed of ultramafic rocks. Apart from composition the mechanical behaviour is also influenced by the presence of fluids, i.e. wet and dry rheologies with wet conditions leading in general to a reduction in strength (e.g. Kirby 1984).
The geometries and compositions of the individual litho- logical layers along the profile are derived from the density model (Holliger & Kissling 1992) and the deep seismic image
(Ye & Ansorge 1990) using the classification given in Table 1.
To identify the composition of the upper-, middle- and lower- crustal layers we refer in the seismic section to the P-wave velocities of 5.9-6.15 km s-', 6.2 km s-l and 6.5-6.6 km s-'
(Fig. 2a). The lithological structure of the European crust north and south of the southern Lepontine is chosen according to the density model (Fig. 2c), although the density structure
402
N.
Okaya, S . Cloetingh and St. MuellerS
Po Basin Tabular Molasse Helvetic Aar Perninic Southern(a)
N
Jura Basin Nappes Massif Nappes IL Alps
F E D M 1 M 2
c
0 10 20E
30 405
n a 5 0 60 70 80 h Y v -u-m
-150 -1 00 -50 0 50 100 150 200 250 distance (km)(c)
(b)
0 1996 RAS, G J I 127, 399-414Lithospheric cross-section, Swiss Alps-II 403
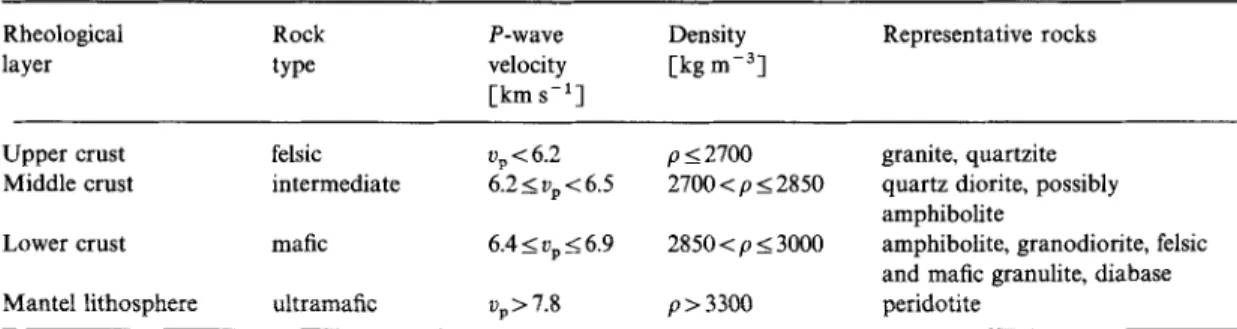
Table 1. Petrological classification-terminology after Ranalli ( 1991 b o f the continental lithosphere on the basis of seismic P-wave velocities and densities (after Meissner 1986; Holbrook, Mooney & Christensen 1992; Christensen &
Mooney 1995).
~ ~
Rheological Rock P-wave Density Representative rocks
layer type velocity [kg m-31
[km s-’1
Upper crust felsic up < 6.2 p I 2700 granite, quartzite
Middle crust intermediate 6.2 I up i 6.5 2700 < p I 2850 quartz diorite, possibly Lower crust mafic 6.4 I up i 6.9 2850 < p I 3000 amphibolite, granodiorite, felsic Mantel lithosphere ultramafic up > 7.8 p>3300 peridotite
amphibolite
and mafic granulite, diabase
apparently cannot be unambiguously derived from the deep seismic image. In the seismic image sharp reflectors are missing under the Molasse Basin and the External Massifs at the upper-middle crustal boundary, and under the southern Molasse Basin at the middle-lower crustal boundary. However, as already mentioned above, a crustal structure (Fig. 2b) as proposed by Holliger & Kissling (1992) is consistent with geological near-surface data and detailed seismic profiles of the crust (Maurer & Ansorge 1992; Mueller 1990; Mueller
et al. 1987). Under the southern Lepontine-in the high metamorphic core of the Alps-Holliger & Kissling (1992) interpreted the velocity layer of 6.2 km s-’ in a depth interval
of 17-20 km as a middle-crustal layer. The high-velocity layer (6.6 km s - l ) in the depth interval of 20-25 km is interpreted as thickened lower-crustal material (the ‘melange zone’) at mid-crustal levels (Roure, Polino & Nicolich 1990; Holliger
& Kissling 1992; Roure, Coukroune & Polino 1996).
Measurements on intermediate and mafic rocks document an increase in compressional-wave velocity and density with increasing metamorphic pressure (e.g. Ringwood & Green 1966; Christensen & Mooney 1995). Therefore, lithologically the ‘melange zone’ could also be interpreted as highly metamor- phosed material, i.e. amphibolite or felsic granulite in contrast
to quartz diorite. The bottom of the crust along the profile is well constrained from reflection and refraction data sets (ETH Working Group 1991) and shows a gap in the area of maximum crustal thickness under the southern Lepontine. This interrup- ted Moho is interpreted as subducted oceanic and lower- crustal material, as indicated in the deep density model of Holliger & Kissling ( 1992) (Fig. 2c).
In layered rheological models of the continental crust, different lithologies are used to construct strength profiles in view of the differences in the adopted representative depth distribution of crustal rocks. To study the influence of different rheologies on ductile strength we therefore constructed strength
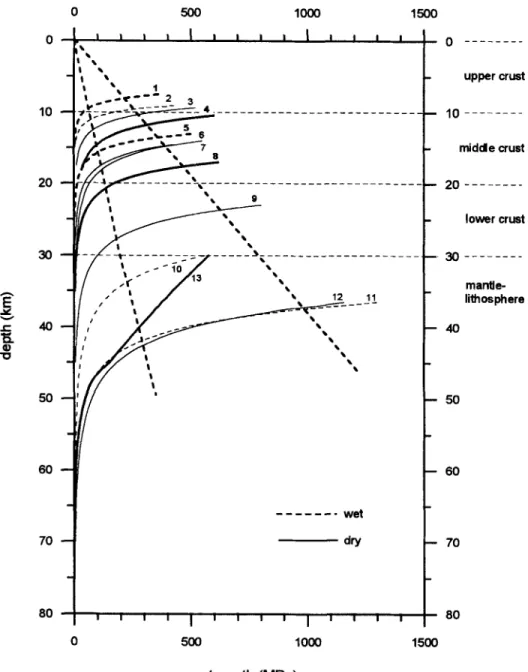
profiles for the central European reference lithosphere (Fig. 3) under the assumption of different rheologies, for which the creep parameters are given in Table 2. For the upper crust, quartzite and granite are representative rocks (Table 1). Laboratory data on the creep parameters of these rocks show strong variations (e.g. Kirby & Kronenberg 1987), and the influence on ductile strength is shown in Strehlau & Meissner (1987). In our model we adopted wet quartzite and dry granite for the upper crust, providing an upper and lower limit in ductile strength (Fig. 3). Because creep parameters of inter- mediate rocks are only available for wet quartz diorite, we assumed the middle crust to be represented by a wet quartz- dioritic rheology. For a middle crust of higher metamorphic grade-this could be the case under the southern Lepontine in the ‘melange zone’ of Holliger & Kissling (1992) (Fig. 2c)- amphibolite and felsic granulite might also be representative rocks; however, the creep parameters for these are only avail- able for dry conditions. Compared to wet quartz diorite, dry amphibolite and dry felsic granulite have slightly higher ductile strengths (Fig. 3). This difference could be due to wet and dry conditions. We assumed a wet quartz-dioritic composition for the ‘mklange zone’. Adapting dry amphibolite or dry felsic granulite would, as a result of relatively high temperatures in the ‘melange zone’, only slightly increase the ductile strength. In rheological models of the continental crust diabase is often used as a representative rock of the lower crust (e.g. Ranalli 1991; Cloetingh & Banda 1992; Bodri & Iizuka 1993; Seno &
Seito 1994; Burov & Diament 1995), whereas petrological models (Table 1) support the existence of a lower continental crust composed commonly of amphibolite and mafic granulites (Table 1). Compared to diabase, amphibolite has a lower, and mafic granulite a higher, ductile strength. Because typical P- wave velocities of mafic granulite are only reached at the base of the lower crust (X in Fig.2b), we assume a lower crust
composed of diabase; the influence of mafic granulite on lower-
Figure 2. Cross-section along the European Geotraverse (EGT) through the Swiss Alps (cf: Fig. 1). (a) The P-wave velocity-depth model of the crust derived from numerous seismic refraction profiles (after Ye & Ansorge 1990, Ye et al. 1995). B to F, M1 and M2 are EGT shot points; IL indicates the Insubric Line. The P-wave velocities shown in white script within a black box indicate the P-wave velocities for deriving the rheological layering on the basis of Table 1. (b) The detailed P-wave velocity-depth structure for the northern border zone of the Swiss Alps, where Mz is the base of the Mesozoic sediments, B is the top of crystalline basement, G is the upper-crustal low-velocity zone, C is the mid-crustal low- velocity zone, X is the sharp gradient zone in the lower crust (after Maurer & Ansorge 1992: Mueller 1990). (c) The density structure of the lithosphere based on P-wave velocities and resulting gravity modelling (after Holliger & Kissling 1992). (d) The petrological layering of the four- layer rheological model and the temperature field of the lithosphere (after Okaya et al. 1996) underlying the construction of the strength profiles. The petrological structure is derived from the deep seismic and density image; the interrupted Moho under the southern Lepontine is indicated by a dotted-line signature (cf: a and c) (see text for details). The temperature field (interval of isotherms is l00’C) is derived from transient thermal modelling; the dots indicate the bottom of the thermal lithosphere defined as the intersection point of the geotherm with the wet solidus for mantle material (after Wyllie 1987). For definitions of CE, MO, EX, RRL, LE, IL and SA, see Fig. 1.
404
N .
Okaya, S. Cloetingh and St. Mueller n E5
0 10 20 30 40 50 60 70 80 0 500 lo00 1500-
uppercrust-
m'ddecrust-
lowercrust -.30 - - - - _ _ _ _-
mantle- lithosphere - 4 0-
50-
60-
70-
80 0 500 lo00 1500 strength (MPa)Figure 3. Brittle and ductile strengths for the central European reference lithosphere under the assumption of different rheologies indicated by numbers [1: quartzite (wet); 2 granite (wet); 3: quartzite (dry); 4: granite (dry); 5: quartz diorite (wet); 6: amphibolite (dry); 7: felsic granulite (dry); 8: diabase (dry); 9: mafic granulite (dry); 10 dunite (wet); 11: dunite (dry); 12: olivine (dry) for power-law creep; 1 3 olivine (dry) for power-law creep combined with Dorn creep]. The minerals used to construct strength profiles along the European Geotraverse (EGT) through the Swiss Alps are shown with bold lines.
crustal strength is illustrated in Fig. 3. Due to the lack of creep parameters for wet mafic crustal materials we adopt only dry conditions in the lower crust. The ductile strength predicted for possible mantle materials, i.e. dunite and olivine, is shown in Fig. 3. For power-law creep (eq. 2), the ductile strength of dunite and olivine is the same; only if power-law creep (eq. 2) is combined with Dorn creep (eq. 3) does dry olivine exhibit a
smaller ductile strength. Dry olivine and wet dunite are com- monly used to represent the mantle lithosphere (Fig. 3). In our modelling we adopt dry olivine for an upper limit of ductile strength within the mantle-lithospheric layer. The influence of wet dunite on mantle-lithospheric strength is illustrated in Fig. 3.
The resulting rheological structure adopted for the construc-
tion of the strength envelopes is not unambiguous, but is nevertheless compatible with the large-scale structure and lithology along the profile. The lateral variation of strength through the Alpine collision zone would be influenced system- atically by changes in the rheology of the individual layers.
Typical estimates for geological strain rates are of the order of to 10-17s-' (Pfiffner & Ramsay 1982), where the slower rate represents an essentially rigid behaviour of the lithosphere. Estimates based on the modelled present-day lithospheric shortening rates of 6-7 mm a - l (Okaya et al. 1996, Fig. 9) and an area of horizontal deformation of about 140 km across the Alps correspond to an average Alpine strain rate of the order of 10-15s-1. Plane-strain finite-element models of compressional orogens (e.g. Beaumont et al. 1994) provide
Lithospheric cross-section, Swiss Alps-II 405
Table 2. Flow parameters used to calculate ductile strength on the basis of eqs. (2) and (3).
Rock type Flow parameters for power-law creep
N E B After
(kJ mol-') (MPa-" s - l ) FELSIC ROCKS
Quartzite (dry) 2.4 156 1.26 x Carter & Tsenn (1987) Quartzite (wet) 1.9 173 3.16 x lo-' Carter & Tsenn (1987) Granite (dry) 3.3 186 1.99 x Carter & Tsenn (1987) Granite (wet) 1.9 141 1.99 x Carter & Tsenn (1987) INTERMEDIATE ROCKS
Quartz diorite (wet) 2.4 219 3.8 x lo-' Hansen & Carter (1982) MAFIC ROCKS
Diabase (dry) 3.05 276 6.31 x lo-' Carter & Tsenn (1987) Felsic granulite (dry) 3.1 243 8.00 x Wilks & Carter (1990) Mafic granulite (dry) 4.2 445 1.40 x 10⁴ Wilks & Carter (1990) Amphibolite (dry) 3.1 244 1.70 x Hacker & Christie (1990) ULTRAMAFIC ROCKS
Dunite (dry) 3.6k0.2 535+33 3 x 10⁴ Carter & Tsenn (1987)
Dunite (wet) 4.0 f 0.8 471k38 2 103 Ranalli ( 199 1 )
Olivine (dry) 3.0 540 4.00 x lo6 Goetze & Evans (1979) Rock type Flow parameters for Dorn creep
4
EP OP Aftercs-11 [kJ mol-'
el
[MPa] ULTRAMAFIC ROCKSOlivine (dry) 5.7x loll 535 8.5 103 Goetze & Evans (1979)
evidence for a non-uniform strain-rate distribution within the orogenic crust. Strain rates are localized in the pro- and retro- wedge, with maximum values of more than s-l. Possible
variations in strain rate through the collision zone are taken into account by calculating strength envelopes for strain rates of 1 0 - l ~ to 10-14 s-1.
3 M E C H A N I C A L S T R U C T U R E T H R O U G H T H E A L P I N E COLLISION BELT
Based on the procedure and assumptions described above we constructed strength envelopes for different sites along the EGT through the Swiss Alps: the central European reference structure, the Molasse Basin, the External Massifs, the northern and southern Lepontine and the Southern Alps (Fig. 2). The
central European reference structure has been chosen for reference purposes to investigate lateral changes of the mechan- ical state through the mountain range.
3.1
For the petrological structure shown in Fig. 2(d) (left-hand side) we evaluated strength profiles for the rheological layering shown in Fig. 3 assuming an average strain rate of s-'.
Inspection of the strength profiles calculated along the EGT (Fig.4) shows pronounced changes with depth, as well as laterally from north to south through the Alpine collision zone. For all sites upper-crustal strength is essentially in the brittle domain, with cut-off depths of brittle strength at about the same depth along the entire profile. In a compressional regime a wet and dry felsic upper crust in combination with a wet intermediate middle crust predicts cut-off depths of about
Strength profiles for wet and dry rheologies
10 and 12.5 km, respectively, with slightly smaller values for
the Lepontine. An extensional regime yields cut-off depths that are 2 to 3 km deeper. Accordingly, upper-crustal temperatures
controlling the depth of the brittle-ductile transition do not vary enough to produce a pronounced depth variation in the brittle-ductile transition from north to south. A wet felsic upper crust in combination with a wet intermediate middle crust results in a minimum in ductile strength at the base of the upper crust. This horizon of possible detachment vanishes under the assumption of a dry felsic upper crust. Middle- and lower-crustal strength is purely ductile except for the central European reference structure and the Southern Alps. There, a brittle layer is predicted at mid-crustal levels, which is primarily the result of a petrological change from felsic to intermediate material at a shallow depth of 10 km, rather than being due
to a horizontal temperature gradient. Middle- and lower- crustal creep strength decreases systematically from the north- ern to the central part of the mountain belt up to the Insubric Line, with almost no strength left under the southern Lepontine. South of the Insubric Line, under the Southern Alps, the middle- and lower-crustal strength increases again. North and south of the Lepontine a minor jump in creep strength occurs at the bottom of the middle crust, while in the Lepontine, the core of the mountain belt, this discontinuity is less significant. Accordingly, decoupling of the middle and lower crust is only predicted for areas outside the core of the mountain belt. In the mantle-lithospheric layer no brittle strength is predicted under compression. However, under extension a brittle layer forms stretching from the Molasse Basin as far south as the northern Lepontine. The thickness of this layer decreases slightly from north to south. South of the Insubric Line, relatively low mantle-lithospheric tem-
406
N .
Okaya, S. Cloetinghand
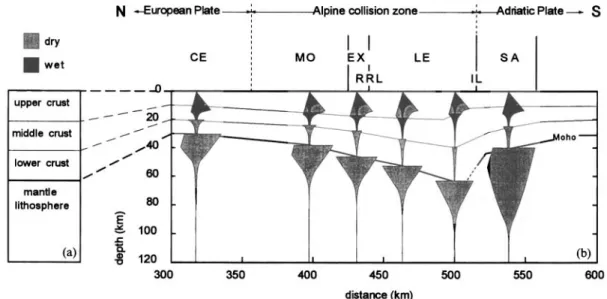
St. MuellerFigure 4. Strength profiles for selected sites along the European Geotraverse (EGT) to investigate the influence of wet and dry rheologies. (a) and
(b) can he linked through depth. (a) The petrological layering of the lithosphere. Black and grey refer to wet and dry rheologies, respectively. (b) Strength profiles shown together with the petrological structure used along the profile (c$ Fig. 2c). Strength profiles are calculated for both compressional (right branch) and extensional (left branch) environments assuming an average strain rate of s-’. Black and grey shaded areas
correspond to wet and dry rheologies, respectively. The interrupted Moho under the southern Lepontine (c$ Figs 2a and b) is indicated by a dotted
line. For definitions of CE, MO, EX, RRL, LE, IL and SA, see Figs 1 and 2.
peratures, in combination with a normal crustal thickness of 35 km, lead to a considerable strengthening of the mantle- lithospheric layer.
Compared to the strength profile of the central European reference structure the model predicts a clear reduction of average strength in the crustal layer and a minor weakening of the mantle-lithospheric layer. In the crust the weakening is due to the thickening of the crustal layers and the resulting heating of middle- and lower-crustal rocks. Temperature vari- ations in the mantle-lithospheric layer, which are more pro- nounced than in the crustal layer, are the main component causing the change in strength from north to south.
3.2 Integrated lithospheric strength
The lateral characteristics of the mechanical properties of the lithosphere through the Alps can be studied in terms of the total yield stress
EL
of the lithosphere, which is obtained by numerical integration of the strength profiles (al -a3) over the entire lithospheric thickness zL:Z L
&=s,
(a1-addz (4)(Artyushkov 1973).
EL
corresponds to the horizontal devi- atoric force, per unit horizontal length, required to cause inelastic lithospheric extension or compression.s - l (Fig. 4) we evaluated the integrated strength for the rheological models with dry and wet upper-crustal layers (Fig. 4) in a compressional environment (Fig. 5). For the central European reference lithosphere we obtain an integrated lithospheric strength of about 11 x lo1‘ N m-’ with nearly no difference for wet and dry upper crusts (Fig. 5b). Under the Molasse Basin and southwards as far as the southern Lepontine this value decreases slightly to about 8.5 x 10” N m-’ and 6.5 x 10” N m - l for dry and wet upper crusts, respectively.
Based on the strength envelopes for a strain rate of
South of the Insubric Line, under the Southern Alps, the total lithospheric strength increases again to about 25 x lo1’ N m-l with no significant difference for wet and dry upper-crustal rheologies. A better resolution of the total strength within the lithosphere is obtained by analysing the contribution due to the different rheological layers, i.e. the crust and the mantle lithosphere. These values are obtained by integration over the thickness of the rheological layer considered. A comparison of the crustal and mantle-lithospheric integrated strength (Fig. 5b) shows that the mantle-lithospheric part follows the pattern of the integrated lithospheric strength and yields the main contri- bution to it, while on a lithospheric scale the crustal component exhibits a more or less constant lateral distribution. For a wet upper-crustal rheology a poorly developed minimum in inte- grated crustal strength is predicted under the southern Lepontine, while a dry upper-crustal rheology leads to a maximum in the northern Lepontine (Fig. 5b). The contri- butions from the upper-, middle- and lower-crustal layers (Fig. 5c) clearly show that for a wet upper-crustal rheology the weakening of the crust towards the core of the mountain belt results mainly from the middle-crustal layer, whereas for a dry upper-crustal rheology the strengthening results mainly from the upper-crustal layer. The integrated strength in the middle crust shows a significant reduction from the Molasse Basin to the southern Lepontine, and a subsequent increase in the Southern Alps. The lower-crustal layer yields a more or less constant contribution to the integrated crustal strength. For central Europe the major contribution to the integrated crustal strength results from the mid-crustal layer and the smallest from the lower-crustal layer. In contrast, in the core of the mountain belt the major contribution results from the upper-crustal layer; the mid-crustal layer only contributes a minor amount of strength. A comparison of the compressional and extensional
integrated strengths is shown in Fig. 5(d). For an extensional regime the model predicts smaller values, which are about
3 x 10”Nm-’ less for the entire lithosphere and about 0 1996 RAS, G J I 127, 399-414
Lithospheric cross-section,
Swiss
Alps-11407
. . 300 350 400!
I .!450 5005s0
600 . . , .. .
, . . . . . . . 300 350 400 450 500 550 600distance
(km)Figure 5. Comparison of the thermal and mechanical structure along the European Geotraverse (EGT). For definitions of CE, MO, EX, RRL,
LE, IL and SA, see Figs 1 and 2. (a) Present-day surface heat flow derived from transient thermal modelling (after Okaya et al. 1996). (b) Integrated
lithospheric strength versus distance and the contributions of the crustal and mantle-lithospheric layers derived from the compressional strength envelopes shown in Fig. 4( b). Wet and dry refer to rheological models with wet and dry upper-crustal layers, respectively (cf: Fig. 4a). (c) Contributions to the integrated crustal strength from the upper- (wet and dry), middle- and lower-crustal layers. The sum of the components gives the integrated wet and dry crustal strengths shown in (b). (d) Integrated lithospheric strength versus distance and the contributions of the crustal and mantle-
lithospheric layers derived from the compressional (comp) and extensional (ext) strength envelopes for a dry rheology (cf: Fig. 4b).
408 N . Okaya, S . Cloetingh and St. Mueller
1.5 x 10" N m-I for the mantle lithosphere and the crust. In the core of the mountain belt the integrated strength exhibits no differences between extension and compression for the mantle lithosphere because strength is essentially ductile there.
Often strength profiles are constructed on the basis of steady-state thermal models, which are parametrized via the surface heat flow and, therefore, show a uniform increase of temperature with depth (e.g. Fadaie & Ranalli 1990). These models exhibit a close correlation between surface heat flow and integrated strength, describing a general strengthening with decreasing surface heat flow. Our results predict that the pattern of the integrated strength resulting from the different petrological layers, i.e. the upper, middle and lower crust and the mantle lithosphere, is not reflected in a simple way in the surface heat flow. The maximum of the surface heat flow in the southern Lepontine coincides with the weak minimum in integrated lithospheric strength, while the remaining pattern of the surface heat flow shows no correlation (cf: Figs 5a and b).
3.3 Variation in strain rate
Strain rates through the orogenic belt are not necessarily constant, as documented by finite-element models (e.g. Willett
1992; Beaumont et al. 1994). We have studied this effect by
varying the strain rate by two orders of magnitude between and 10-'6s-' (Figs 6a and b). At the borders of the mountain belt-under the Molasse Basin, the External Massifs and the Southern Alps-an increase in strain rate results in a pronounced strengthening in all petrological layers. Under extension a high strain rate of lO-l4s-' even favours the formation of additional brittle layers in the middle crust, while under compression no further brittle layers are formed. In contrast, in the core of the mountain belt-under the Lepontine-an increase in strain rate leads to a less pro- nounced strengthening. A dry upper-crustal rheology welds the upper- and middle-crustal layers together, favouring a possible detachment only at the top of the lower crust and at the crust-mantle boundary (Mueller 1990, 1991) (Fig. 6a).
3.4 Mechanically strong mantle lithosphere and crust Strength profiles as shown in Figs 4 and 6 allow the identifi- cation of the mechanically strong upper part of the lithosphere (MSL). Assuming a critical strength value of 50 MPa (e.g. McNutt 1984; Cloetingh & Banda 1992), the depth of the
distance (km)
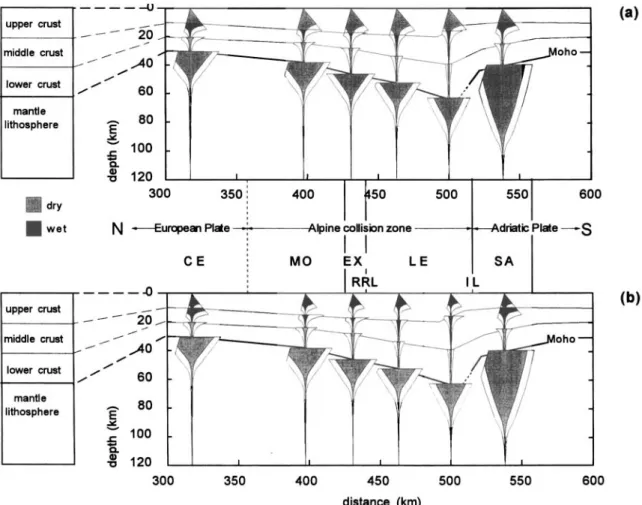
Figure 6 . Strength profiles for selected sites along the European Geotraverse (EGT) to investigate the influence of a change in strain rate. For definitions of CE, MO, EX, RRL, LE, IL and SA see Figs 1 and 2. (a) Strength profiles constructed for both compressional (right branch) and extensional (left branch) environments and a strain rate of s - l (in white) using the petrological model with a dry
upper-crustal rheology (cf: left panel) shown along with the petrological structure (c$ Fig. 2c). (b) Strength profiles constructed for both compressional (right branch) and extensional (left branch) environments and a strain rate of s- (in black and grey, respectively) and s-' (in white) using the petrological model with a wet upper-crustal rheology (cf: left panel) shown along with the petrological structure
(cf Fig. 2c).
s - l (in grey) and
Lithospheric cross-section, Swiss Alps-II 409 MSL is reached within the mantle-lithospheric layer (Fig. 7b).
From north to south a general trend can be recognised with an increase in the thickness of the MSL that extends to a depth of 60 km under the Molasse Basin and reaches a depth of 95 km under the Southern Alps. An increase or decrease in strain rate by a factor of 10 results in a thickening or thinning
of about 5 km. The critical strength of 50 MPa is also reached within the crust and leads to the separation of several strong crustal layers. For an average Alpine strain rate of s - l
the bottom of the mechanically strong crust (MSC) (Fig. 7b)
shows a lateral trend with a slight southward thickening from the Molasse Basin towards the northern Lepontine from about
distance
(km)
Figure 7. (a) Focal depths of earthquakes along the Basel-Chiasso traverse (after Deichmann & Baer 1990) and the depth of the crust-mantle
boundary (modified after Mueller et al. 1980; Maurer & Ansorge 1992). (b) Thickness of the mechanically strong lithospheric layers MSL/MSC along the European Geotraverse (EGT) shown along with the lithological layering (cf. Fig. 2d) and the present-day temperature field (interval of isotherms is 100°C) (after Okaya et al. 1996). The mechanically strong layers refer to that part of the lithosphere with strength values higher than 50 MPa, which are derived from the strength envelopes shown in Fig. 4(b). Black, grey and white shaded areas correspond to strain rates B of 10-16~-1 10-15 s - 1 and s-',
respectively. For definitions of CE, MO, EX, RRL, LE, IL and SA, see Figs 1 and 2.
410 N . Okaya, S. Cloetingh and St. Mueller
27 km to 36 km, a subsequent thinning to about 18 km under the southern Lepontine, and another thickening to about 28 km beneath the Southern Alps. In the core of the mountain belt an increase or decrease in strain rate shifts the bottom of the MSC, although not as systematically as in the case of the MSL, to higher or lower values, respectively (Fig. 7b). Compared to the mechanically strong crustal layers formed for an average Alpine strain rate of s-', a smaller strain rate of s-' results in the almost complete vanishing of the mechanically strong upper parts of the middle and lower crust. A higher strain rate of 10-14s-' leads to a general thickening and the formation of an additional mechanically strong layer in the upper part of the lower crust. This is due to a combined effect of temperature gradient, strain rate and petrological layering. Because the temperature gradient in the middle and lower crust is smaller, compared to the northern Alpine foreland, and the strength in the middle and upper crust has already reached a very small value close to the critical value of 50 MPa, the bottom of the MSC is very easily shifted to a lower or higher crustal layer by an increase or decrease of strain rate by a factor of 10.
The bottom of the MSL follows the pattern of an isotherm because the assumed rheological laws for ductile strength account only for the temperature dependence. In the case of dry olivine and dry dunite the critical strength of 50 MPa is reached at about the same temperatures of 750-800°C
(Fig. 7b); in the case of wet dunite it is reached at slightly lower temperatures of 700-750 "C (Fig. 3). Within the crust the 30MOO "C isotherm has been proposed to reflect the bottom of the mechanically strong crust (Cloetingh & Banda 1992). For strain-rate values of to s - l a compari- son of the MSC with the thermal structure (Fig. 7b) shows that at the borders of the mountain range the bottom of the MSC varies within the range of the 400-500 "C isotherm, while in the core of the mountain belt the bottom of the MSC varies within the range of the 300-500°C isotherm. A lower crust composed of mafic granulite would shift the bottom of the MSC to temperatures of about 550 "C (Figs 2d and 3).
3.5 Comparison with the depth distribution of seismicity
An independent test on the proposed rheological profiles is provided by the variation of seismicity with depth. The observed seismicity is distributed over the entire crust under the Molasse Basin and the Southern Alps; under the External Massifs the cut-off depth of seismicity is reached at mid-crustal to lower-crustal levels, and under the Lepontine it exhibits its shallowest depths at mid-crustal levels of about 15-20 km depth (Deichmann & Baer 1990) (Fig. 7a).
If earthquakes are considered to be brittle fracture phen- omena the depth distribution of foci should approximately coincide with the brittle layer. In this case, according to our model predictions (see Figs 4 and 6), earthquakes along the profile should only be observed within the upper 10 km to 15 km, which obviously does not agree with the observations (Fig. 7a). Considering that instabilities of plastic deformation can occur in ductile flow (Ord & Hobbs 1989), brittleness and seismicity do not have to correspond under all circumstances. An upper limit of that part of the lithosphere that has sufficient ductile strength to allow the build-up and relaxation of stress could be postulated to coincide with the bottom of the mechanically strong crust (Fig. 7b). Qualitatively, the bottom
of the mechanically strong crust in our model reflects the seismicity trend, i.e. an overall stronger crust under the Molasse Basin and the Southern Alps and only a relatively strong upper to middle crust under the Lepontine (Fig. 7b). A decrease in strain rate from the foreland to the core of the mountain belt yields an even better correlation with the observed pattern of the cut-off depth of seismicity. Plane-strain finite-element modelling gives indications of a non-uniform strain-rate dis- tribution with a concentration of high strain rates in the pro- and retro-wedge (e.g. Beaumont et al. 1994).
Although the mantle lithosphere exhibits, in comparison to the crust, a relatively high strength (c$ Figs 4 and 6), no seismicity is observed there. This, in combination with the minimum in strength at the crust-mantle boundary, indicates that the applied stress leads to a two-layered response of the lithosphere with a concentration of the deformation in the crustal part (Kusznir & Park 1984).
3.6 Equivalent elastic thickness
The concept of a uniform elastic plate decoupled from the underlying medium has been quite useful as a first-order description of the thickness of that part of the lithosphere that has the potential to accumulate tectonic stress. An upper limit for the effective elastic thickness (EET) can be derived from the mechanically strong crustal and lithospheric layers. For crust-mantle coupling the EET is defined by the following relation:
n
E E T = C h i ( 5 )
i = l
(e.g. Burov & Diament 1995), whereas for crust-mantle decoup- ling the EET is given by:
(e.g. Burov & Diament 1995), where n is the number of the mechanically strong layers and hi is the thickness of each layer. EET values predicted for crust-mantle coupling give a value of about 40 km for central Europe, with a slight increase under the Molasse Basin and a subsequent slight decrease in the Lepontine (Fig. 8a). South of the Insubric Line the EET reaches a very high value of 76 km. The thickness of the EET is mainly determined by the strongest layer, i.e. the mantle lithosphere. Consequently, within the mountain belt wet and dry upper-crustal rheologies yield differences in the EET only of the order of a few kilometres. Crust-mantle decoupling leads to an EET reduction of about 1/3 (Fig. 8a). For the Southern Alps we considered a further possibility, where decoupling occurs, in addition to the crust-mantle boundary, at the contact zone of the European and Adriatic mantle lithosphere ('Southern Alpine mantle lithosphere' in Fig. 2c). Indications for this are provided by tomographic results (Spakman 1990a, b) and structural geological constraints (e.g. Laubscher &
Bernoulli 1982; Pfiffner 1992), which give evidence for some lower-crustal material of the European plate being subducted to greater depths. In the construction of the strength envelopes we assumed that the crustal slab has a mafic composition like the lower crust (Fig. 8b). This scenario leads to a further decrease of the EET value to 34 km. In the upper mantle P- wave velocities are 8.2 km s-' beneath the Molasse Basin and the Lepontine, and 7.9 km s-' beneath the Southern Alps. 0 1996 RAS, GJI 127, 399-414
Lithospheric cross-section, Swiss Alps-II 41 1
Figure& (a) Pattern of the bottom of the equivalent elastic plate EET along the European Geotraverse (EGT) in comparison with flexural modelling results and the present-day temperature field (interval of isotherms is 100°C) (after Okaya et al. 1996). Wet and dry refer to EET values
that are derived from strength envelopes using rheological models with wet and dry upper crusts (cf: Fig. 4). The shaded area shows the crust according to the petrological model ( c t Fig. 2c). Numbers indicate references to flexural modelling results. 1: Karner & Watts (1983); 2: Lyon- Caen & Molnar (1989); 3: Sinclair et al. (1991); 4 Royden ( 1993). For definitions of CE, MO, EX, RRL, LE, IL and SA see Figs 1 and 2.
(b) Strength profile for the Southern Alps according to the strength profile shown in Fig. 4(a), but for a petrological structure where the European lower-crustal material is subducted to depth ( c j Fig. 2c). For definitions of LE, IL and SA see Figs 1 and 2.
Dehydration of the subducted oceanic and lower continental crust-an ongoing process for about a few tens of Myr- could result in a highly hydrated Adriatic mantle lithosphere. Laboratory measurements show a considerable reduction in P-wave velocities with fluid content. A wet dunitic composition of the Adriatic mantle lithosphere would not significantly influence the results described above, as shown in Fig. 8( b). For the European lithosphere our predictions are in agreement with the results from flexural modelling in the north, which give scattered values of the EET ranging from 10 km to up to 50 km (Karner & Watts 1983; Lyon-Caen & Molnar 1989; Sinclair et al. 1991; Royden 1993) (Fig. 8a). In contrast, the value for the Southern Alps differs considerably from flexural modelling, which gives an EET of 15 km (Royden 1993).
4 D I S C U S S I O N A N D C O N C L U S I O N S
In this paper we have investigated the mechanical structure of the lithosphere along the EGT through the Alpine collision belt by constructing strength profiles as a function of depth. The results of this model demonstrate that the asymmetric geometry of the tectonic and thermal setting along the profile
(Fig. 2) is also reflected in the mechanical structure. Within the crust, strength is controlled by the complex interaction of
the petrological and thermal structure; both parameters seem to be equally important. Outside the mountain belt, strain- rate variations between and s-' show a systematic
effect on the mechanical structure, i.e. on the integrated strength (Fig. 5), the effective elastic thickness (EET) (Fig. 8a), the
mechanically strong lithosphere (MSL) and the mechanically strong crust (MSC) (Fig. 7b). In contrast, inside the mountain belt, strain-rate variations shift the bottom of the MSC over a
considerable depth interval from middle- to lower-crustal level. Thus, within the crustal collision zone the strain-rate distri- bution plays as important a role as the petrological and thermal structure.
Often the mechanical structure is thought to be directly reflected in the thermal structure (e.g. Chapman & Pollack
1977; Ranalli 1991; Cloetingh & Banda 1992). This concept has been quite useful for the oceanic lithosphere. However, it does not always hold for the continental lithosphere (Burov
& Diament 1992; Burov & Diament 1995; Cloetingh & Burov
1996). The results of our model predict that the mechanically
strong crust (MSC) is not simply related to the thermal
412 N . Okaya, S. Cloetingh and St. Mueller
structure, as demonstrated by comparison of the MSC with crustal isotherms between 300 and 500 "C and the surface heat
flow. Compared to the MSC and MSL estimates derived by Cloetingh & Banda (1992) the values of the MSC in central Europe and the Molasse Basin are generally in good agreement, but our estimates for the Molasse Basin give somewhat higher values. In contrast, the results of Cloetingh & Banda (1992) postulate a weak mantle lithosphere in the area of the External Massifs, whereas our model predicts a much stronger mantle lithosphere due to lower temperatures. This demonstrates that in active continent-continent collision zones a steady-state approximation of the thermal structure, which is parametrized via the surface heat flow, is not accurate enough to resolve the pattern of the deep mechanical structure.
The cut-off depth of seismicity along the profile deviating from the 30@400 "C isotherm largely follows the lower bound-
ary of the MSC for strain rates of s-l and less. However, the detailed seismicity-depth distribution, in particular the seismic activity close to the crust-mantle boundary under the Molasse Basin and the comparable high seismic activity in the upper crust under the Lepontine (Deichmann & Baer 1990), cannot be fully explained by our model. Local variations in fluids, strain rate, extensional and compressional stress regimes, and the detailed petrological structure-parameters, which cannot, as yet, be unambiguously constrained by data, and, therefore, are ignored in our model-could have a strong control on the fine structure of the strength profiles. Finite- element modelling (e.g. Bott 1990) documents that an asymmet- ric mountain belt such as the Alps is characterized by regions of both extensional and compressional stresses. Furthermore, plane-strain finite-element models with basal velocity boundary conditions document a non-uniform distribution of strain rate in collision zones (e.g. Willett 1992; Beaumont et al. 1994). A comparison to, and link with, dynamical modelling results, i.e. the depth distribution of strain rate and the lateral variation of extensional and compressional stresses, could be a next step in the more detailed investigation of the mechanical structure of the crust based on strength profiles. However, this requires the different models to be set up with compatible parameters, i.e. the corresponding petrological layering has to be the same. Apart from these uncertainties, seismic activity can not be explained in terms of strength distribution alone. Moreover, strength in combination with the acting stress indicates where the critical strength is exceeded and the material breaks.
The integrated strength exerts a strong control on the location of post-orogenic collapse and rifting. A comparison of the results of our model indicates a slight weakening in the core of the mountain belt, which is consistent with previous modelling studies of mountain belts, e.g. the Canadian Cordillera (Ranalli & Murphy 1987) and the Betic Cordillera (Cloetingh et al. 1992). A comparison of these results suggests that the internal parts of the Alps are weaker than the core of the Canadian Cordilleras but stronger than the core of the Betics.
The inferred EET for the Molasse Basin-about 40 km for
crust-mantle coupling and about 23 km for crust-mantle decoupling-is in agreement with flexural modelling results, which yield values between 10 km and 50 km (Karner & Watts 1983; Lyon-Caen & Molnar 1989; Sinclair et al. 1991; Royden 1993) (Fig. 8a). In contrast, for the Southern Alps we predict an EET value of about 76 km for crust-mantle coupling, 55 km for crust-mantle decoupling and 34 km for an additional
decoupling at the contact zone of the European and Adriatic mantle lithosphere. These values deviate from flexural-analysis results predicting an EET value of only 15 km (Royden 1993). Our EET values are derived from strength profiles and describe-though based on transient thermal modelling results-the steady-state mechanical structure. However, flex- ural bending stresses, non-linear flexure and high levels of regional horizontal stresses, as probably occur in the Alps (Mueller, Egloff & Ansorge 1976), can reduce the EET value by 30 to 80 per cent (Burov & Diament 1995).
Furthermore, EET values derived from flexural analysis and strength envelopes show a systematic discrepancy that might be due to the fact that the EET, as such, is more a conceptual than a properly defined geophysical parameter (Burov &
Diament 1995). According to our thermal model, the Adriatic lithosphere should be much stiffer than the European litho- sphere (Fig. 2d), a conclusion that contradicts the results of flexural analysis. Royden (1993) calculated a larger EET value for the European lithosphere than for the Adriatic lithosphere. A clear-cut answer to this inconsistency cannot be given on the basis of our model. With regard to flexural modelling of the Adriatic lithosphere, it should be noted that the Southern Alps are located in a complex tectonic setting at a plate boundary. The forces and bending moments that act at the end of the flexed plate depend on the interaction at the complex contact of the European and Adriatic plates. Furthermore, the multiple brittle-ductile layering of the continental crust sup- ports possible decoupling processes that might relate to more than one EET value depending on the nature of the tectonic loading, as for example (sub)surface loading on the basement and crustal loading on the mantle lithosphere. The temperature field underlying our model might predict temperatures that are too low, and consequently yields EET values for the Adriatic plate that are too high. P-wave velocities of the mantle lithosphere (Fig. 2a) give an indication that temperatures in the upper mantle of the Adriatic plate, i.e. beneath the Southern Alps, are higher than in the upper mantle of the European plate. Higher temperatures in the upper mantle beneath the Southern Alps could result from a slow-down in subduction within the Alpine collision zone several Myr ago leading to a relaxation of the temperature field. The lower P-wave velocities in the Adriatic mantle could result from dehydration of the subducted oceanic and lower European crust, leading to a highly hydrated Adriatic mantle wedge. Furthermore, the different lithologies of the Adriatic and European plates could also contribute to an explanation of the observed P-wave velocities; indications for a different petrology are at least apparent for the crustal part (Mueller et al. 1976; Mueller 1982).
Our results illustrate that the concept of strength envelopes, along with a detailed knowledge of the thermal and petrological structure, yields a useful first-order approximation for the investigation of the mechanical structure of the upper part of the lithosphere in continent-continent collision zones. A C K N O W L E D G M E N T S
G. Bertotti and W. Mooney are gratefully thanked for useful discussions and suggestions. J. D. van Wees provided the strength calculation code. We benefited from constructive reviews of F. Roure, F. Neubauer and three anonymous reviewers. This research was supported by the Integrated Basin Study Project (contract JOU2-CT 92-01 10). This 0 1996 RAS, G J I 127, 399-414
Lithospheric cross-section, Swiss Alps-II 41 3
is Netherlands Research School of Sedimentary Geology Publication No. 960901, and contribution No. 927, Institute of
Geophysics, ETH Zurich, Switzerland.
REFERENCES
Artyushkov, E.V., 1973. Stresses in the lithosphere caused by crustal thickness inhomogeneities, J. geophys. Res., 78, 7675-7708. Beaumont, C., Fullsack, Ph. & Hamilton, J., 1994. Styles of crustal
deformation in compressional orogens caused by subduction of the underlying lithosphere, Tectonophysics, 232, 119-132.
Bodri, B. & Iizuka, S., 1993. Earthquake cutoff depth as a possible geothermometer-application to central Japan, Tectonophysics 225, 63-78.
Bott, M.H.P., 1990. Stress distribution and plate boundary forces associated with collision mountain ranges, Tectonophysics, 182, Braun, J. & Beaumont, C., 1989. A physical explanation of the relationship between flank-uplift and breakup unconformity at passive continental margins, Geology, 17, 760-764.
Brace, W.F. & Kohlstedt, D.L., 1980. Limits on lithospheric stress imposed by laboratory experiments, J. geophys. Res., 85,6248-6252. Burov, E.B. & Diament, M., 1992. Flexure of the continental litho-
sphere with multilayered rheology, Geophys. J . Int., 109, 449-468. Burov, E.B. & Diament, M., 1995. The eEective elastic thickness (Te)
of the continental lithosphere: what does it really mean? (Constraints from rheology, topography and gravity), J. geophys. Res., 100, Carter, N. & Tsenn, M.C., 1987. Flow properties of the continental
lithosphere, Tectonophysics, 136, 27-63.
Chapman, D.S. & Pollack, H.N., 1977. On the regional variation of the heat flow, geotherms, and lithospheric thickness, Tectonophysics, 38,279-296.
Christensen, N.I. & Mooney, W.D., 1995. Seismic velocity structure and composition of the continental crust: a global view, J. geophys. Rex, 100, 9761-9788.
Cloetingh, S. & Banda, E., 1992. Europe’s lithosphere-physical properties: mechanical structure, in A Continent Revealed: The European Geotraverse, pp. 80-91, eds Blundell, D., Freeman, R. & Mueller, St., Cambridge University Press, Cambridge.
Cloetingh, S. & Burov, E.B., 1996. Thermo-mechanical structure of the European continental lithosphere: constraints from rheological profiles and EET estimates, Geophys. J. Int., 124, 695-723. Cloetingh, S., van der Beek, P.A., van Rees, D., Roep, Th.B.,
Biermann, C. & Stephenson, R.A., 1992. Flexural interaction and the dynamics of Neogene extensional basin formation in the Alboran-Betic region, Geo-Marine Lett., 12, 66-75.
Coward, M. & Dietrich, D., 1989. Alpine tectonics-an overview, in Alpine Tectonics, eds. Coward, M.P., Dietrich, D. & Park, R.G., Geol. SOC. Spec. Publ., 45, 353-367.
Deichmann, N., 1990. Seismizitat der Nordschweiz, 1987-1989, und Auswertung der Erdbeben von Gunsberg, Laufelfingen und Zeglingen, NAGRA, Technischer Bericht, 90-46, 52.
Deichmann, N. & Baer, M., 1990. Earthquake focal depths below the Alps and northern Alpine foreland of Switzerland, in The European Geotraverse: Integrative Studies, pp. 277-288, eds Freeman, R., Giese, P. & Mueller, St., European Science Foundation, Strasbourg, France.
ETH Working Group, 1991. Integrated analysis of seismic normal incidence and wide-angle reflection measurements across the Eastern Swiss Alps, Geodyn. Ser., Am. geophys. Un., 22, 195-206.
Fadaie, K. & Ranalli, G., 1990. Rheology of the lithosphere in the East African Rift system, Geophys. J. Int., 102, 44-453.
Goetze, C. & Evans, B., 1979. Stress and temperature in the bending lithosphere as constrained by experimental rock mechanics, Geophys. J. R. astr. Soc.. 59, 463-478.
Hacker, B.R. & Christie, J.M., 1990. Brittle/ductile and plastic/cataclas- 193-209.
3905-3927.
tic transition in experimentally deformed and metamorphosed amphibolite, in The Brittle-Ductile Transition in Rocks, eds. Duba, A., Durham, W., Handin, J. & Wang, H., Am. geophys. Un. Monogr., 56, 127-147.
Hansen, F.D. & Carter, N.L., 1982. Creep of selected crustal rocks at 1000 MPa, EOS, Trans. Am. geophys. Un., 63, 437, (abstract). Holbrook, W.S., Mooney, W.D. & Christensen, N.I., 1992. The seismic
velocity structure of the deep continental crust, in Continental Lower Crust, pp. 1-43, eds Fountain, D.M., Arculus, R. & Kay, R.W., Elsevier, Amsterdam.
Holliger, K. & Kissling, E., 1992. Gravity interpretation of a unified 2-D acoustic image of the central Alpine collision zone, Geophys. J. Int., 111, 213-225.
Karner, G.D. & Watts, A.B., 1983. Gravity anomalies and flexure of the lithosphere at mountain ranges, J. geophys. Res., 88, Kirby, S.H., 1984. Introduction and digest to the special issue of
chemical effect of water on the deformation and strength of rocks, J . geophys. Res., 89, 3991-3995.
Kirby, S.H. & Kronenberg, A.K., 1987. Rheology of the lithosphere: Selected topics, Rev. Geophys., 25, 1219-1244.
Kusznir, N.J. & Park, R.G., 1984. The extensional strength of the continental lithosphere: its dependence on geothermal gradient, and crustal composition and thickness, in Continental Extensional Tectonics, eds. Coward, M.P., Dewey, J.F. & Hancock, P.L., Geol. Soc. Spec. Publ., 28, 35-52.
Laubscher, H. & Bernoulli, D., 1982. History and deformation of the Alps, in Mountain Building Processes, pp. 169-180, ed. Hsii, K.J., Academic Press, London.
Lyon-Caen, H. & Molnar, P., 1989. Constraints on the deep structure and dynamic processes beneath the Alps and adjacent regions from an analysis of gravity anomalies, Geophys. J. Int., 99, 19-32. Maurer, H. & Ansorge, J., 1992. Crustal structure beneath the northern
margin of the Swiss Alps, Tectonophysics, 207, 165-181.
McNutt, M.K., 1984. Lithospheric flexure and thermal anomalies, J . geophys. Rex, 89, 11 180-11 194.
Meissner, R., 1986. The continental crust-A geophysical approach, Int. Geophys. Ser., 34, 426, Academic Press, Orlando, Florida. Mueller, St., 1982. Deep structure and recent dynamics of the Alps, in
Mountain Building Processes, pp. 189-199, ed. Hsii, K.J., Academic Press, London.
Mueller, St., 1990. Intracrustal detachment and wedging along a detailed cross section in Central Europe, in Exposed Cross-Sections of the Continental Crust, pp. 623-643, eds Salisburry, M.H. &
Fountain, D.M., Kluwer, Dordrecht, the Netherlands.
Mueller, St., 1991. Towards a better understanding of crustal dynamics, IUGG Chronicle, 208, 262-267.
Mueller, St., Egloff, R. & Ansorge, J., 1976. Struktur des tiefen Untergrundes entlang der Schweizer Geotraverse, Schweiz. Mineral. Petrogr. Mitt., 56, 685-692.
Mueller, St., Ansorge, J., Egloff, R. & Kissling, E., 1980. A crustal cross section along the Swiss Geotraversefrom the Rheingraben to the Po Plain, Eclogae geol. Helu., 73(2), 463-483.
Mueller, St., Ansorge, J., Sierro, N., Finckh, P. & Emter, D., 1987. Synoptic interpretation of seismic reflection and refraction data, Geophy. J . R . astr. Soc., 89, 345-352.
Okaya, N., Freeman, R., Kissling, E. & Mueller, St., 1996. A lithospheric cross-section through the Swiss Alps-I. Thermokinematic model- ling of the Neoalpine orogeny, Geophys. J. Int., 125, 504-518. Ord, A. & Hobbs, B.E., 1989. The strength of the continental crust,
detachment zones and the development of plastic instabilities, Tectonophysics, 158, 269-289.
Pavoni, N., 1980. Crustal stresses inferred from fault-plane solutions of earthquakes and neotectonic deformation in Switzerland, Rock Mech. Suppl., 9, 63-68.
Pfiffner, A., 1992. Alpine orogeny, in A Continent Revealed: The European Geotrauerse, pp. 180-190, eds Blundell, D., Freeman, R. & Mueller, St., Cambridge University Press, Cambridge.
10 449-10 477.